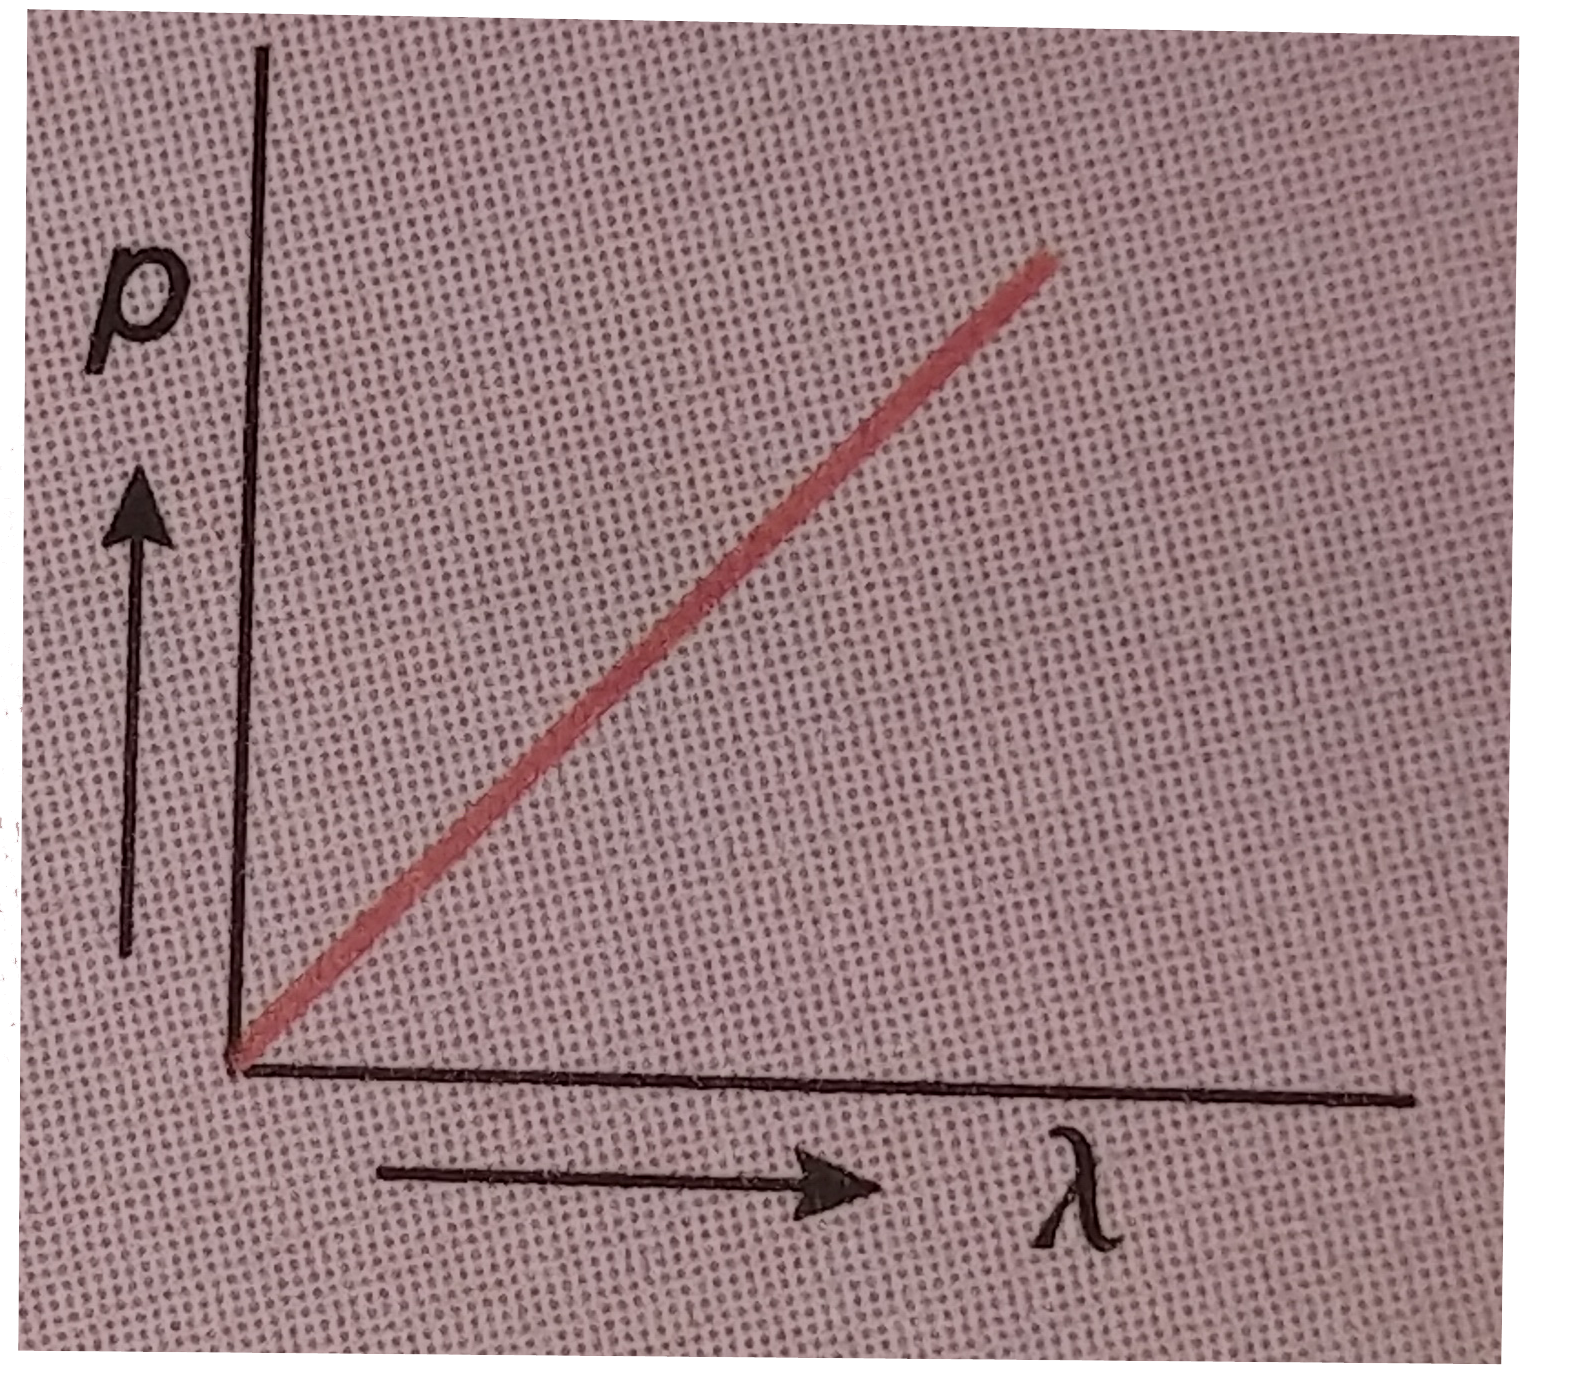
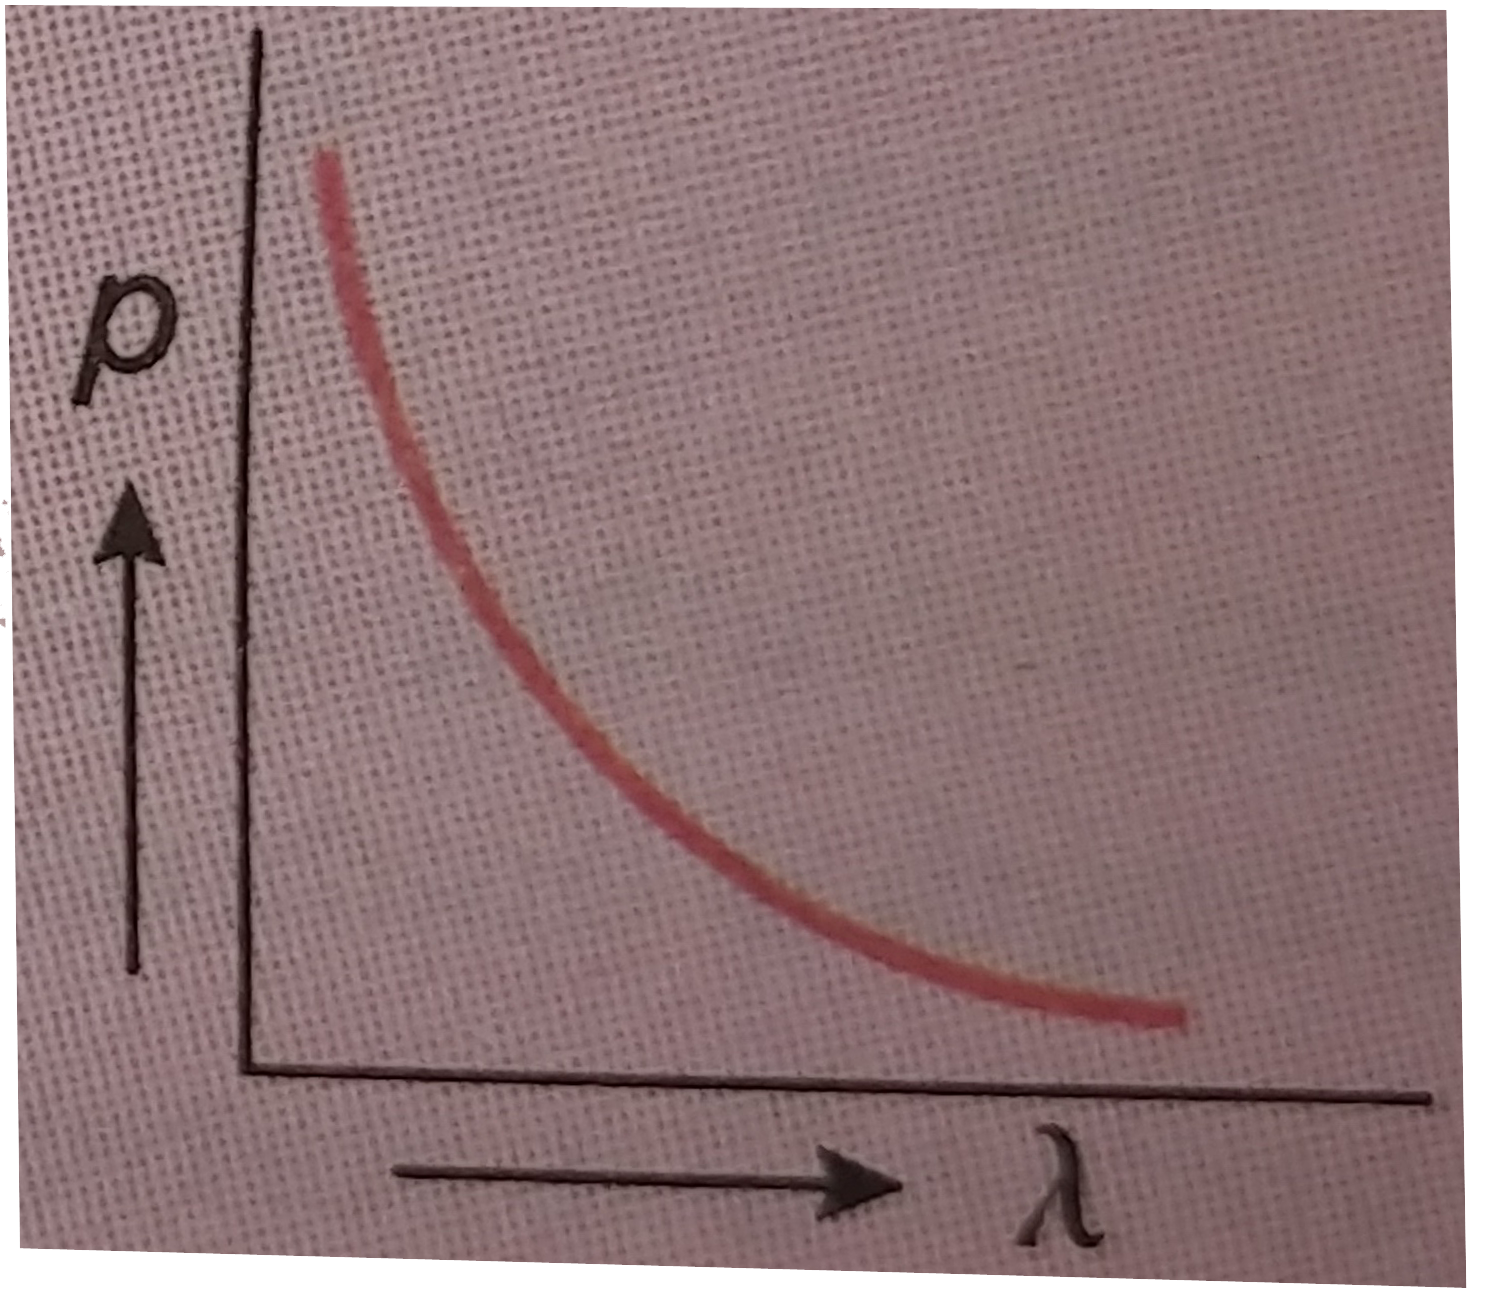
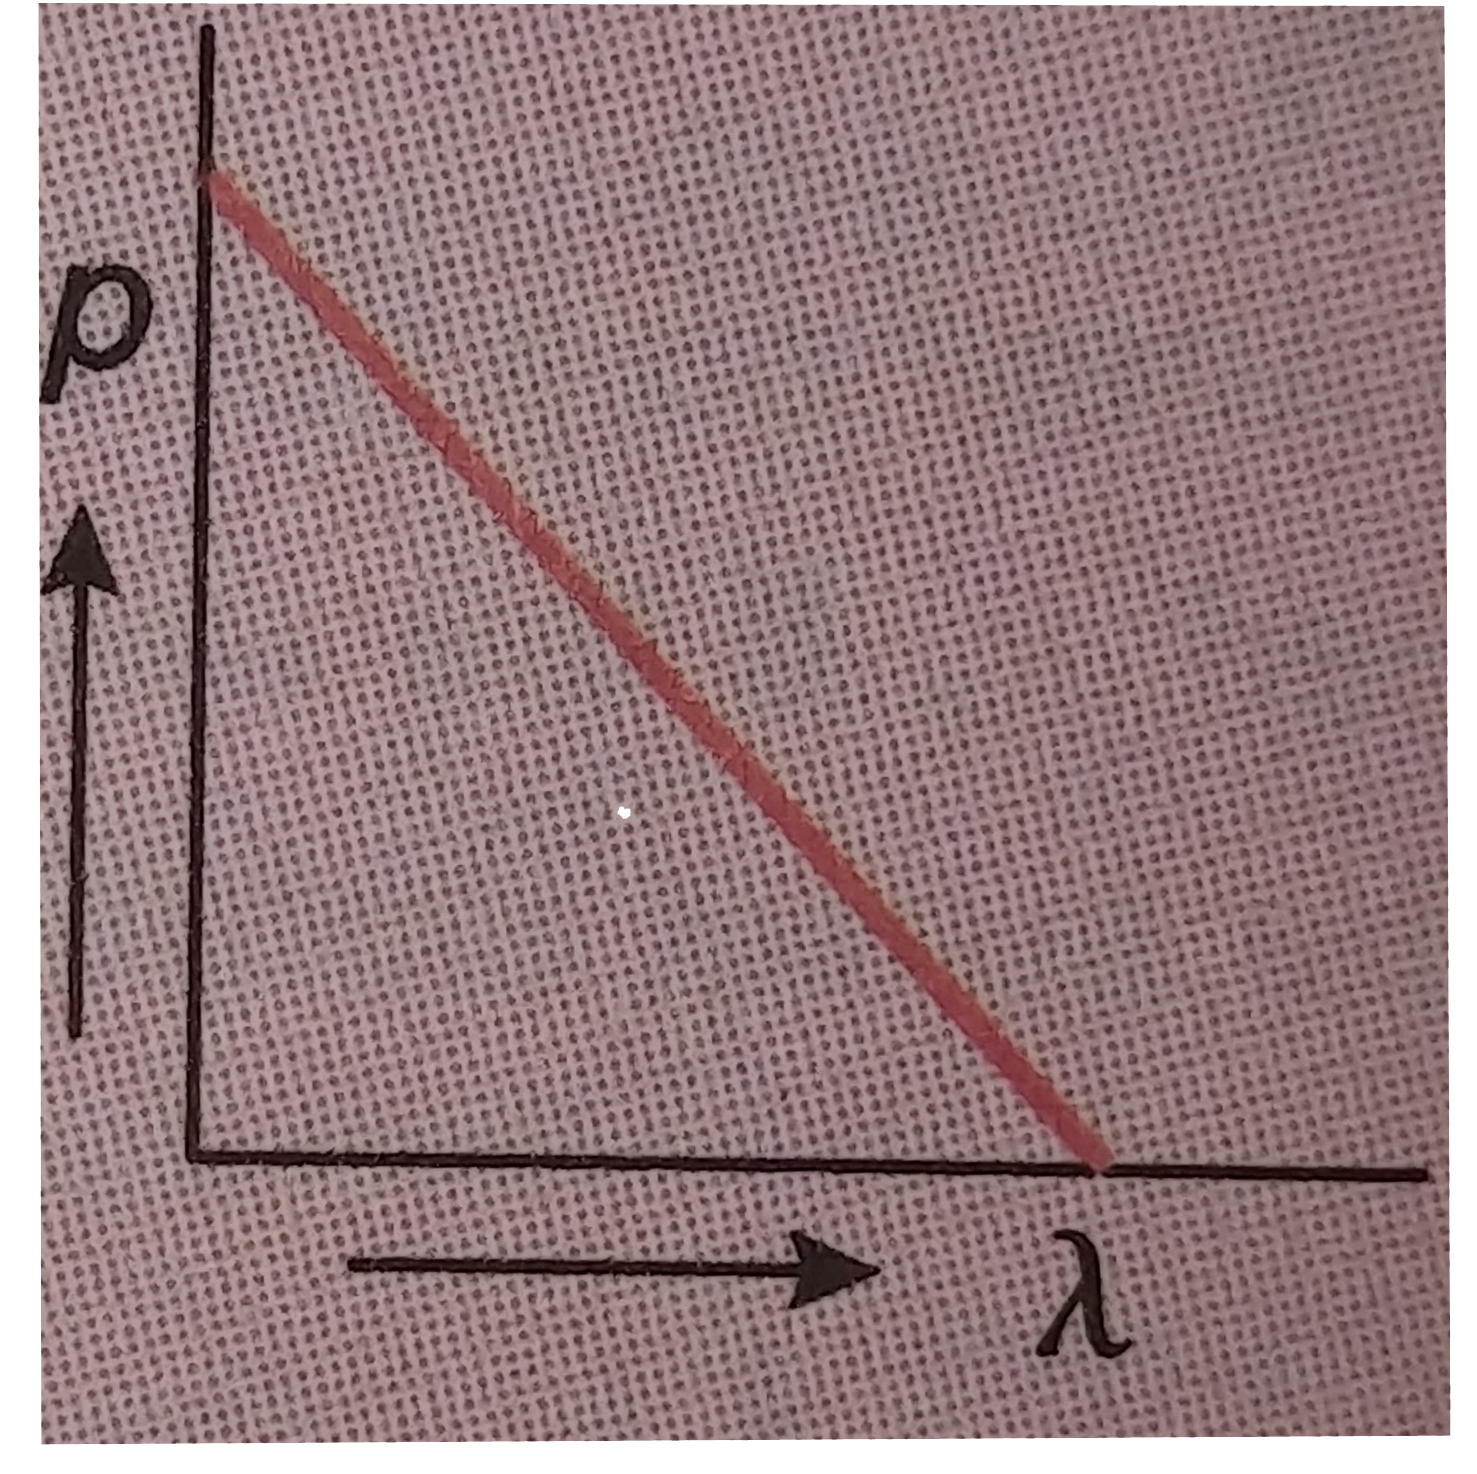
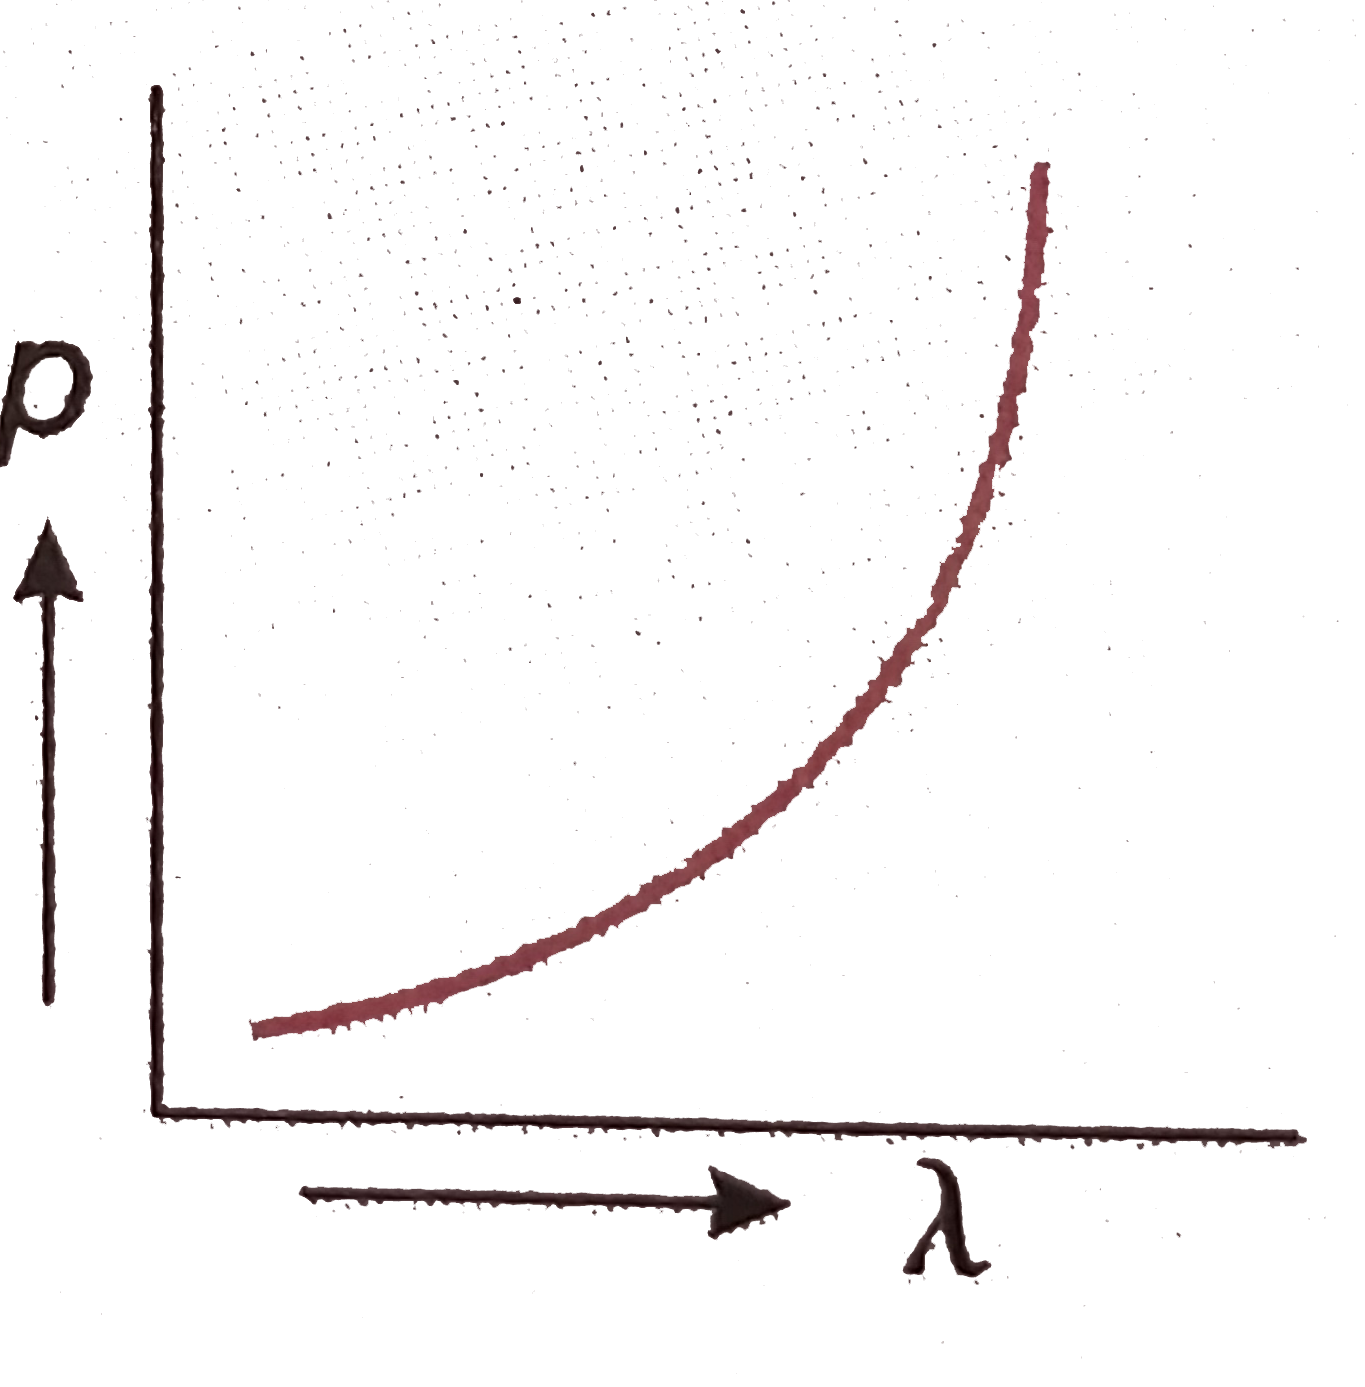
Which of the following figures represent the variation of particle momentum and the associated de Broglie wavelength?
A
B
C
D
Text Solution
The correct Answer is:B
de Broglie wavelength, λ=hp [ p = momentum]
so, pλ=h= constant
∴ The λ−p graph will be rectangular hyperbola.
|
Topper's Solved these Questions
- QUANTUM THEORYBOOK - CHHAYA PUBLICATIONCHAPTER - QUANTUM THEORYEXERCISE - CBSE Scanner
29 Videos
- QUANTUM THEORYBOOK - CHHAYA PUBLICATIONCHAPTER - QUANTUM THEORYEXERCISE - Entrance Corner (Integer answer type)
9 Videos
- OPTICAL INSTRUMENTSBOOK - CHHAYA PUBLICATIONCHAPTER - OPTICAL INSTRUMENTSEXERCISE - CBSE SCANNER
8 Videos
- QUESTION PAPER OF NEET 2017BOOK - CHHAYA PUBLICATIONCHAPTER - QUESTION PAPER OF NEET 2017EXERCISE - QUESTION PAPERS OF (NEET) (2017)
39 Videos
Similar Questions
Knowledge Check
Which of the following figure represents the variation of particle momentum and the associated de - Broglie wavelength ?
A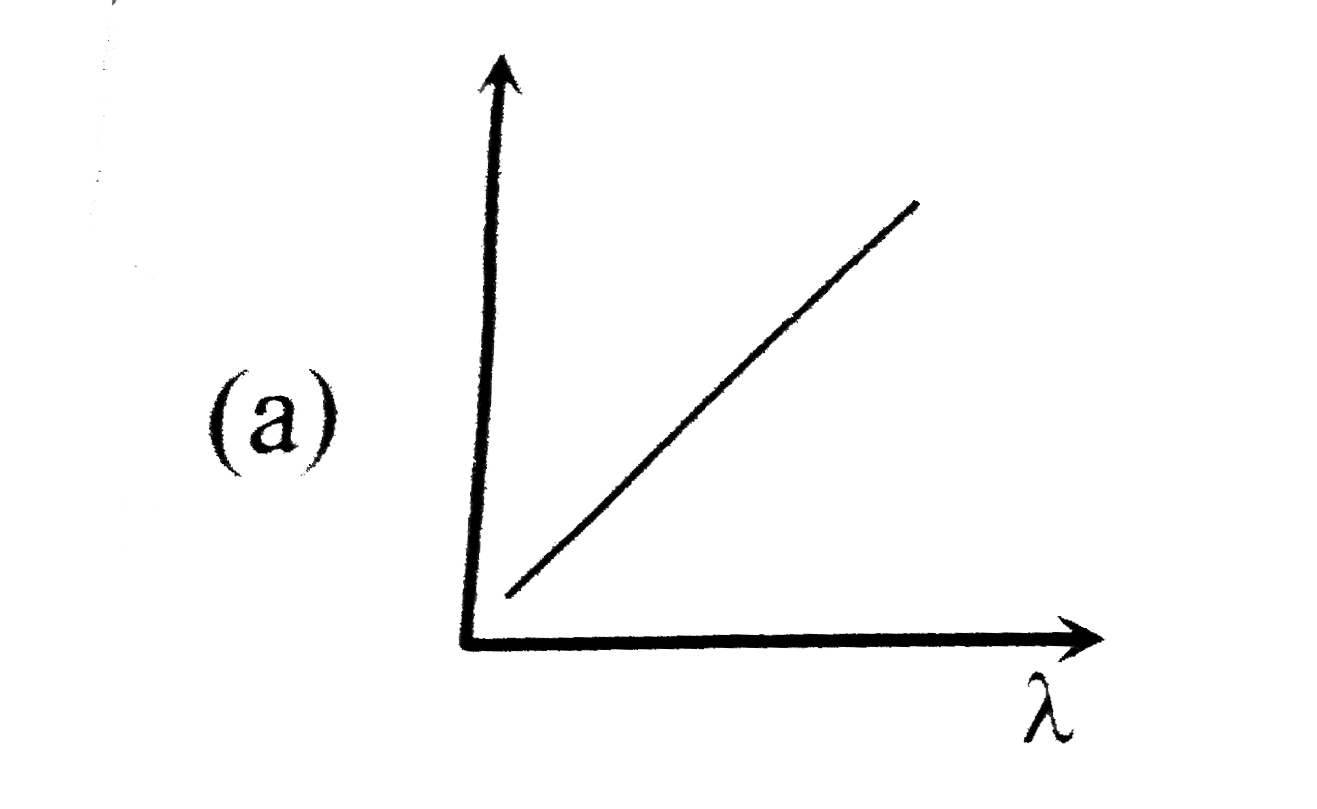 B
B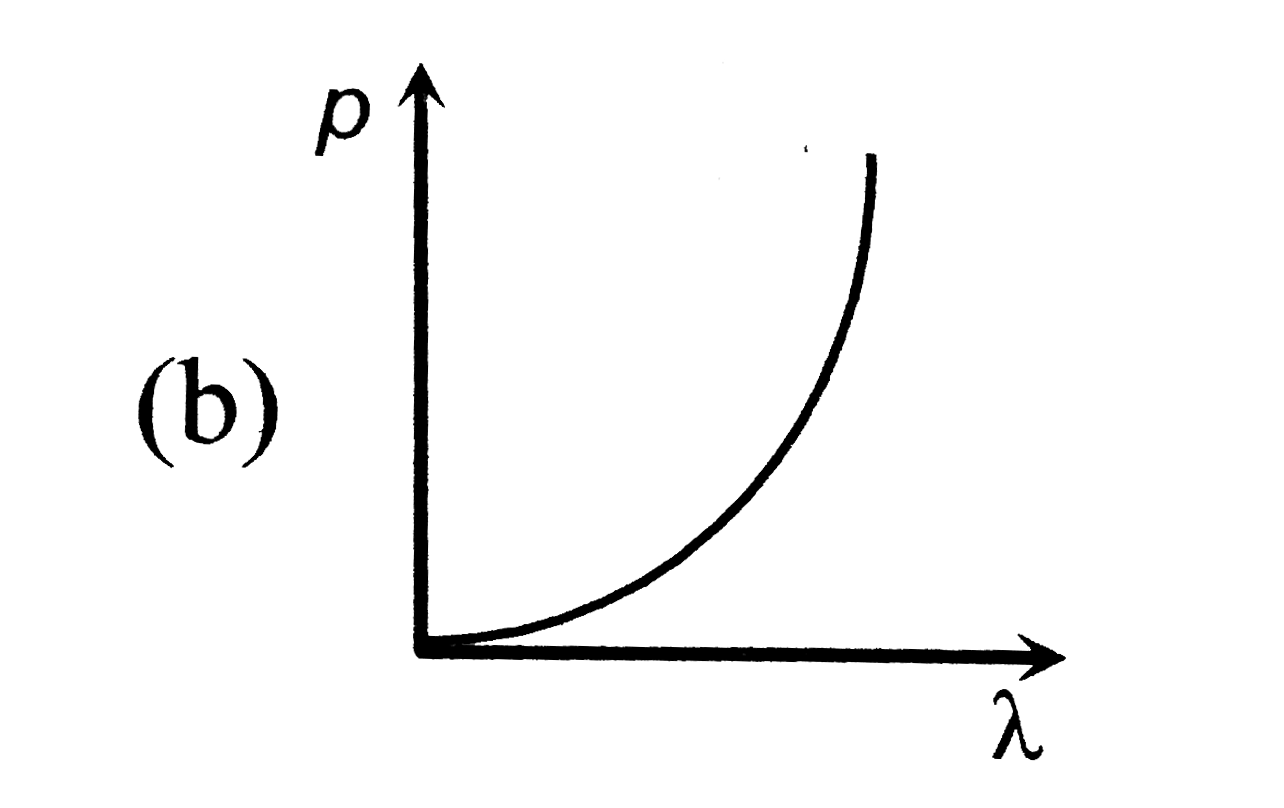 C
C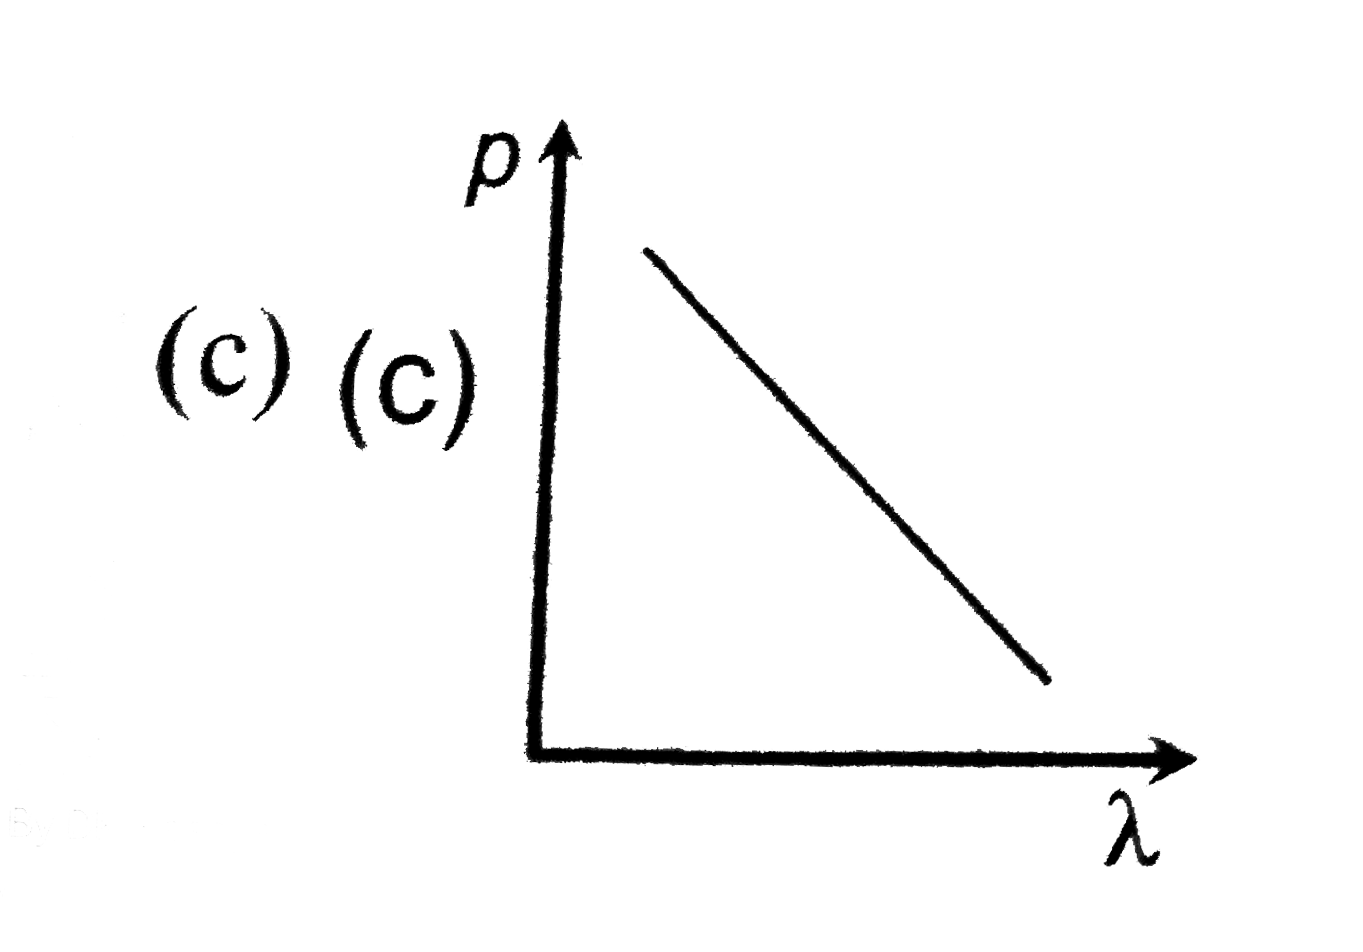 D
D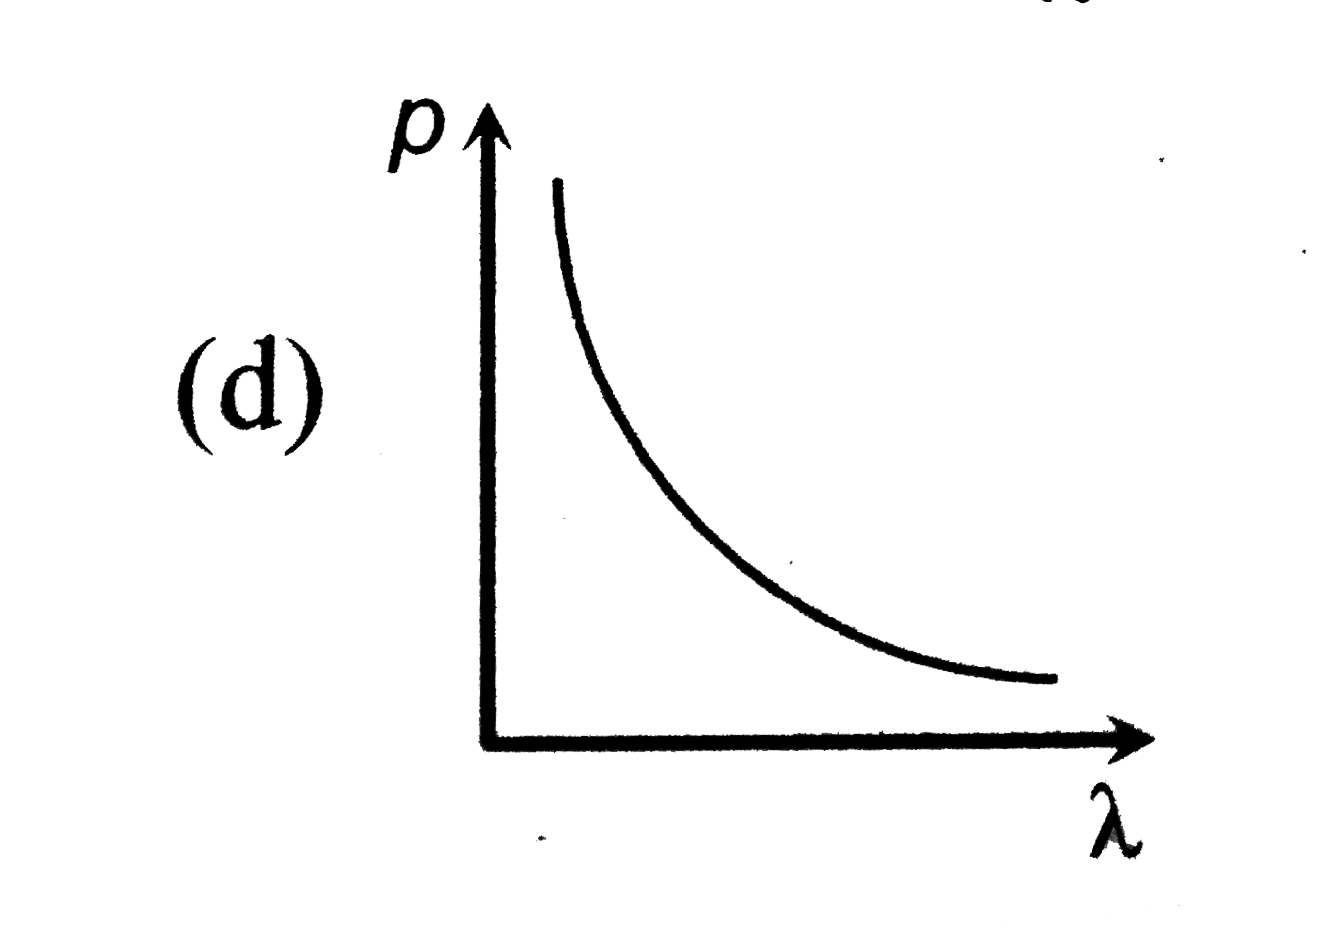
Which of the following figure represents the variation of particle momentum and the associated de - Broglie wavelength ?
A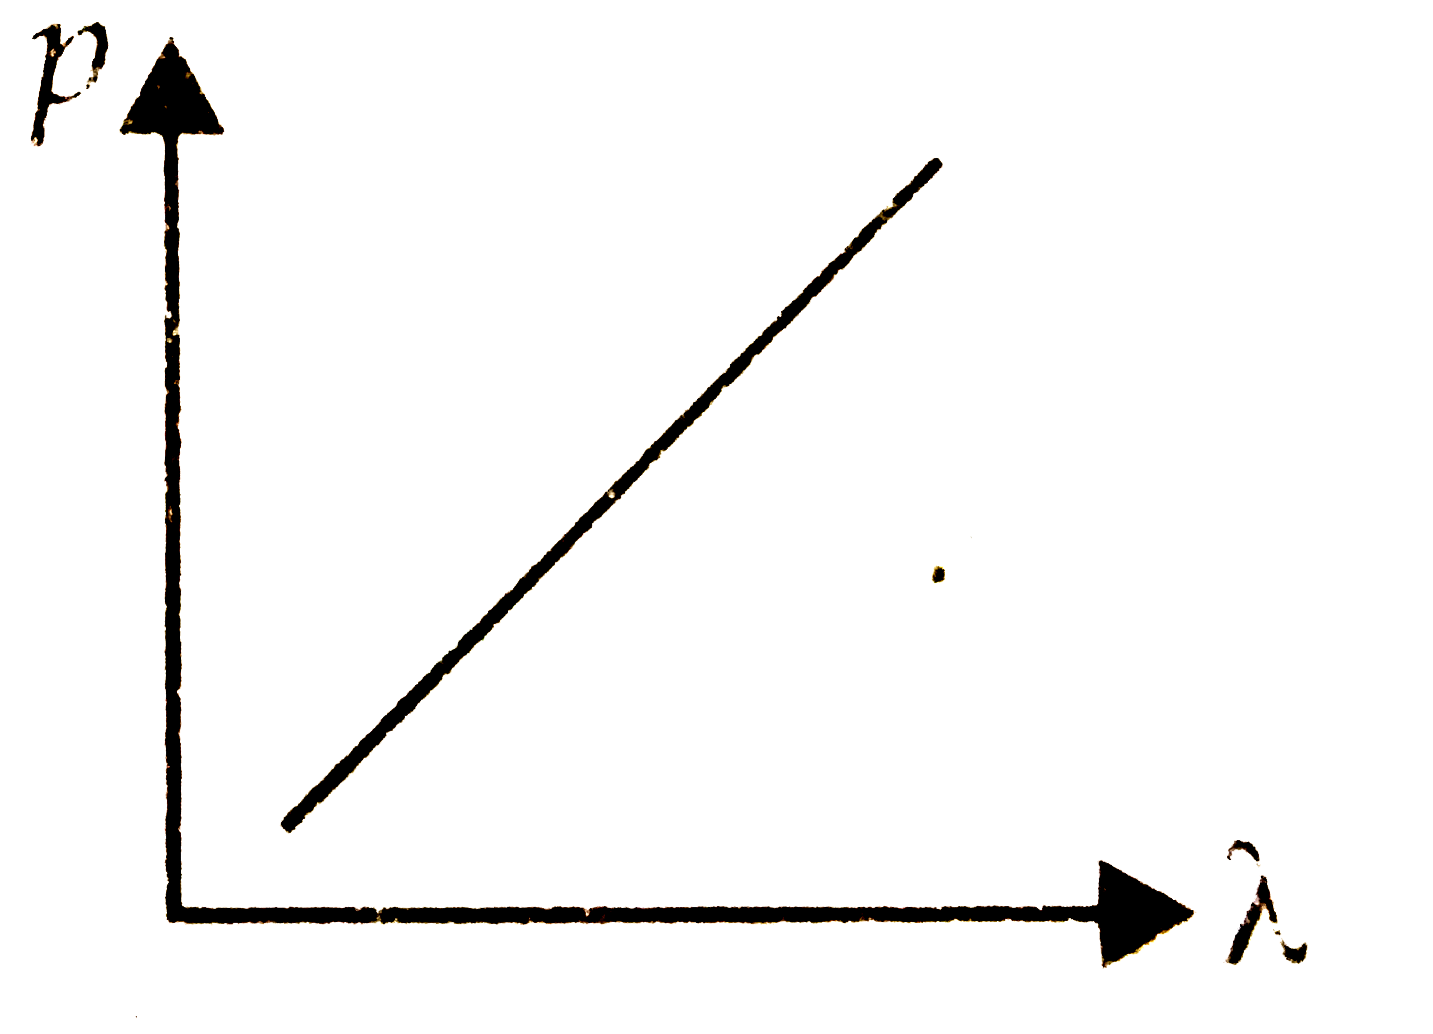 B
B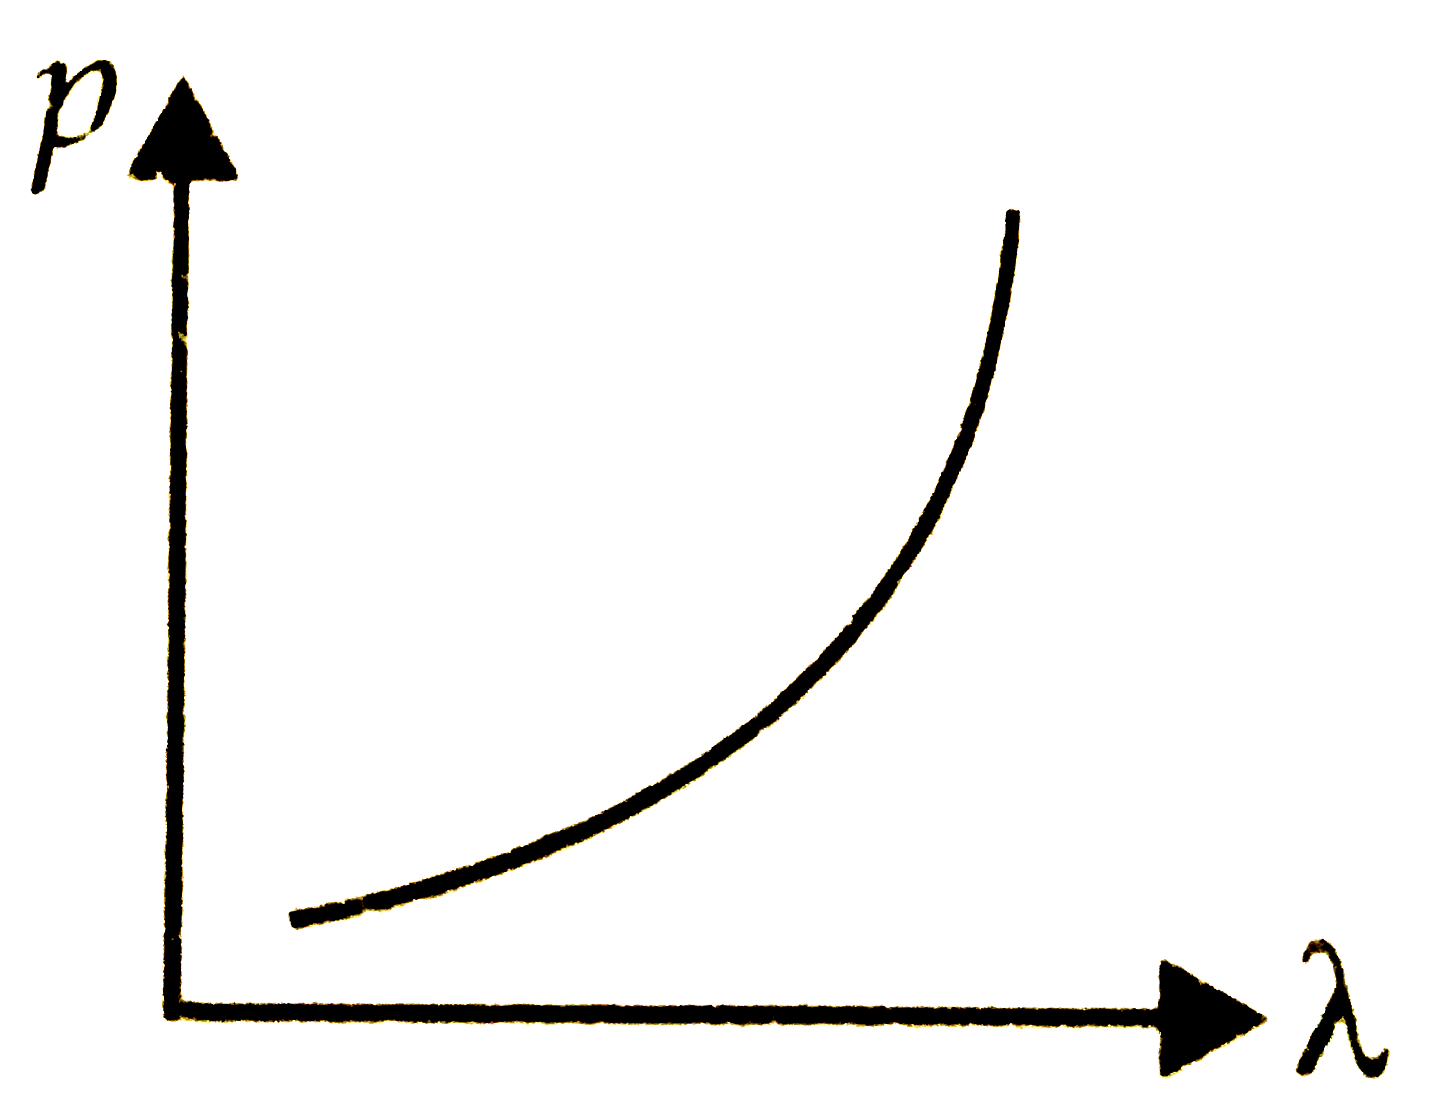 C
C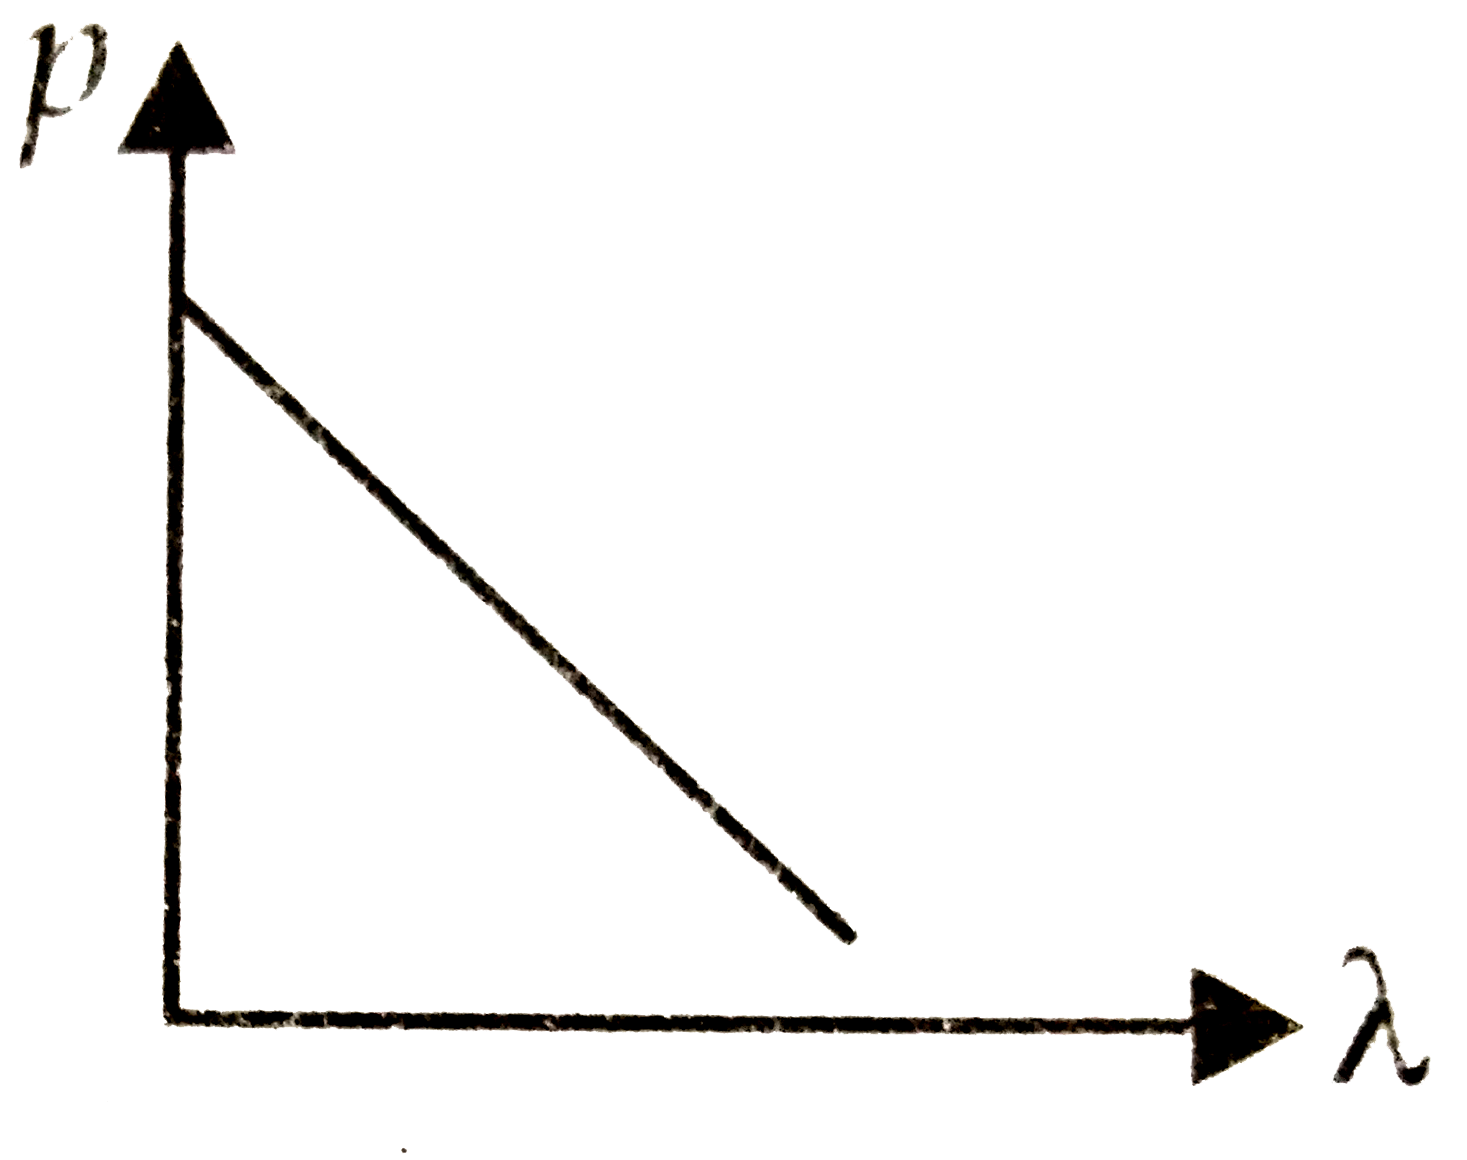 D
D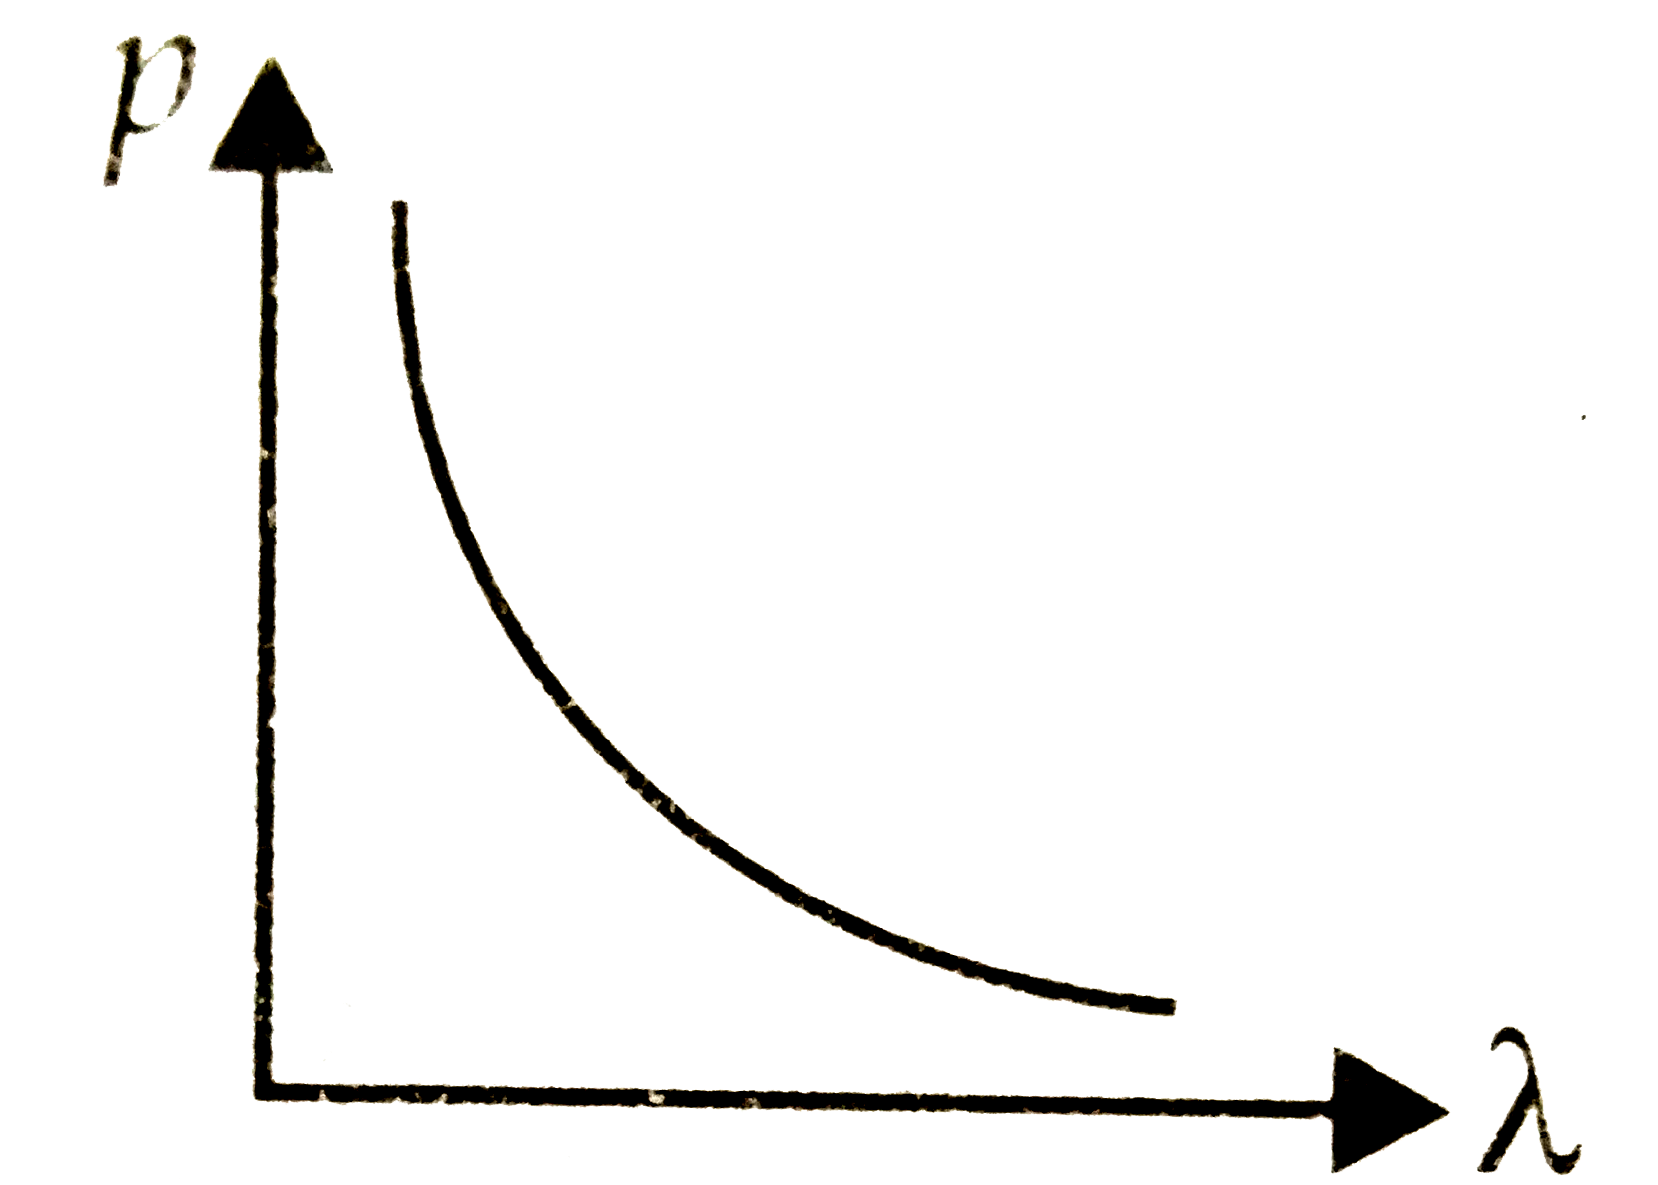
Which of the following figure represents the variation of particle momentum and the associated de - Broglie wavelength ?
A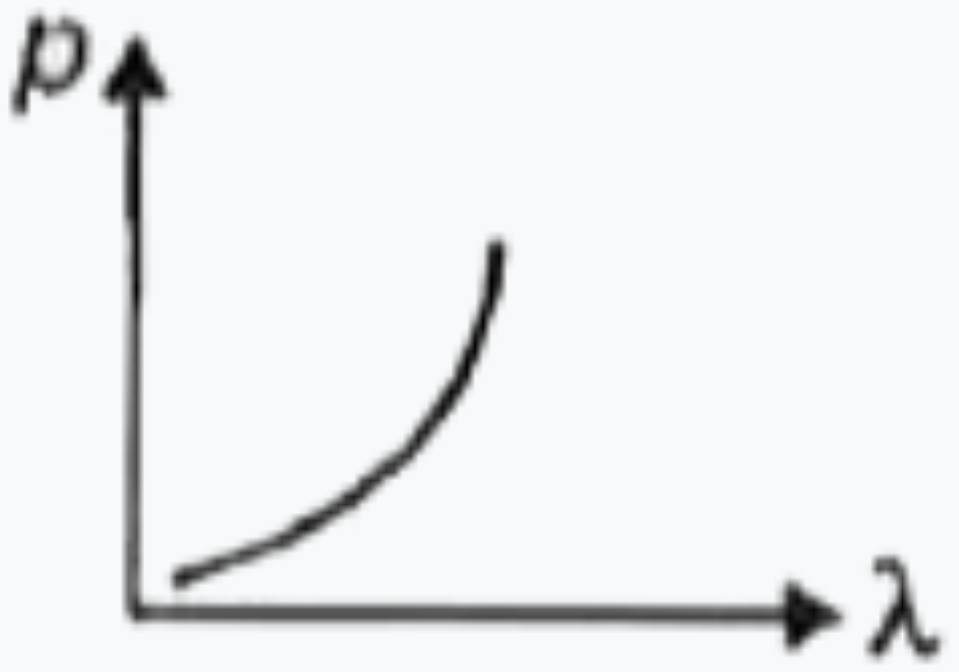 B
B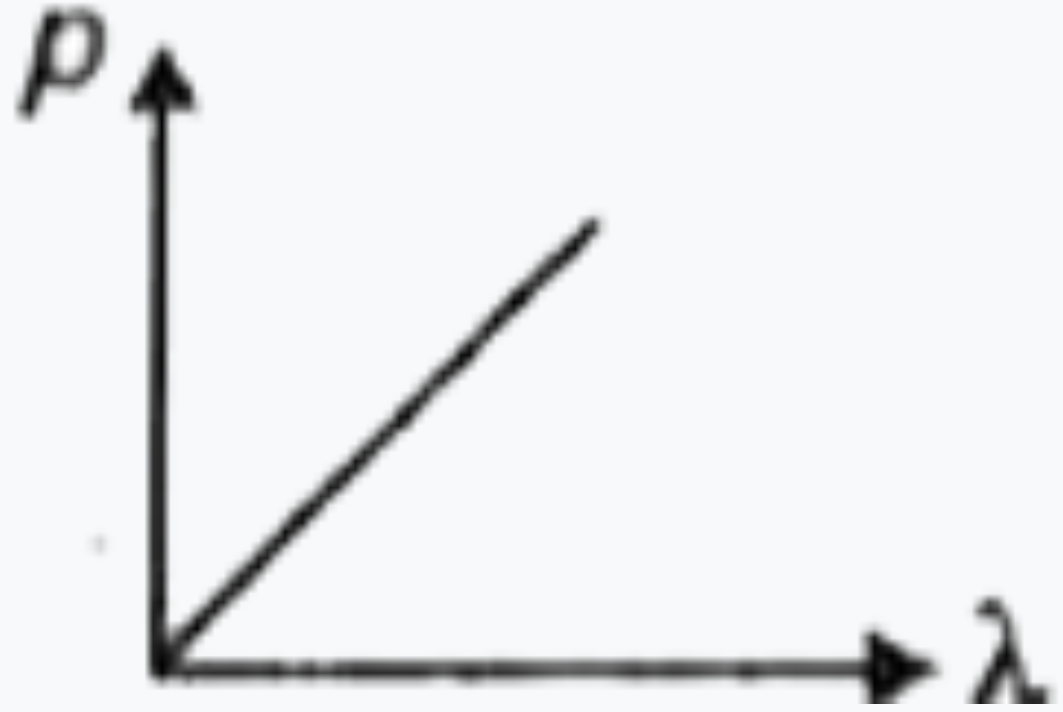 C
C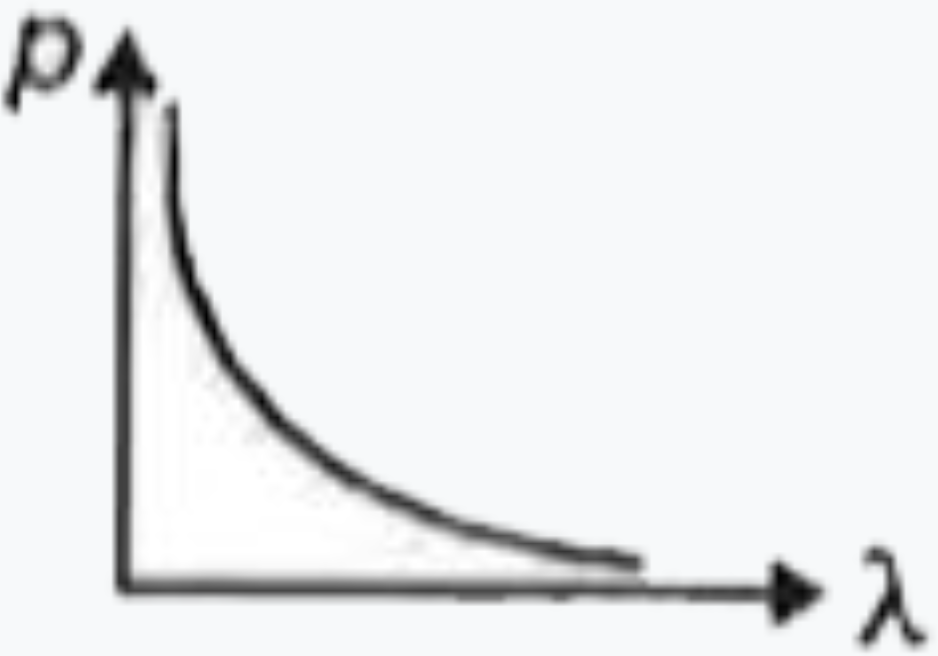 D
D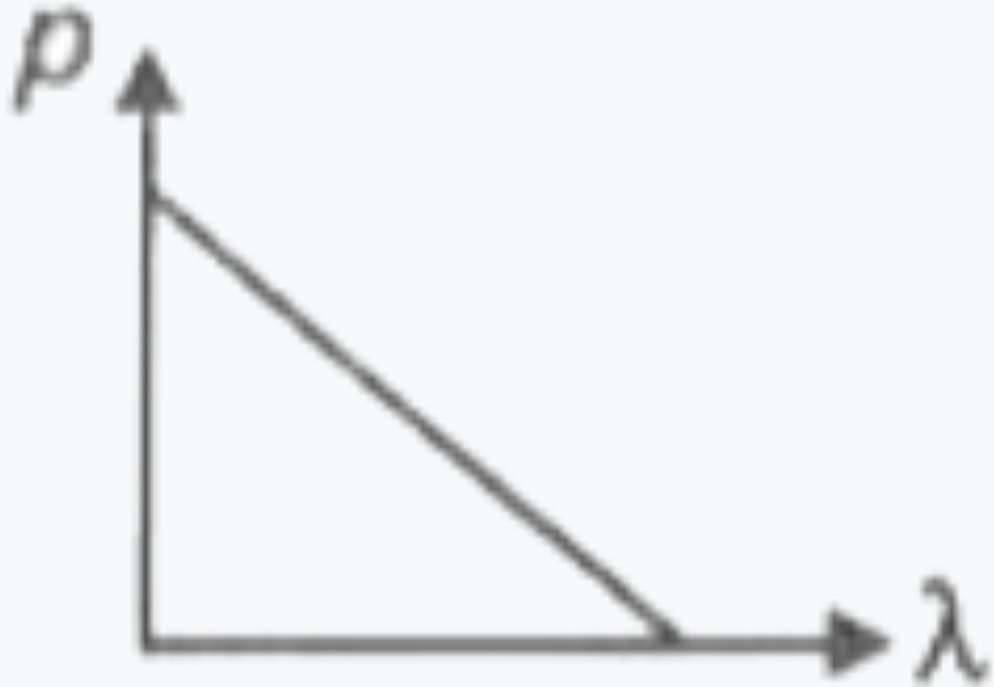
The momentum of a particle associated with de-Broglie's wavelength of 6Å is
View SolutionWhich of the following graph represent the variation of particle momentum and associated de Broglie wavelength?
View SolutionWhich of the following graphs correctly represents the variation of particle momentum with associated de Broglie wavelength?
View SolutionWhich of the following figure represents the variation of particle momentum and the associated de - Broglie wavelength ?
View SolutionThe momentum of a particle associated with de-Broglie's wavelength of 6Å is
View Solution
