Which of the following represents the variation of inductive reactance (XL) with the frequency of voltage source (υ) ? Solution in Kannada
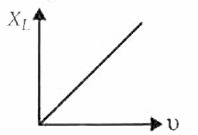
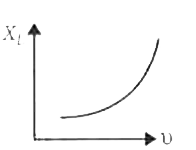
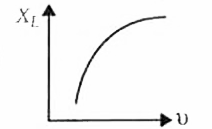
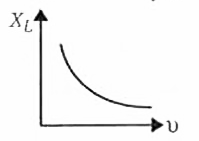
The correct Answer is:A
The inductive reactance is
XL=2ωυL (asω=2πυ)
As XL∝υ , the graph between XLandυ is a straight line .
Thus , option (a) represents the variation of XL with υ
Topper's Solved these Questions
Similar Questions
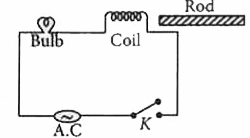
In the A. C. circuit shown, keeping 'K' pressed, if an iron rod is inserted into the coil, the bulb in the circuit
 02:01View Solution
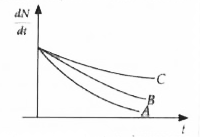
Which one of the following nuclei has shorter mean life?
 01:24View Solution
Which one of the follwing represents the variation of capacitive reactance (XC) with the frequency (v) of the voltage source ? .
01:19View SolutionWhich of the following graphs represent the correct variation of inductive reactance X_(L) with frequency upsilon ?
05:37View Solutionप्रेरण प्रतिघात (X_L) का S.I. पद्धति में मात्रक ________ है
01:57View SolutionIn given figure three curves a, b and c shows variation of resistance, (R) capacitive reactance (X_c) and inductive (X_L) reactance with frequency. Identify the respective curves for these.
01:17View SolutionWhich of the following graphs represent the correct variation of inductive reactance XL with frequency υ?
01:12View SolutionThe frequency of an ac supply is doubled, what happens to inductive reactance XL and capacitive reactance Xc ?
View SolutionHow does inductive reactance.XL of an inductor vary in d.c.and high frequency a.c. circuit ?
07:55View Solution(A) : Reactance offered by an inductor increases with the frequency of the ac source.
(R): The current leads the voltage in a purely inductive network by π/2.View SolutionFill in the blanks : If Omega is the angular frequency of a.c., then the reactance offered by inductance .L.and capaci tance .C. are respectively, [X_L = ……... and X_O = ……………….
01:59View SolutionAn a.c source is connected in a series to an inductance L and a capacitance C, such that the inductive reactance is equal to the capacitive reactance .Then the frequency of the a.c. source is
01:52View SolutionWhich one of the following curve represents variation of capacitive reactance with frequency?
02:54View SolutionThe variation of inductive reactance (X_L) of an inductor with the frequency of the ac sources of 100 V and variable frequency is shown in the figure. Calculate the self inductance of the inductor.
View SolutionDraw the graphs showing variations of inductive reactance and capative reactance with frequency of applied a.c. source.
View Solution

