Which of the following graphs represent the correct variation of inductive reactance XL with frequency υ?

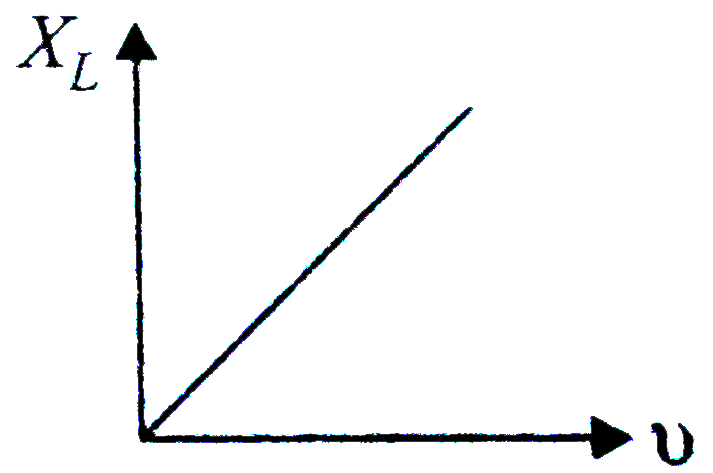
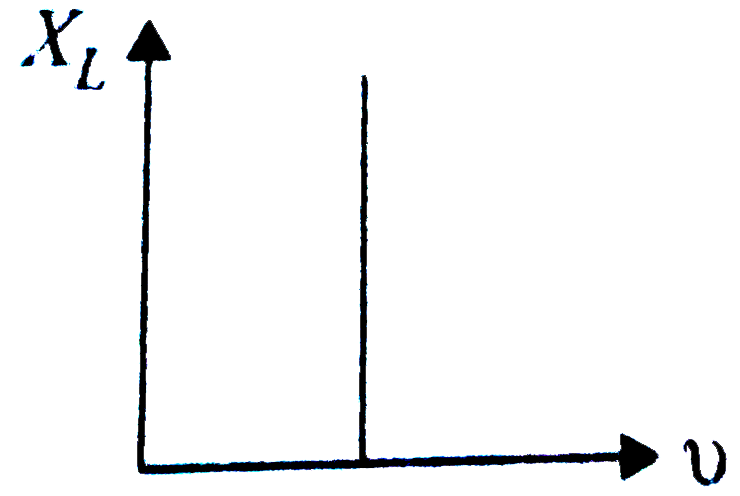
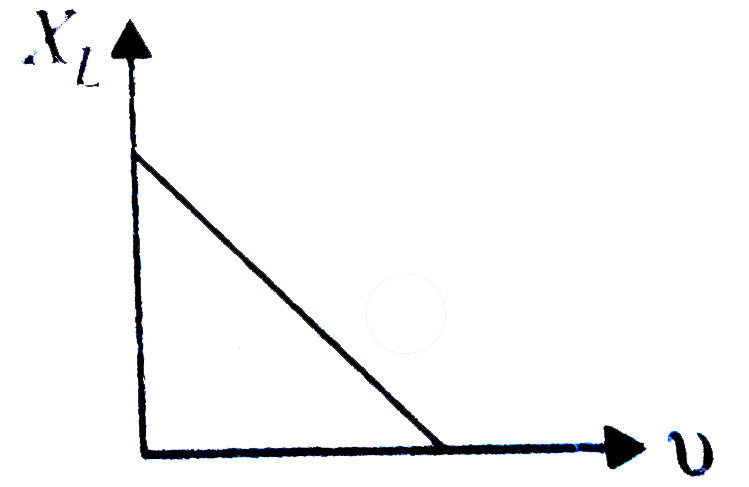
The correct Answer is:B
To solve the question regarding the variation of inductive reactance XL with frequency ν, we can follow these steps:
Step 1: Understand the formula for inductive reactance
The inductive reactance XL in a purely inductive circuit is given by the formula:
XL=2πfL
where:
- XL is the inductive reactance,
- f is the frequency,
- L is the inductance.
Step 2: Analyze the relationship between XL and f
From the formula, we can see that XL is directly proportional to the frequency f. This means that as the frequency increases, the inductive reactance also increases linearly.
Step 3: Identify the type of graph
Since XL is directly proportional to f, the relationship can be represented as:
XL∝f
This implies that if we were to plot XL on the y-axis and f on the x-axis, the graph would be a straight line passing through the origin.
Step 4: Compare with the given options
Now, we need to look at the provided graphs and identify which one represents a linear relationship. The correct graph will show a straight line indicating that XL increases linearly with f.
Step 5: Conclusion
Upon examining the options, we find that Option B represents the correct variation of inductive reactance XL with frequency ν as it shows a linear relationship.
Summary of the Solution
The inductive reactance XL varies linearly with frequency f, and the correct graph representing this relationship is Option B.
---
The inductive reactance XL in a purely inductive circuit is given by the formula:
XL=2πfL
where:
- XL is the inductive reactance,
- f is the frequency,
- L is the inductance.
From the formula, we can see that XL is directly proportional to the frequency f. This means that as the frequency increases, the inductive reactance also increases linearly.
Since XL is directly proportional to f, the relationship can be represented as:
XL∝f
This implies that if we were to plot XL on the y-axis and f on the x-axis, the graph would be a straight line passing through the origin.
Now, we need to look at the provided graphs and identify which one represents a linear relationship. The correct graph will show a straight line indicating that XL increases linearly with f.
Upon examining the options, we find that Option B represents the correct variation of inductive reactance XL with frequency ν as it shows a linear relationship.
The inductive reactance XL varies linearly with frequency f, and the correct graph representing this relationship is Option B.
Topper's Solved these Questions
Similar Questions
Knowledge Check
- Question 1 - Select One
Which of the following graph represents correct graph for SN1 reaction :
A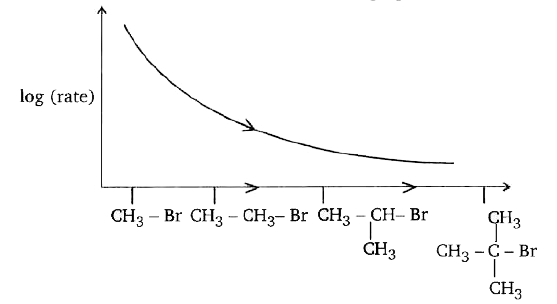 B
B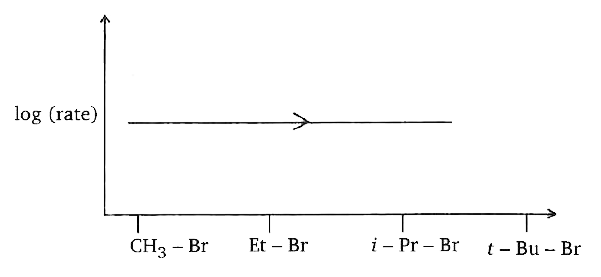 C
C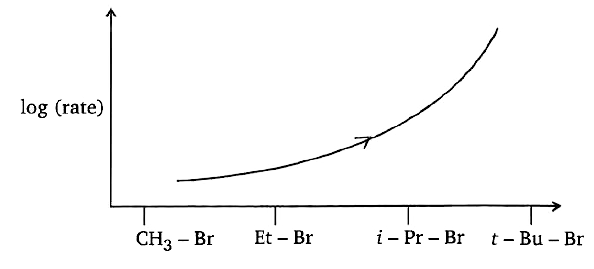 D
D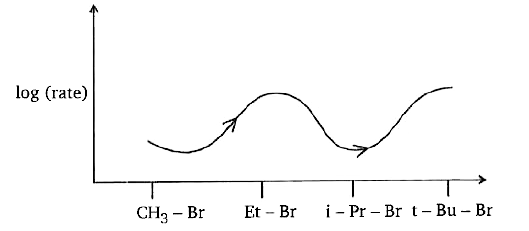
- Question 2 - Select One
Which of the following represents the correct graph for SN2 reaction ?
A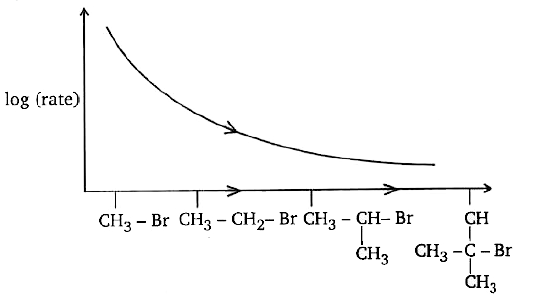 B
B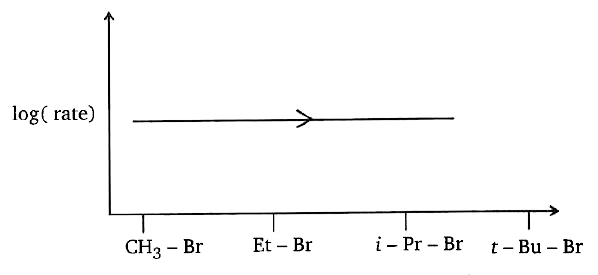 C
C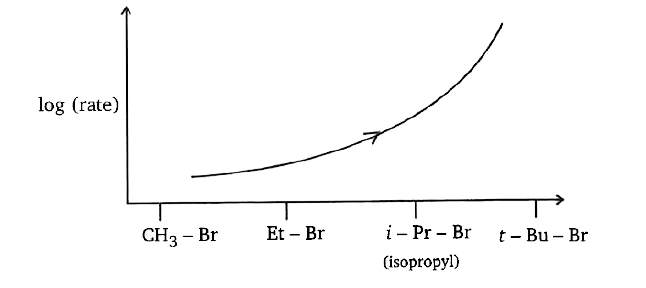 D
D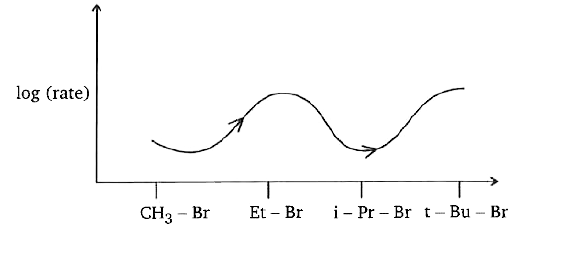
- Question 3 - Select One
Identify the graph which correctly reperesents the variation of capacitive reactance XC with frequency
A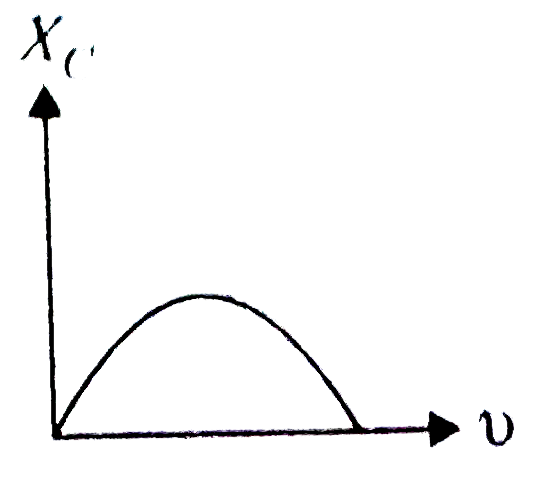 B
B C
C D
D
Which of the following graphs correctly represents the variation of g on the - Earth?
View SolutionIdentify the graph which correctly reperesents the variation of capacitive reactance XC with frequency
View SolutionWhich of the following graphs best represents the variation of acceleration 'a' with displacement x?
View SolutionThe correct variation of resistance R with frequency f is given by
View SolutionWhich of the following x-t graphs does not represent periodic motion?
View Solution


