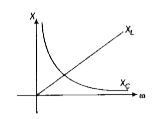
Graphically show the variation of inductive reactance and capacitive reactance with frequency of AC.
Similar Questions
(i) Draw the graphs showing variation of inductive reactance and capacitive reactance with frequency of applied a.c. source.
(ii) Can the voltage drop across the inductor or the capacitor in a series LCR circuit be greater than the applied voltage of the a.c. source ? Justify your answer.
View SolutionHow will the inductive reactance and capacitive reactance change on doubling the frequency of AC ?
View SolutionHow capacitive reactance depends on the frequency of AC ?
View SolutionSketch a graph showing the variation of capacitive reactance with the change in frequency of the a.c. source.
View SolutionHow inductive reactance depends on the frequency of AC ?
View SolutionPlot a graph showing variation of capacitive reactance with the change in the frequency of the AC source.
View SolutionExplain the term 'capacitive reactance'.Show graphically the variation of capacitive reactance with frequency of the applied alternating voltage.
An a.c. voltage E=E0sinωt is applied a across a pure capacitor C.Show mathematically that the current flowing through it leads the applied voltage by a phase angle of π/2
View SolutionHow will be inductive reactance and capacitive reactance change on decreasing the frequency of alternating current to zero from an initial value?
View SolutionDraw a labelled graph showing the variation of inductive reactance (XL) verses frequency (f)
View Solution

