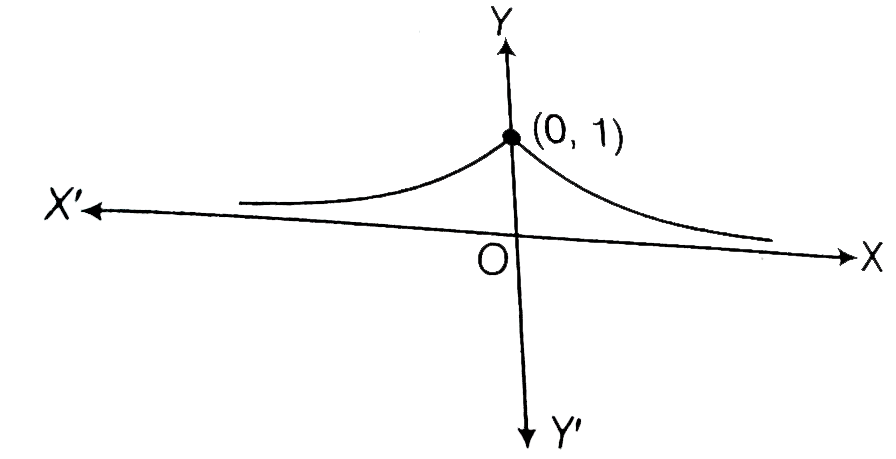
Which one of the following graphs best represents the ways in which the total power P radiated by a black body depends upon the thermodynamic temperature T of the body?


The correct Answer is:C
The total power radiated by a black body of area A at temperature TK is given by
Where Stefan.s constant
Which is best represented in graph. (c )
Topper's Solved these Questions
- BOOK - DISHA PUBLICATIONCHAPTER - THERMAL PROPERTIES OF MATTER EXERCISE - Exercise-2 (Concept Applicator)28videos
THERMAL PROPERTIES OF MATTER
- BOOK - DISHA PUBLICATIONCHAPTER - THERMAL PROPERTIES OF MATTER EXERCISE - Exercise-2 (Concept Applicator)28videos
THERMAL PROPERTIES OF MATTER
- BOOK - DISHA PUBLICATIONCHAPTER - SYSTEM OF PARTICLES & ROTATIONAL MOTION EXERCISE - EXERCISE-2 : CONCEPT APPLICATOR28videos
SYSTEM OF PARTICLES & ROTATIONAL MOTION
- BOOK - DISHA PUBLICATIONCHAPTER - THERMODYNAMICS EXERCISE - EXERCISE -2 : CONCEPT APPLICATOR29videos
THERMODYNAMICS
Similar Questions
Knowledge Check
- Question 1 - Select One
Which one of the following is not a "Black-body" ?
AA highly polished black carBUniforn temperature enclosureCPlatinum blackDThe sun. - Question 2 - Select One
which of the following graph represents the variation of resistivity (ρ) with temperature (T) for copper?
A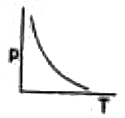 B
B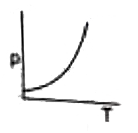 C
C D
D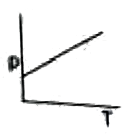
- Question 3 - Select One
Which of the following is the least black body?
ACoalBSunCFerry's black bodyDWien's black body
Which of the following position versus time graphs represents a a body at rest?
View SolutionWhich of the following graphs shows the correct variation in intensity of heat radiations by black body and frequency at a fixed temperature
 .View Solution
Following graphs shows the variation in the intensity of heat radiations by the the black body and frequency at a fixed temperature . Choose the correct option.
View SolutionWhich one of the following graphs shows the rate at which heat is emitted from a hot body as a function of its Kelvin temperature T' ?
View SolutionWhich of the following graphs represents the graphical relation between momentum (p) and kinetic energy (K) for a body in motion?
View Solution

