Which one of the following graphs shows the rate at which heat is emitted from a hot body as a function of its Kelvin temperature T' ?
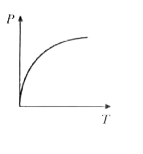
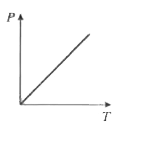
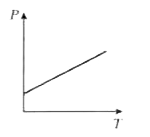
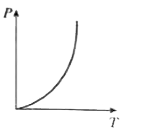
The correct Answer is:D
To determine which graph shows the rate at which heat is emitted from a hot body as a function of its Kelvin temperature T′, we can follow these steps:
Step 1: Understand the relationship
The rate of heat emission from a hot body is described by Stefan-Boltzmann Law, which states that the rate of heat emission R is proportional to the fourth power of the absolute temperature T (in Kelvin). Mathematically, this can be expressed as:
R∝T4
Step 2: Analyze the relationship
Since R is proportional to T4, we can express this as:
R=kT4
where k is a constant. This indicates that as the temperature increases, the rate of heat emission increases rapidly.
Step 3: Identify the graph shape
The graph of R versus T′ (where T′ is the temperature in Kelvin) will not be a straight line because it is a fourth-degree polynomial relationship. Instead, it will be a curve that starts from the origin and rises steeply as T′ increases.
Step 4: Review the options
Given the description of the graphs provided in the question, we need to identify which graph represents a curve that starts at the origin and rises steeply, indicating the fourth power relationship.
Step 5: Select the correct graph
Upon reviewing the options, the graph that shows an upward curve starting from the origin is the one that represents the relationship R∝T4.
Conclusion
Therefore, the correct answer is Option 4, as it depicts the rate of heat emission as a function of Kelvin temperature T′ with the appropriate curve shape.
---
The rate of heat emission from a hot body is described by Stefan-Boltzmann Law, which states that the rate of heat emission R is proportional to the fourth power of the absolute temperature T (in Kelvin). Mathematically, this can be expressed as:
R∝T4
Since R is proportional to T4, we can express this as:
R=kT4
where k is a constant. This indicates that as the temperature increases, the rate of heat emission increases rapidly.
The graph of R versus T′ (where T′ is the temperature in Kelvin) will not be a straight line because it is a fourth-degree polynomial relationship. Instead, it will be a curve that starts from the origin and rises steeply as T′ increases.
Given the description of the graphs provided in the question, we need to identify which graph represents a curve that starts at the origin and rises steeply, indicating the fourth power relationship.
Upon reviewing the options, the graph that shows an upward curve starting from the origin is the one that represents the relationship R∝T4.
Therefore, the correct answer is Option 4, as it depicts the rate of heat emission as a function of Kelvin temperature T′ with the appropriate curve shape.
Topper's Solved these Questions
- BOOK - RESNICK AND HALLIDAYCHAPTER - HEAT-MEASUREMENT AND TRANSFEREXERCISE - PRACTICE QUESTIONS(MORE THAN ONE CORRECT CHOICE TYPE )8videos
HEAT-MEASUREMENT AND TRANSFER
- BOOK - RESNICK AND HALLIDAYCHAPTER - HEAT-MEASUREMENT AND TRANSFEREXERCISE - PRACTICE QUESTIONS( LINKED COMPREHENSION)9videos
HEAT-MEASUREMENT AND TRANSFER
- BOOK - RESNICK AND HALLIDAYCHAPTER - HEAT-MEASUREMENT AND TRANSFEREXERCISE - PROBLEMS35videos
HEAT-MEASUREMENT AND TRANSFER
- BOOK - RESNICK AND HALLIDAYCHAPTER - GRAVITATIONEXERCISE - PRACTICE QUESTIONS (INTEGER TYPE)4videos
GRAVITATION
- BOOK - RESNICK AND HALLIDAYCHAPTER - HYDROGEN ATOMEXERCISE - PRACTICE QUESTIONS(Integer Type)6videos
HYDROGEN ATOM
Similar Questions
Knowledge Check
- Question 1 - Select One
Which of the following graphs correctly shows variation of coefficient of volume expansion of copper as a function of temperature ?
A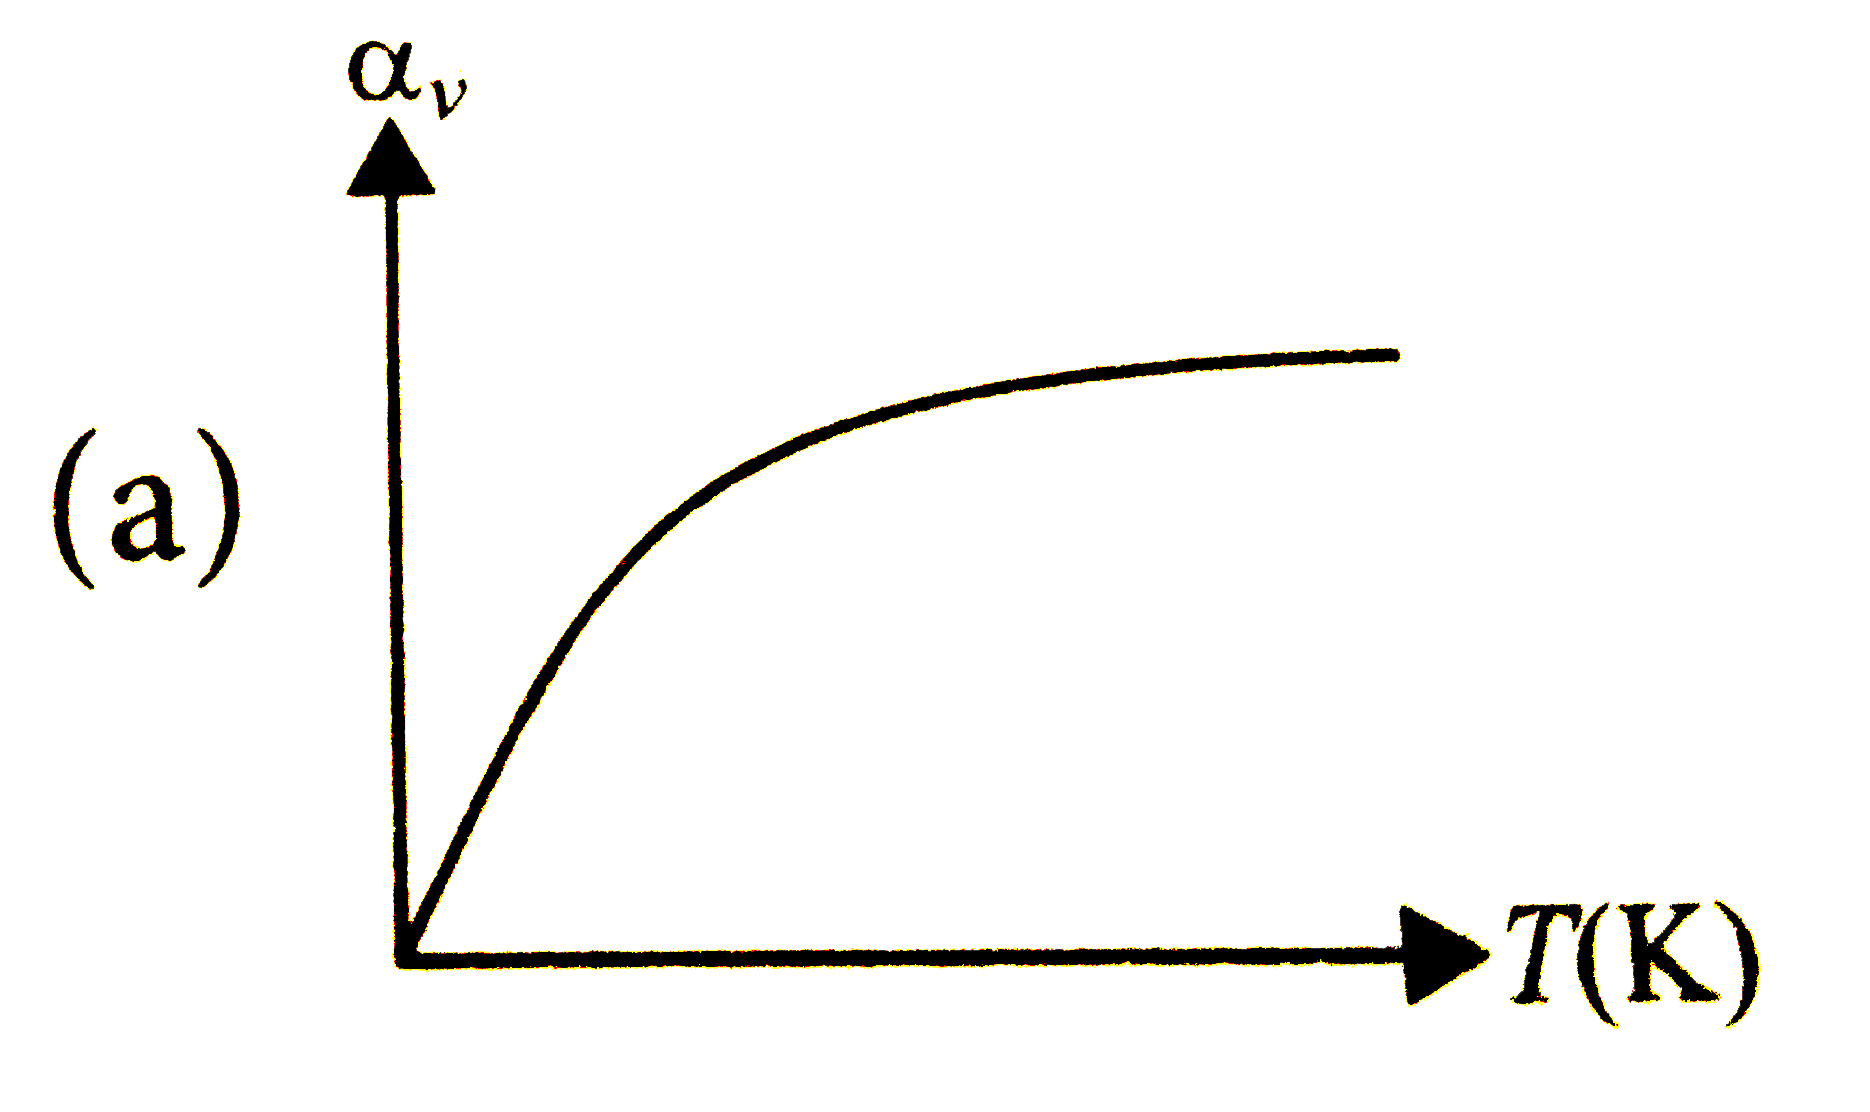 B
B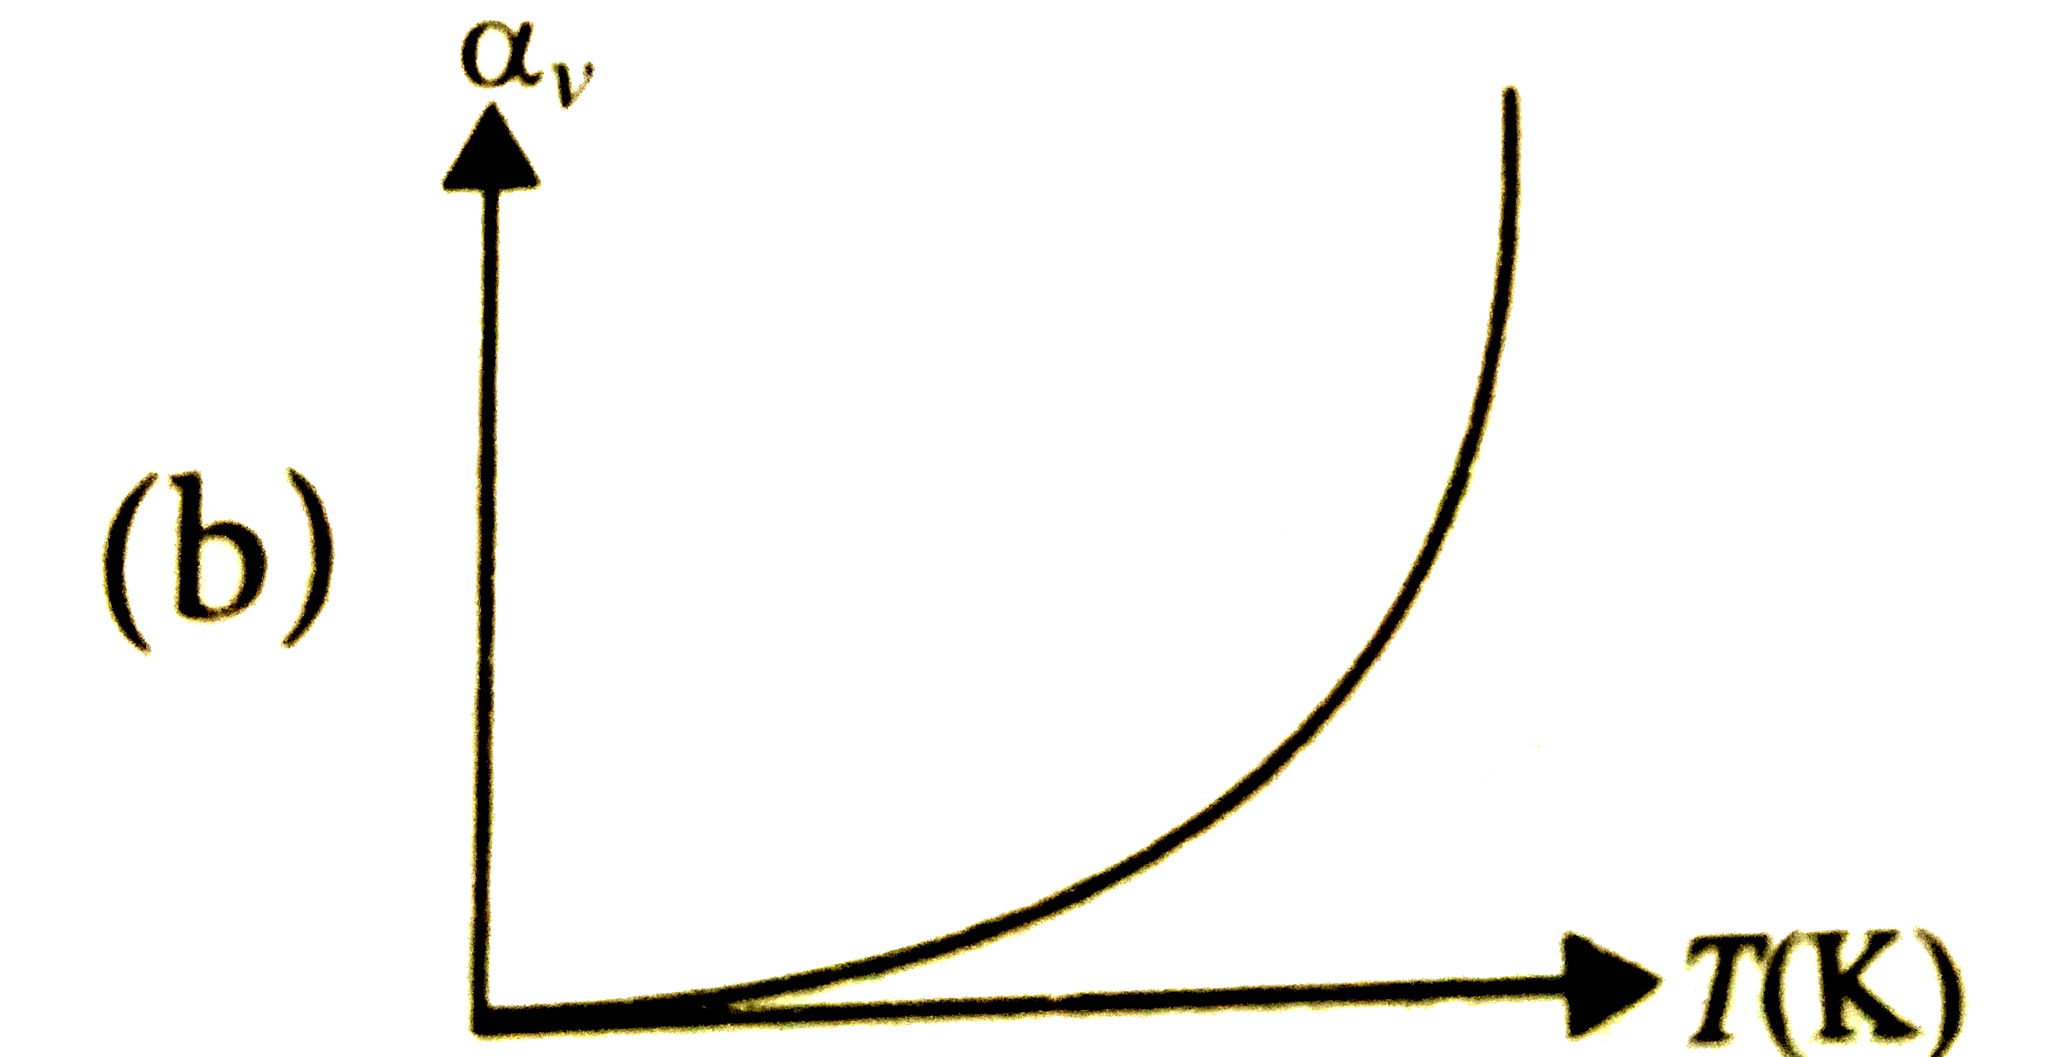 C
C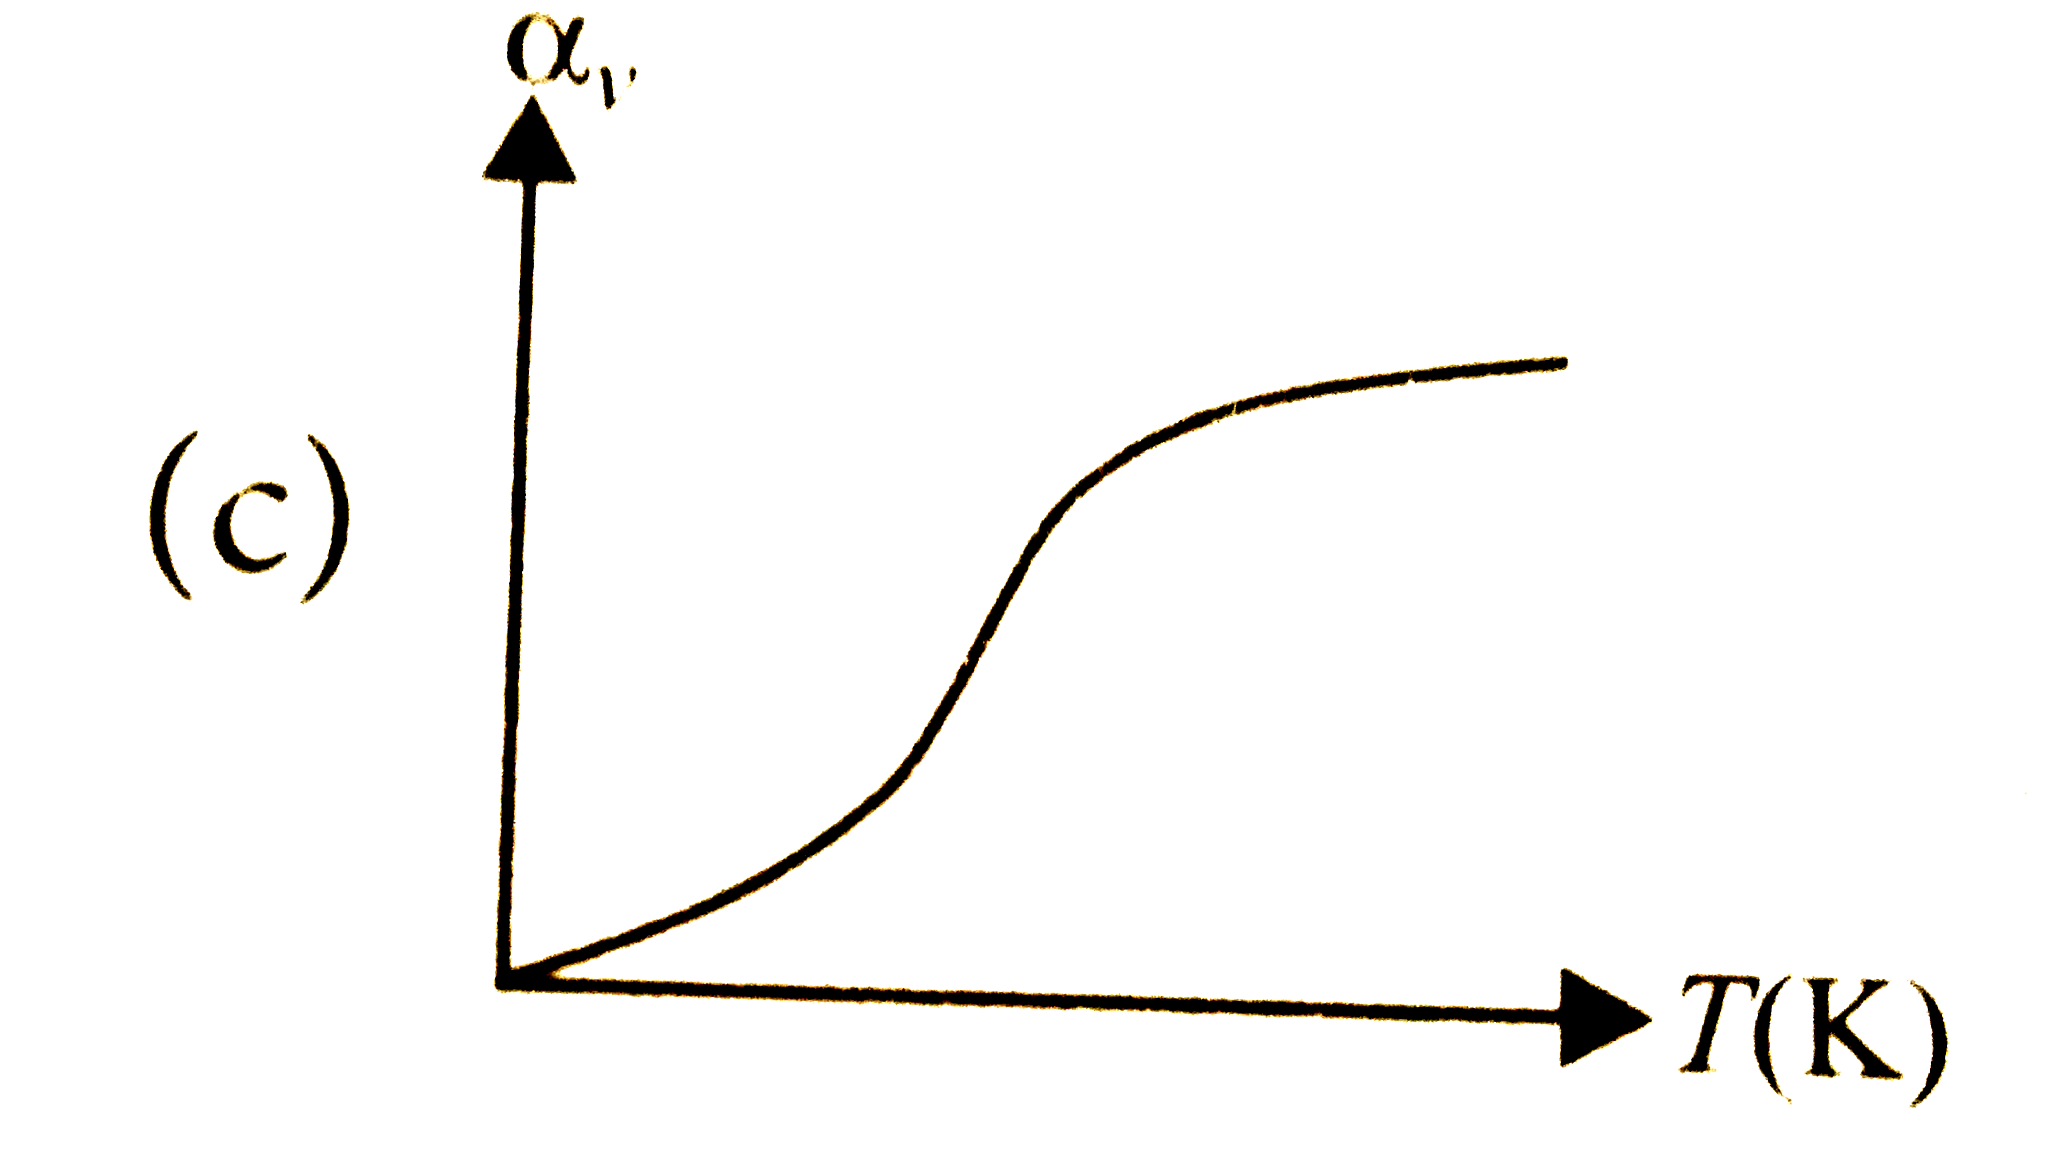 D
D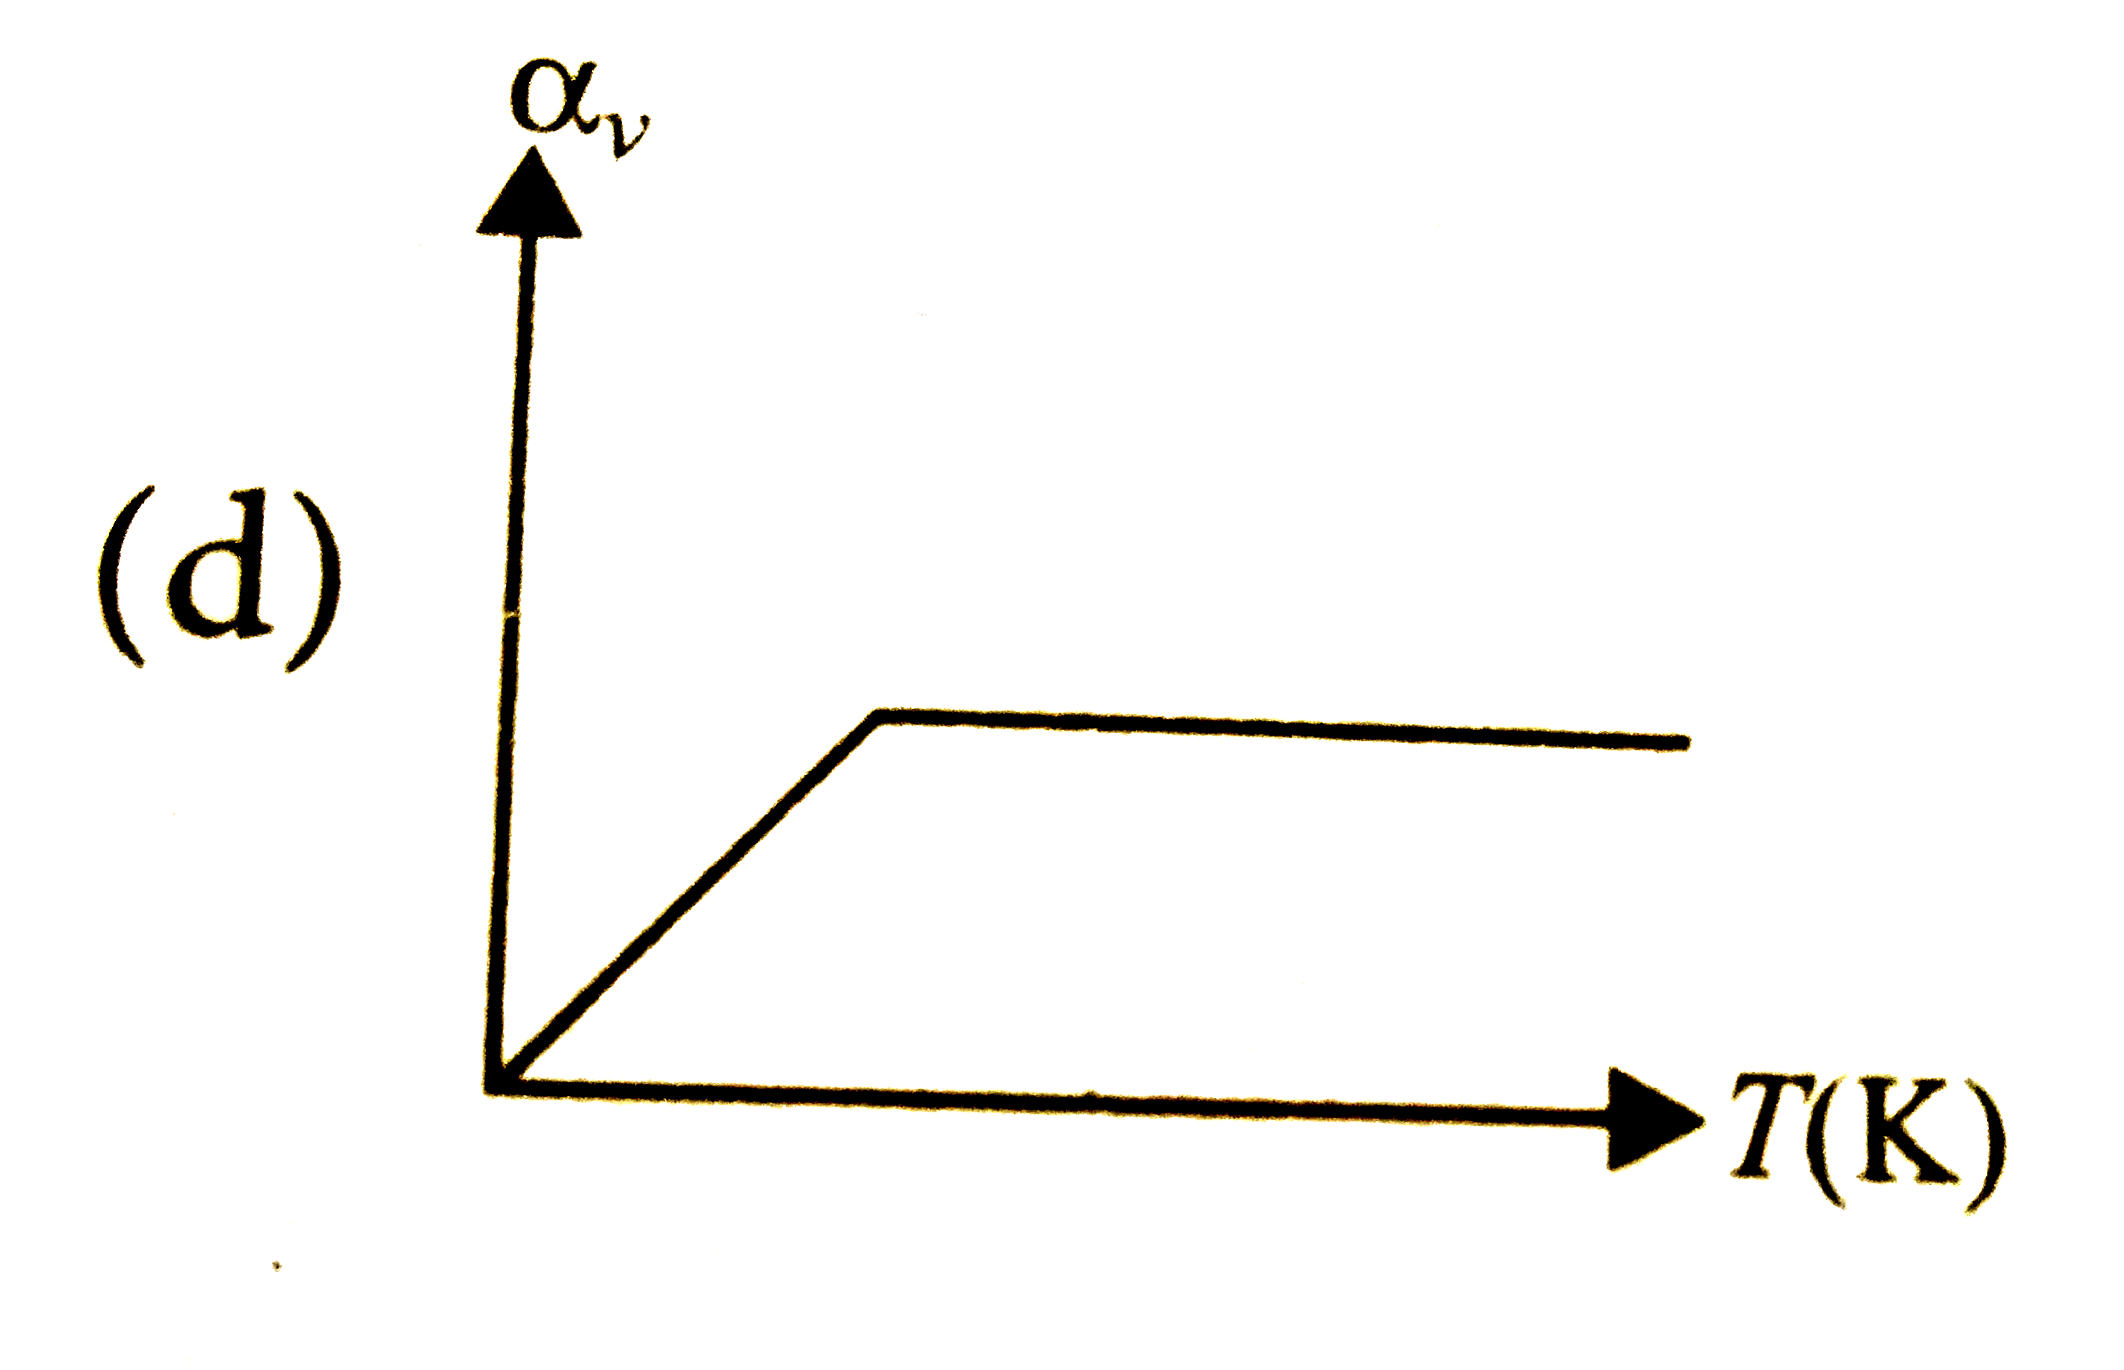
- Question 2 - Select One
Which one of the following statements is true in the case of radiation emitted by a human body ?
AIt is emitted only during the dayBIt lies in the infrared regionCIt lies in the ultraviolet region and hence it is invisibleDIt is emitted during the summer and absorbed during the winter - Question 3 - Select One
Which of the following graphs show the v−t graph of a ball thrown upwards ?
A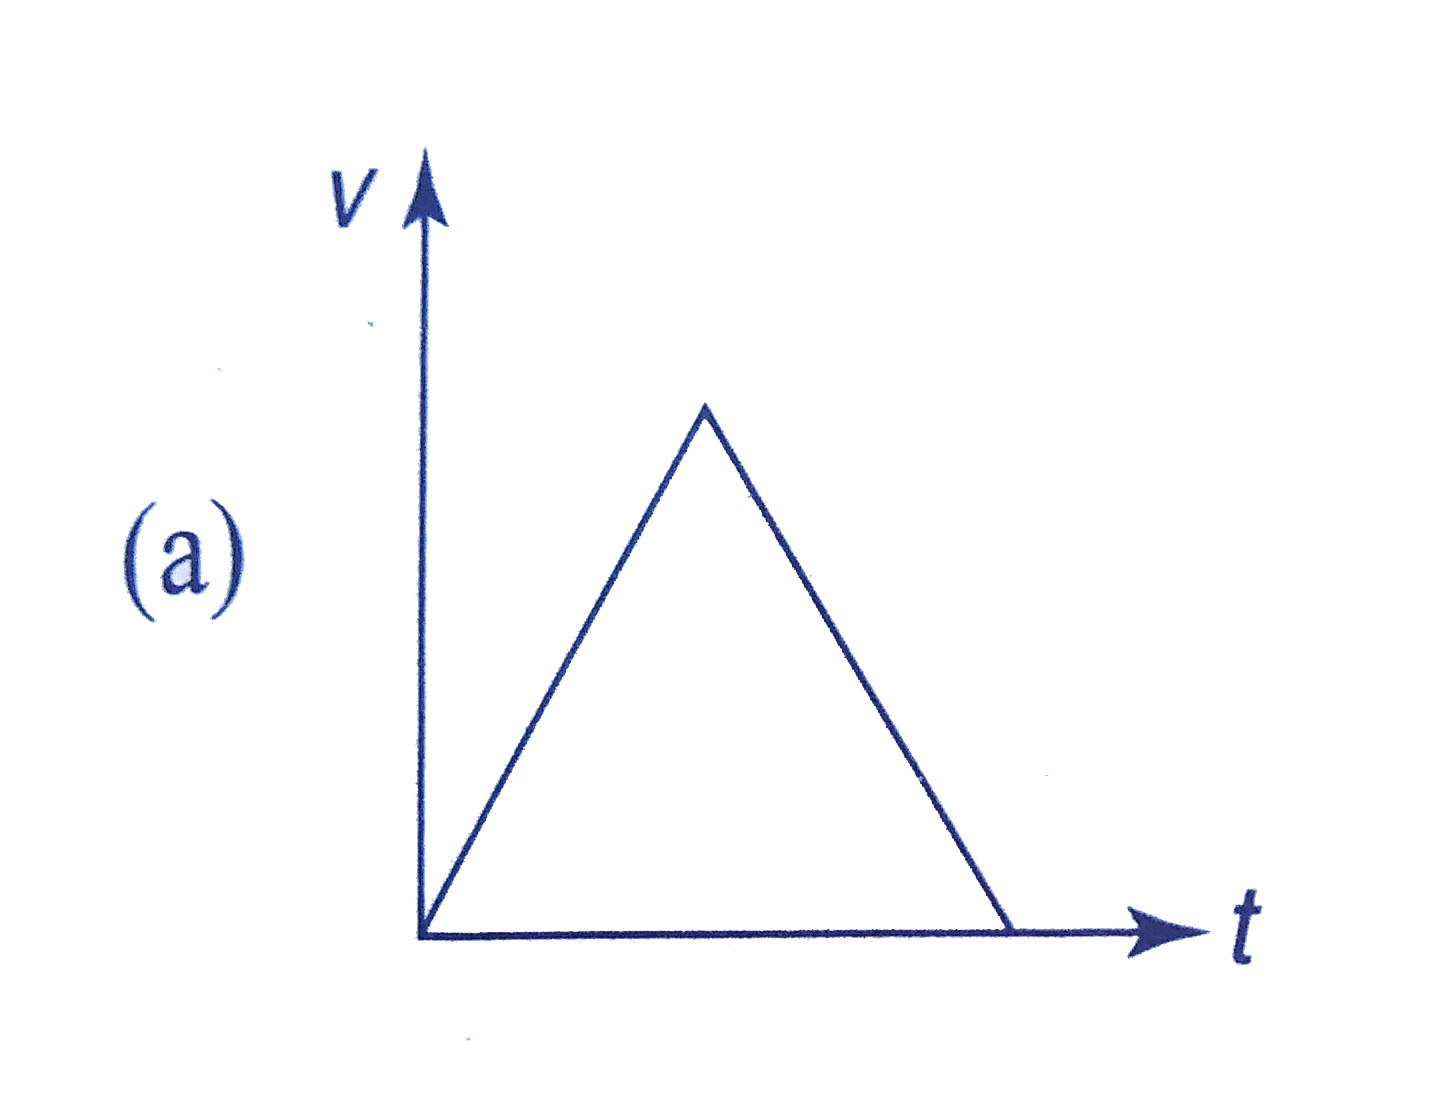 .B
.B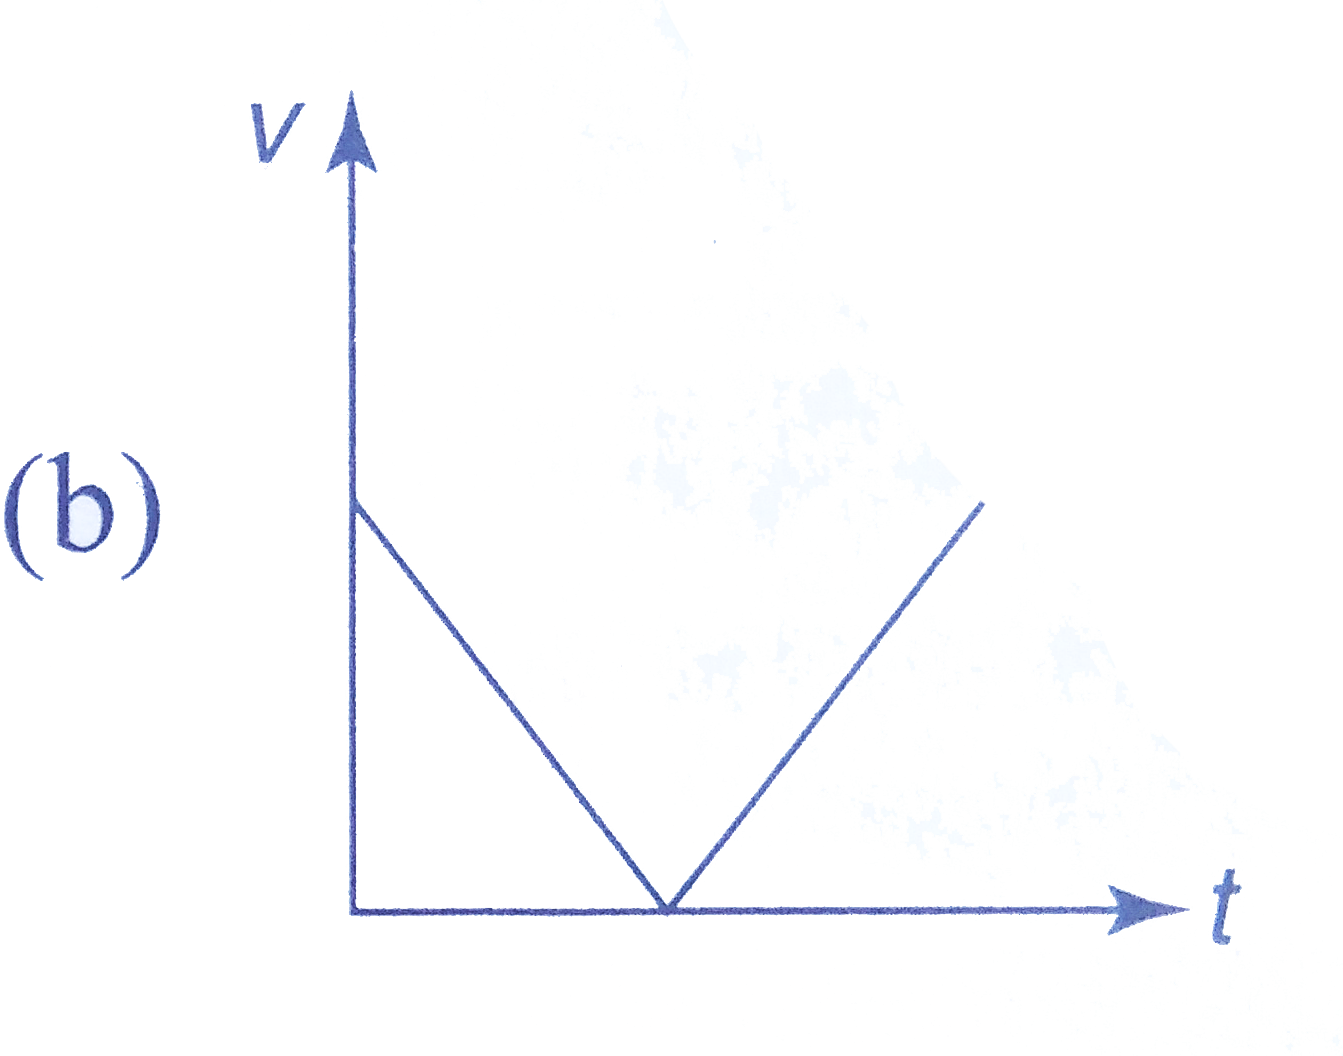 .C
.C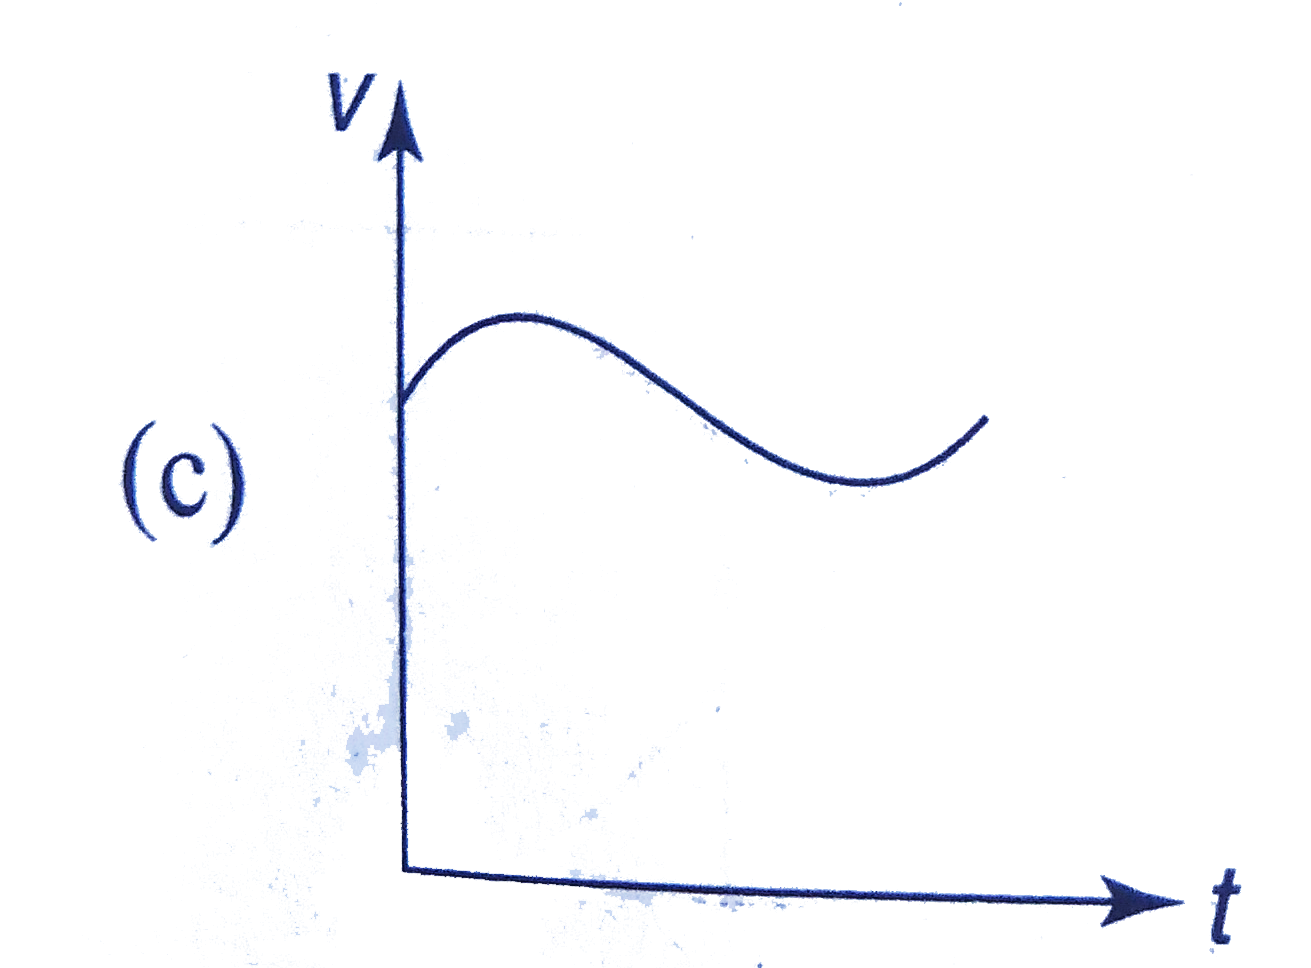 .D
.D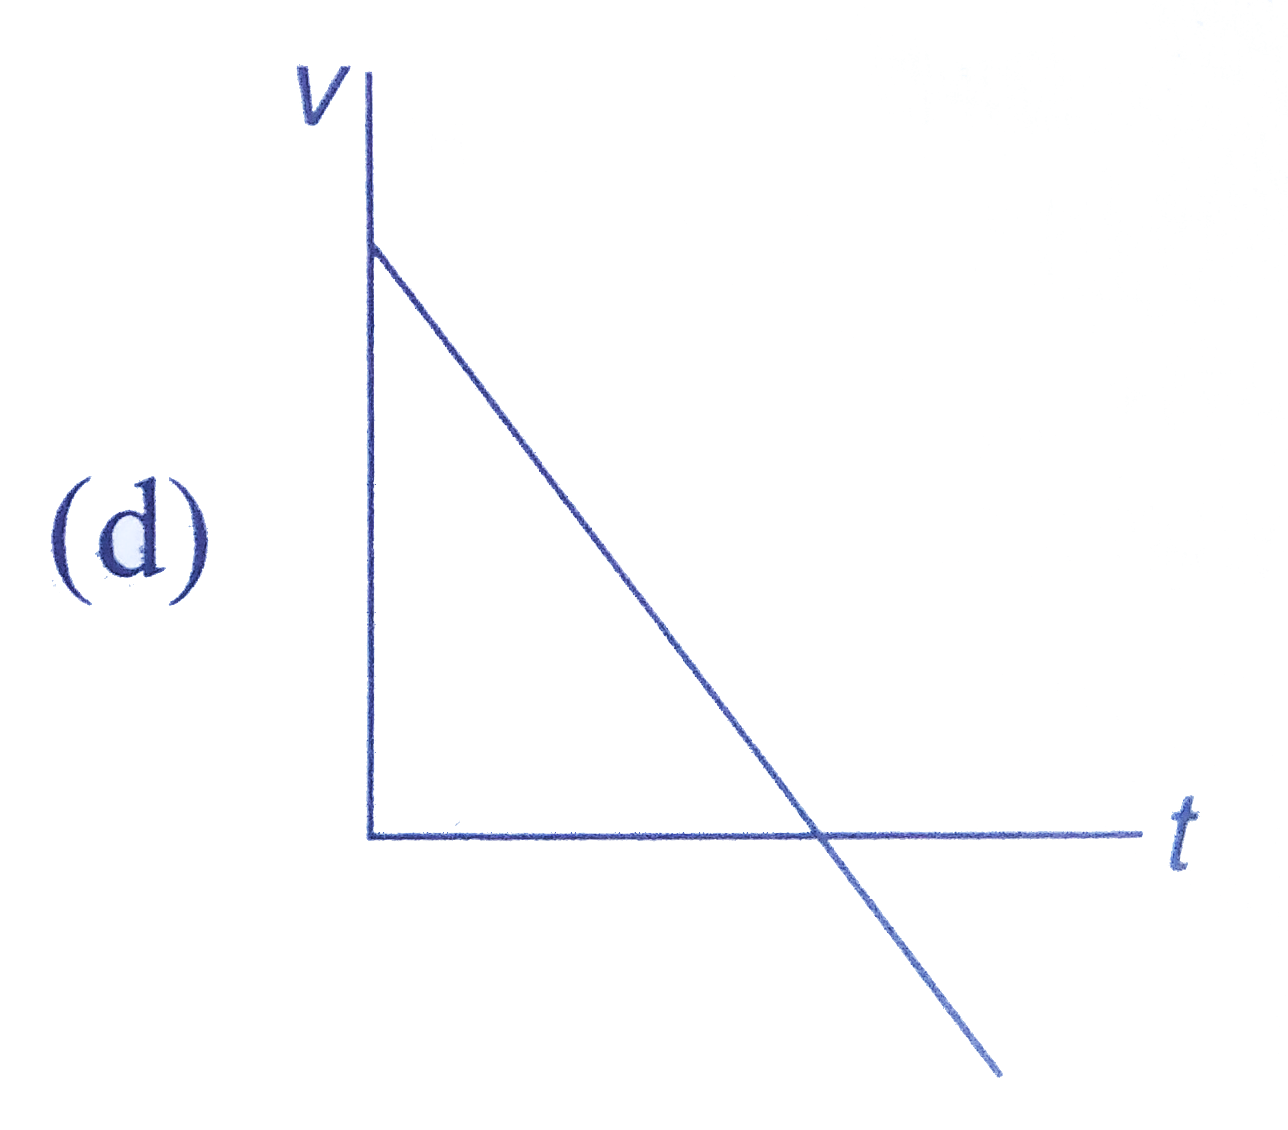 .
.
Which of the following velocity-time graphs shows a realistic situation for a body in motion ?
View SolutionWhich of the following velocity-time graphs shows a realistic situation for a body in motion ?
View SolutionWhich of the following graph shows the variationi of density of water increase in temperature ?
View SolutionWhich one of the following graphs show the relationship between the rate of an enzymatic activity and substrate conc(S) -
View SolutionWhich of the following graphs shows the relationship between the rate of an enzymatic activity and substrate concentration (S) ?
View Solution

