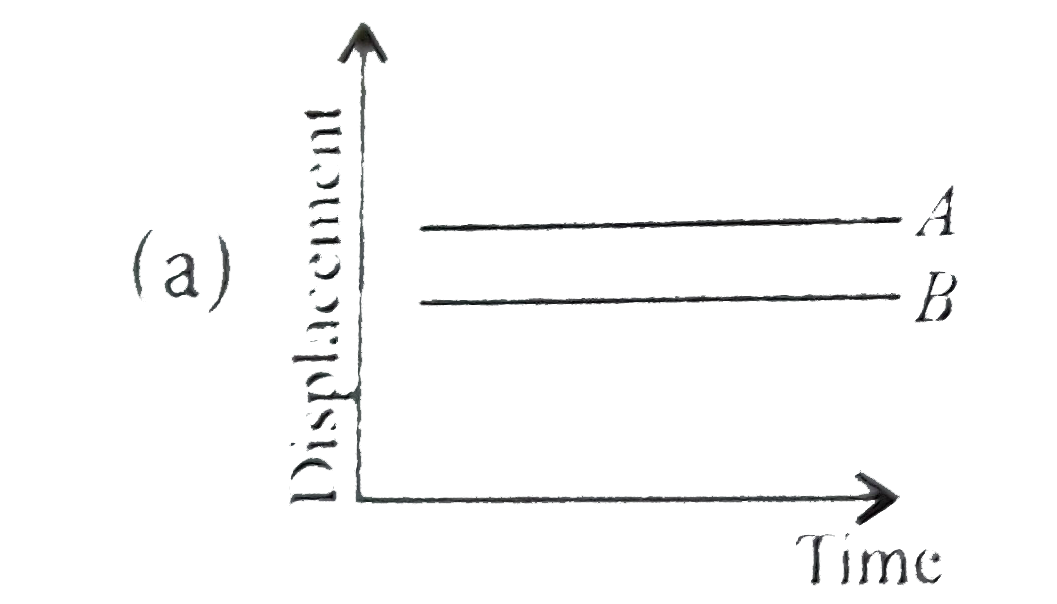
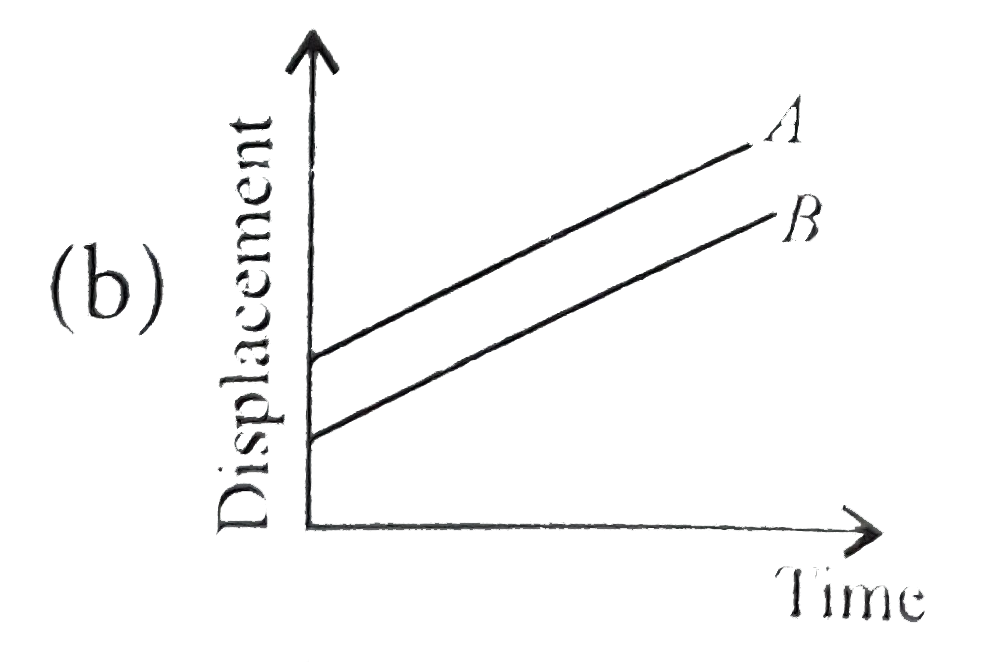
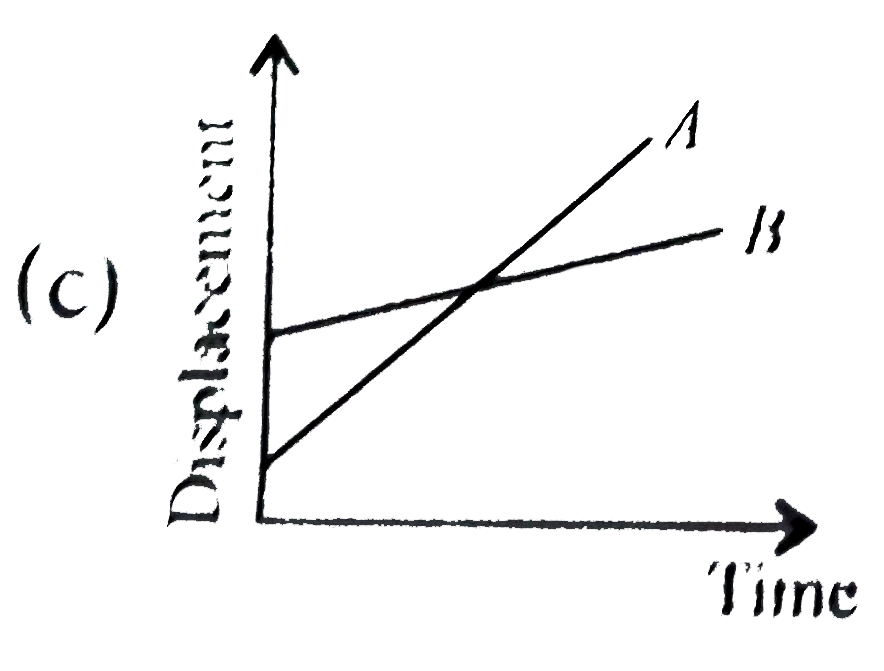
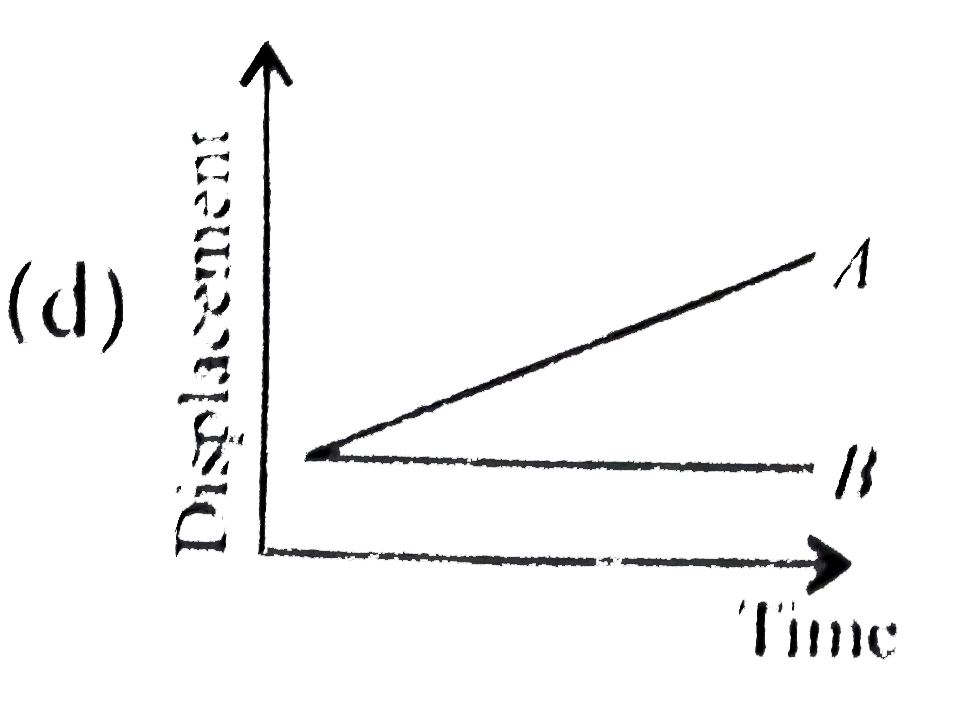
Which one of the following represents displacement-time graph of two objects A and B moving with zero relative velocity?
The correct Answer is:B
To determine which displacement-time graph represents two objects A and B moving with zero relative velocity, we need to analyze the characteristics of displacement-time graphs.
1. Understanding Relative Velocity:
- Relative velocity between two objects is defined as the difference in their velocities. If two objects have the same velocity, their relative velocity is zero.
2. Analyzing Displacement-Time Graphs:
- The slope of a displacement-time graph represents the velocity of the object. If two objects have the same slope, they are moving with the same velocity.
3. Evaluating the Options:
- Graph A: If both objects A and B have zero velocity, their displacement-time graphs would be horizontal lines at different positions (constant displacement). This means they have the same relative velocity of zero.
- Graph B: If both objects have the same slope (same angle), they are moving with the same velocity. Therefore, their relative velocity is also zero.
- Graph C: If the slopes of the displacement-time graphs are different, this indicates that the objects are moving with different velocities, leading to a non-zero relative velocity.
4. Conclusion:
- Based on the analysis, both Graph A and Graph B can represent two objects moving with zero relative velocity. However, Graph B is more representative as it shows both objects moving with the same velocity (same slope), confirming zero relative velocity.
Final Answer:
The correct answer is Graph B.
---
- Relative velocity between two objects is defined as the difference in their velocities. If two objects have the same velocity, their relative velocity is zero.
- The slope of a displacement-time graph represents the velocity of the object. If two objects have the same slope, they are moving with the same velocity.
- Graph A: If both objects A and B have zero velocity, their displacement-time graphs would be horizontal lines at different positions (constant displacement). This means they have the same relative velocity of zero.
- Graph B: If both objects have the same slope (same angle), they are moving with the same velocity. Therefore, their relative velocity is also zero.
- Graph C: If the slopes of the displacement-time graphs are different, this indicates that the objects are moving with different velocities, leading to a non-zero relative velocity.
- Based on the analysis, both Graph A and Graph B can represent two objects moving with zero relative velocity. However, Graph B is more representative as it shows both objects moving with the same velocity (same slope), confirming zero relative velocity.
The correct answer is Graph B.
Topper's Solved these Questions
- MOTION IN A STRAIGHT LINEBOOK - NCERT FINGERTPS ENGLISHCHAPTER - MOTION IN A STRAIGHT LINEEXERCISE - HOTS
10 Videos
- MOTION IN A STRAIGHT LINEBOOK - NCERT FINGERTPS ENGLISHCHAPTER - MOTION IN A STRAIGHT LINEEXERCISE - NCERT EXEMPLAR PROBLEMS
6 Videos
- MOTION IN A STRAIGHT LINEBOOK - NCERT FINGERTPS ENGLISHCHAPTER - MOTION IN A STRAIGHT LINEEXERCISE - KINEMATIC EQUATIONS FOR UNIFORMLY ACCELERATED MOTION
32 Videos
- MOTION IN A PLANE BOOK - NCERT FINGERTPS ENGLISHCHAPTER - MOTION IN A PLANE EXERCISE - Assertion And Reason
15 Videos
- OSCILLATIONS BOOK - NCERT FINGERTPS ENGLISHCHAPTER - OSCILLATIONS EXERCISE - Assertion And Reason
15 Videos
Similar Questions
Knowledge Check
Which of the following graphs represents the position time-graph of a particle moving with negative velocity?
A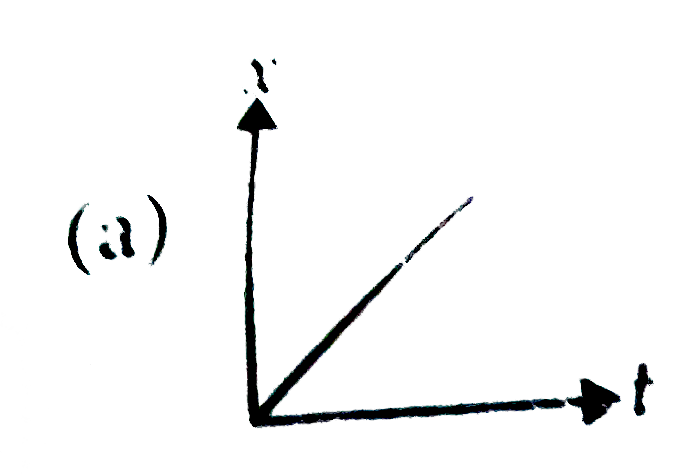 B
B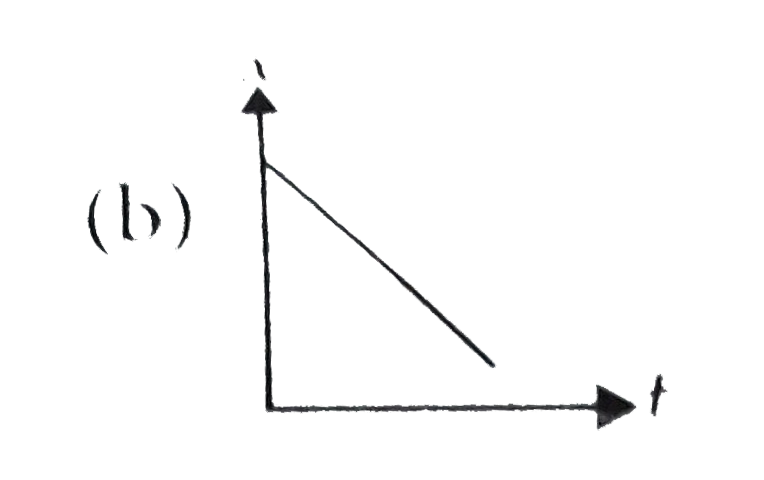 C
C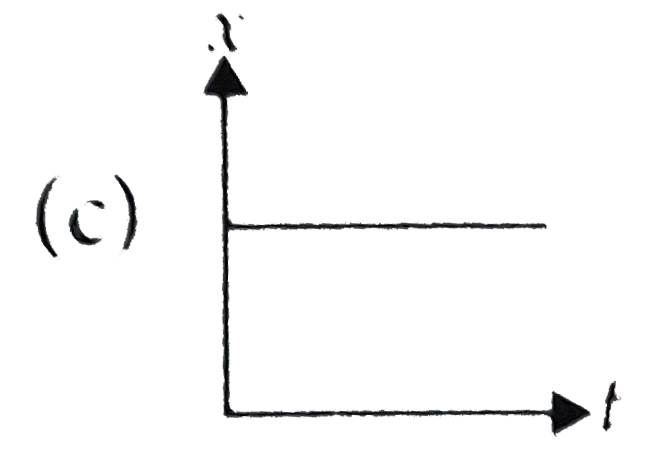 D
D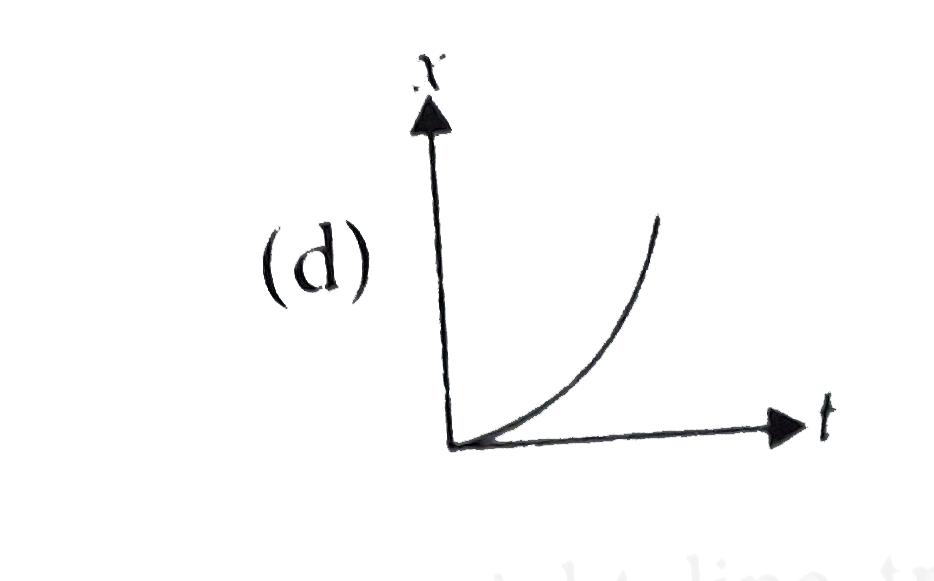
Which of the following displacement-time graphs represent damped harmonic oscillation?
A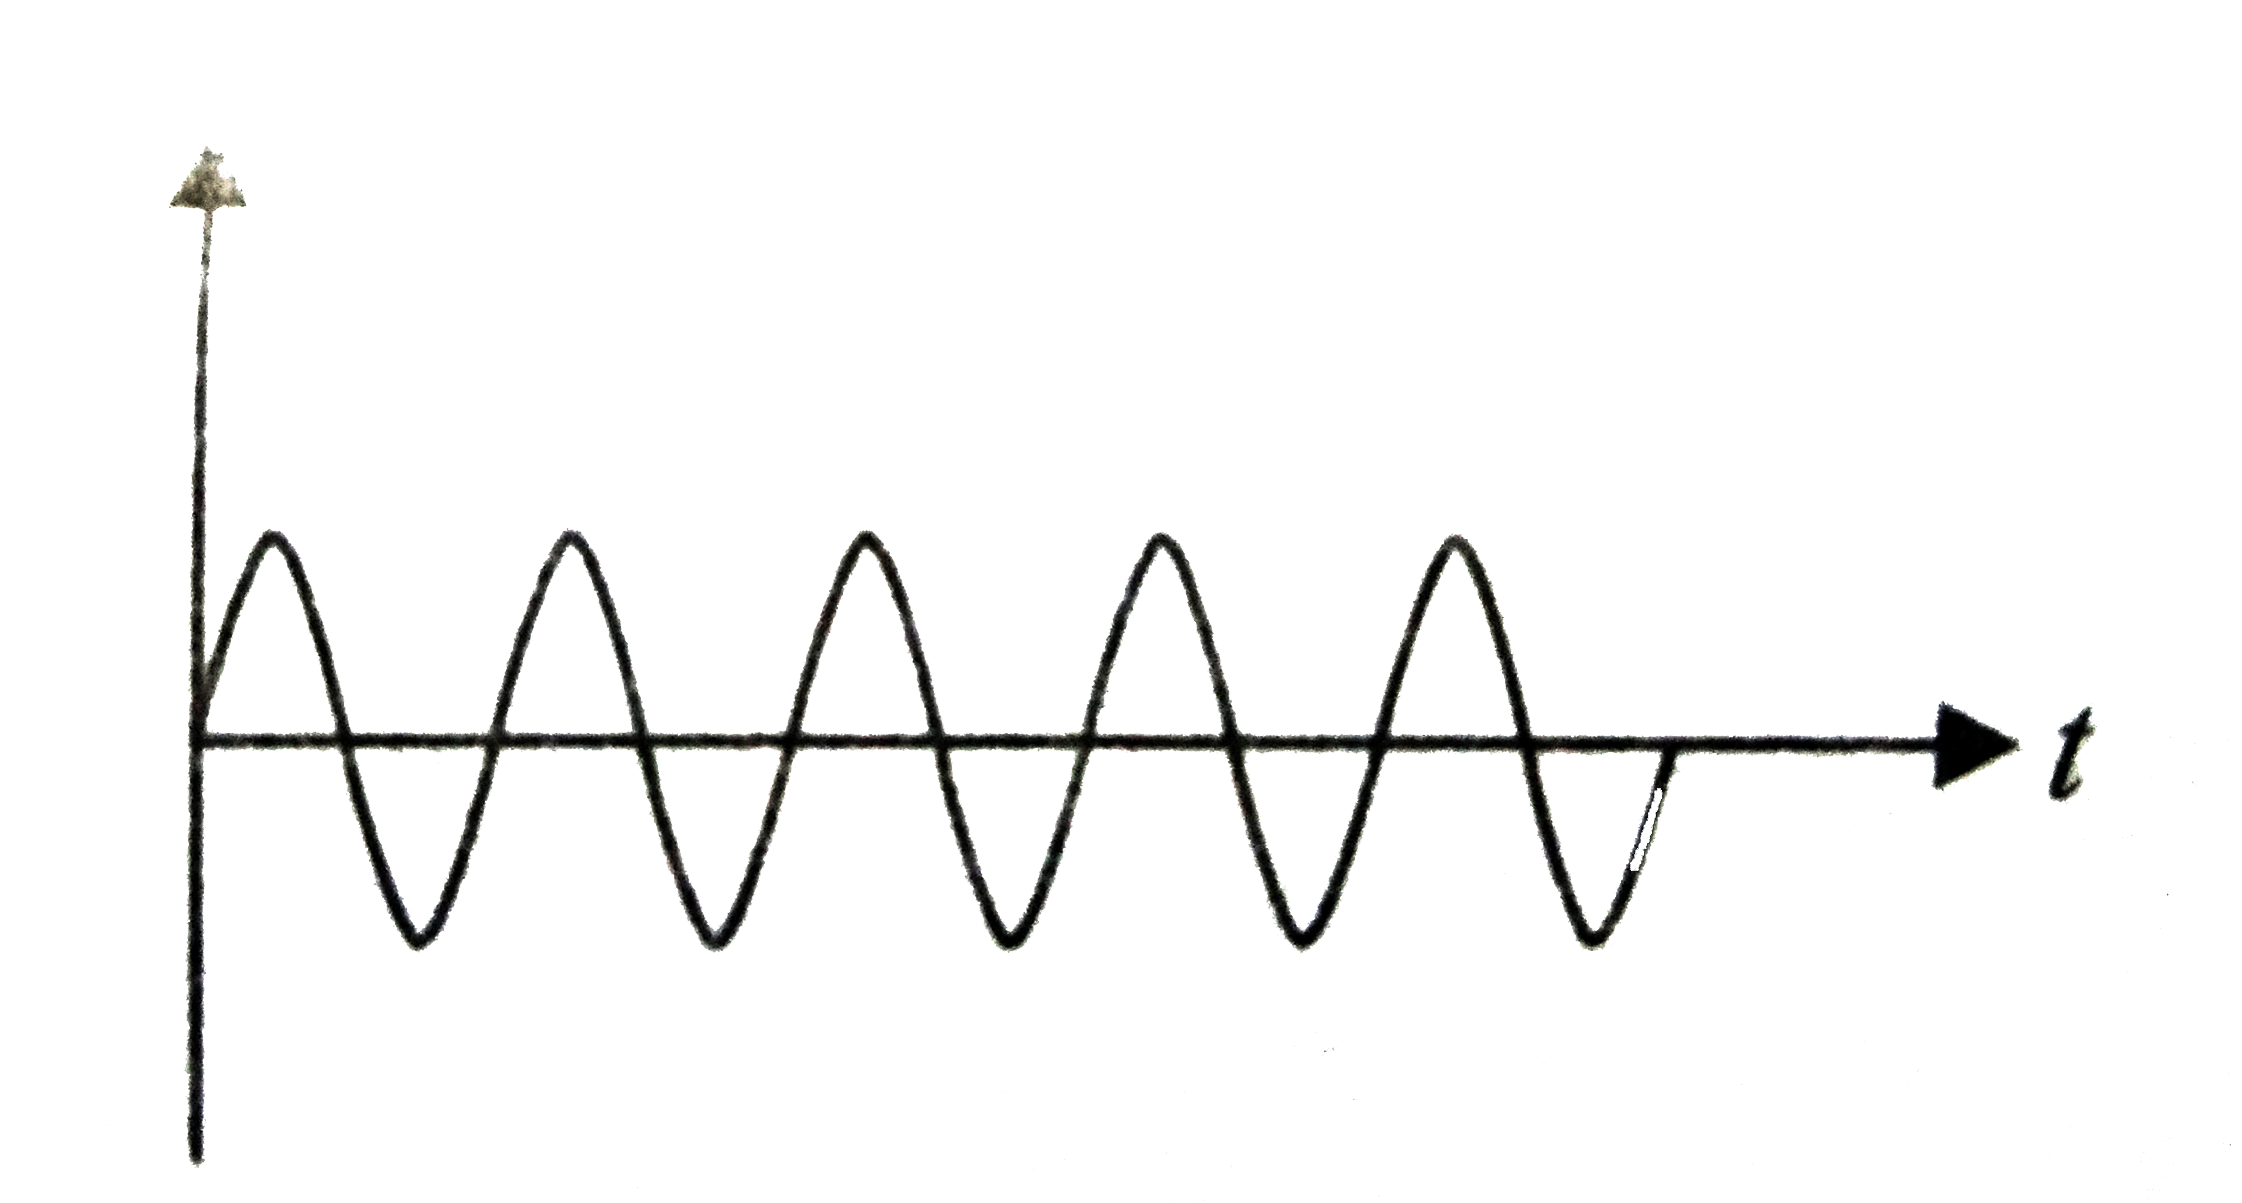 B
B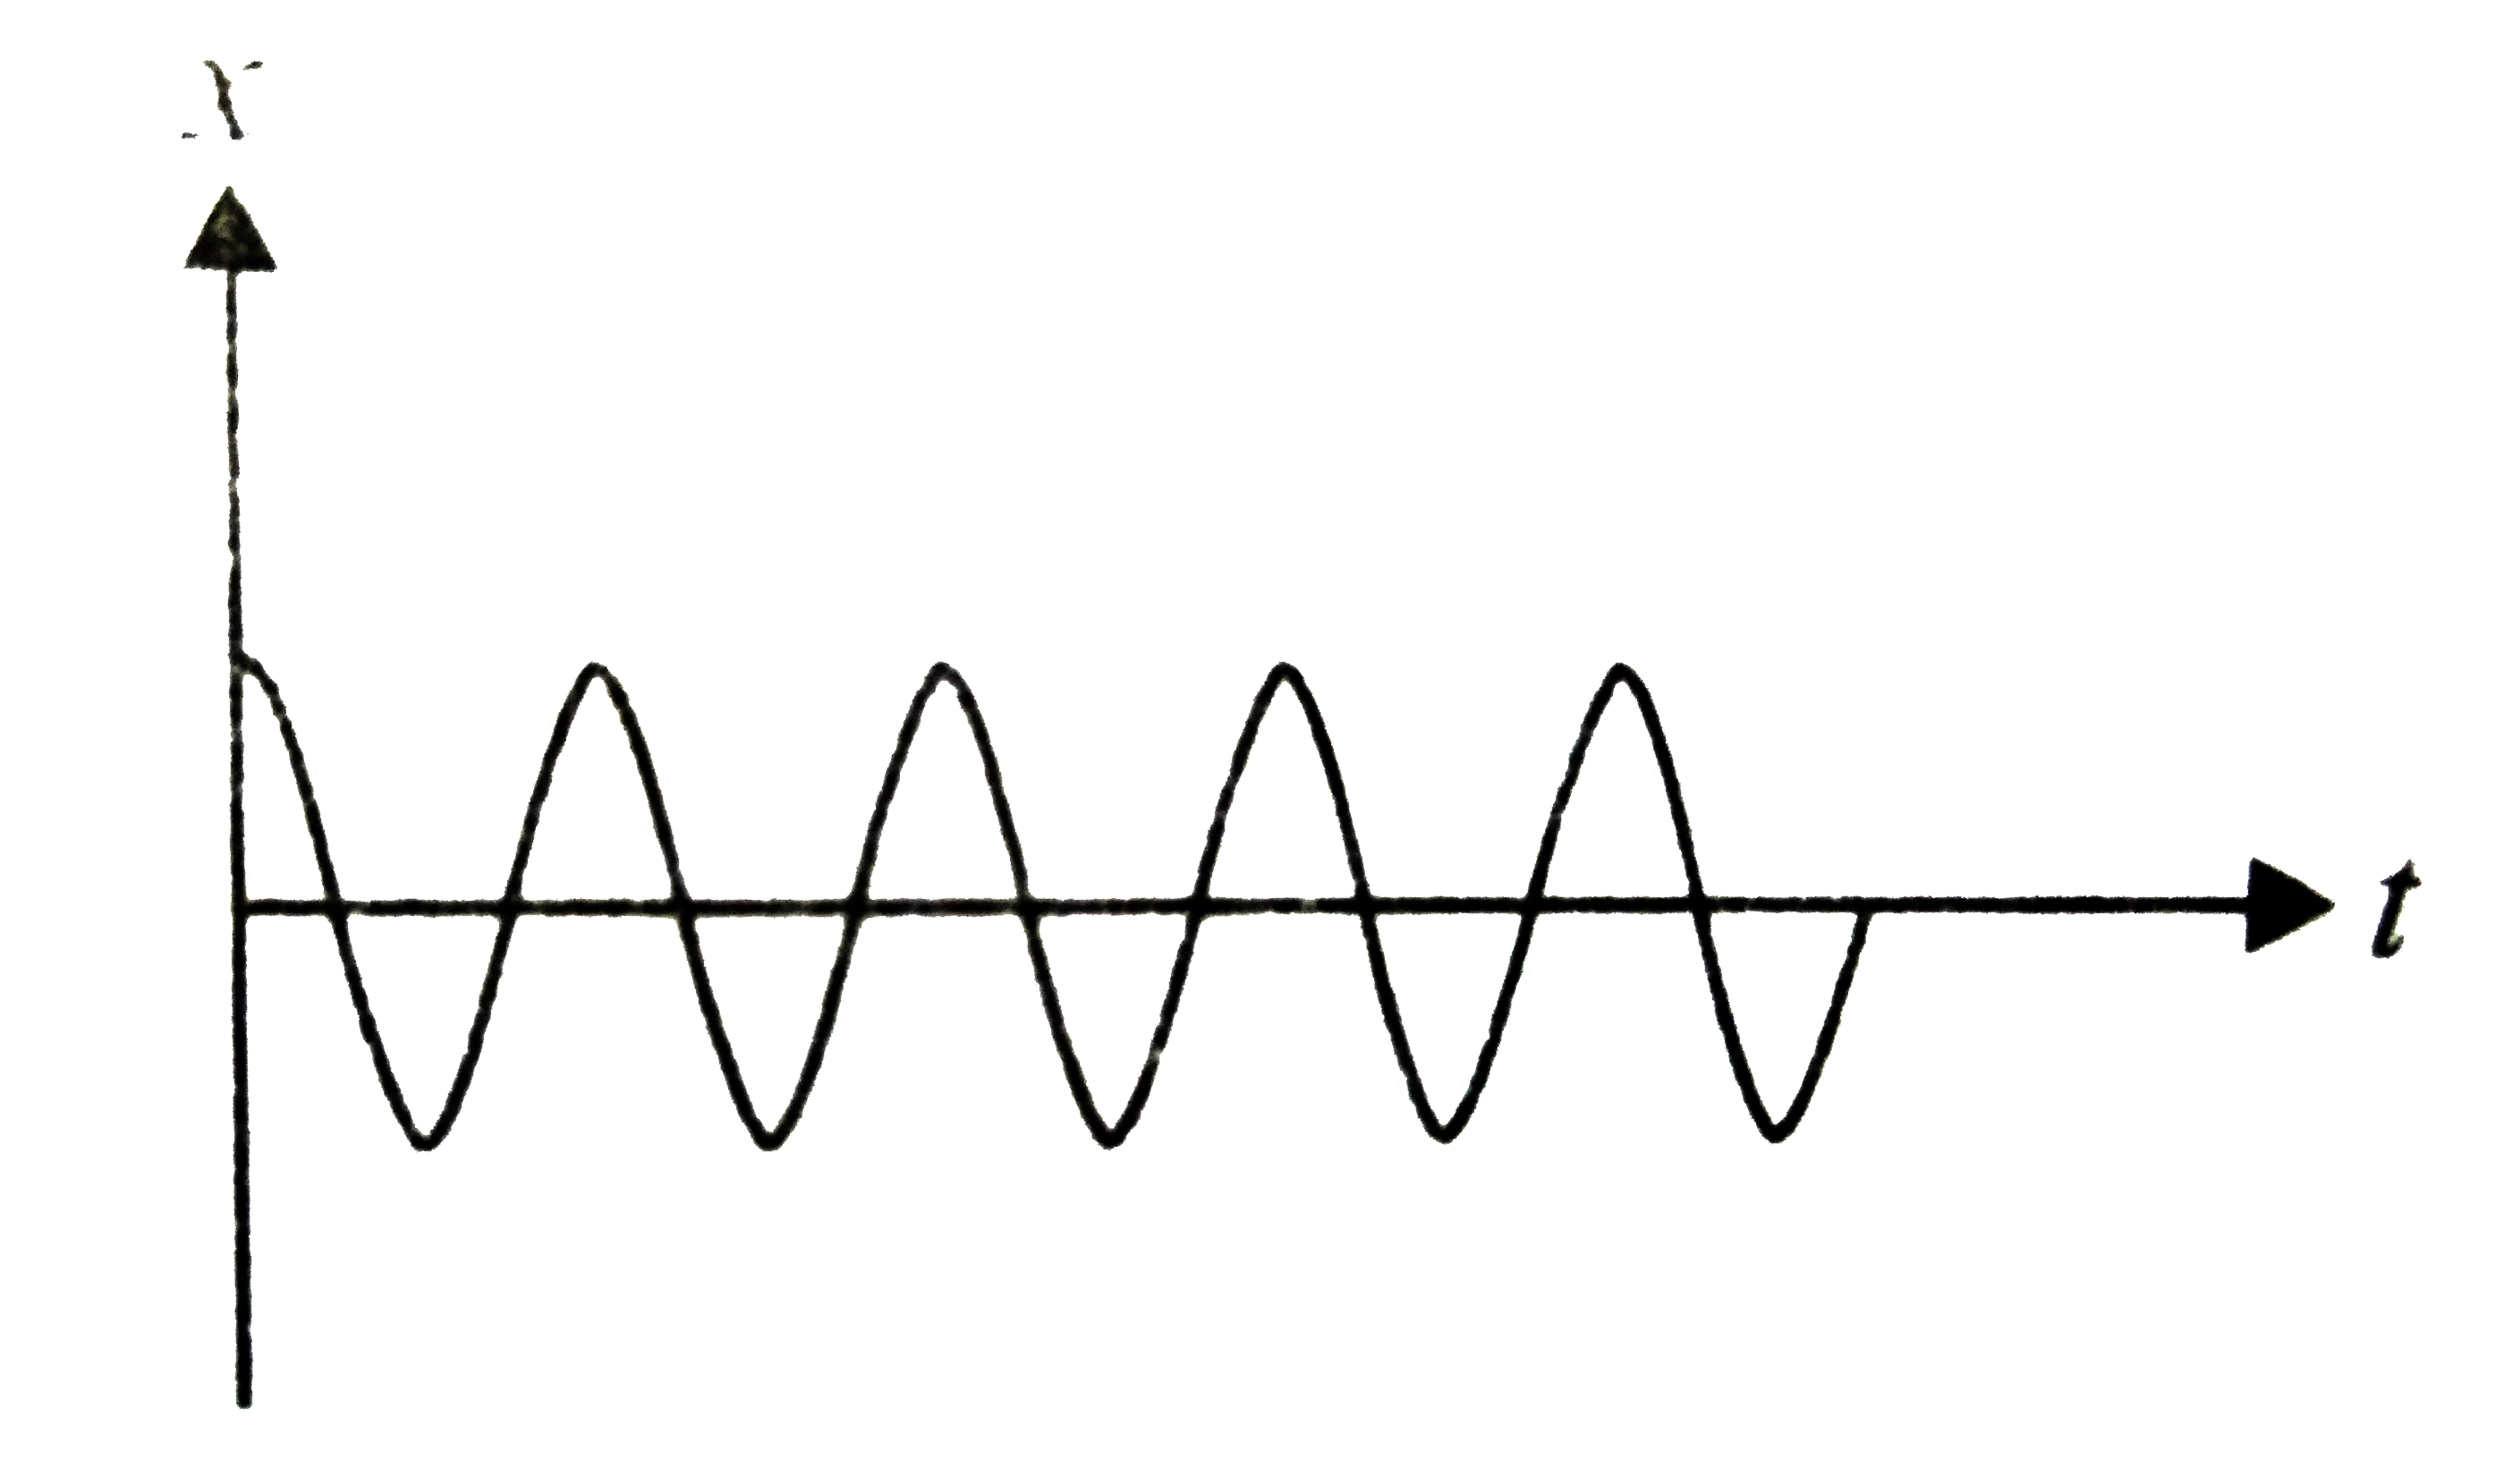 C
C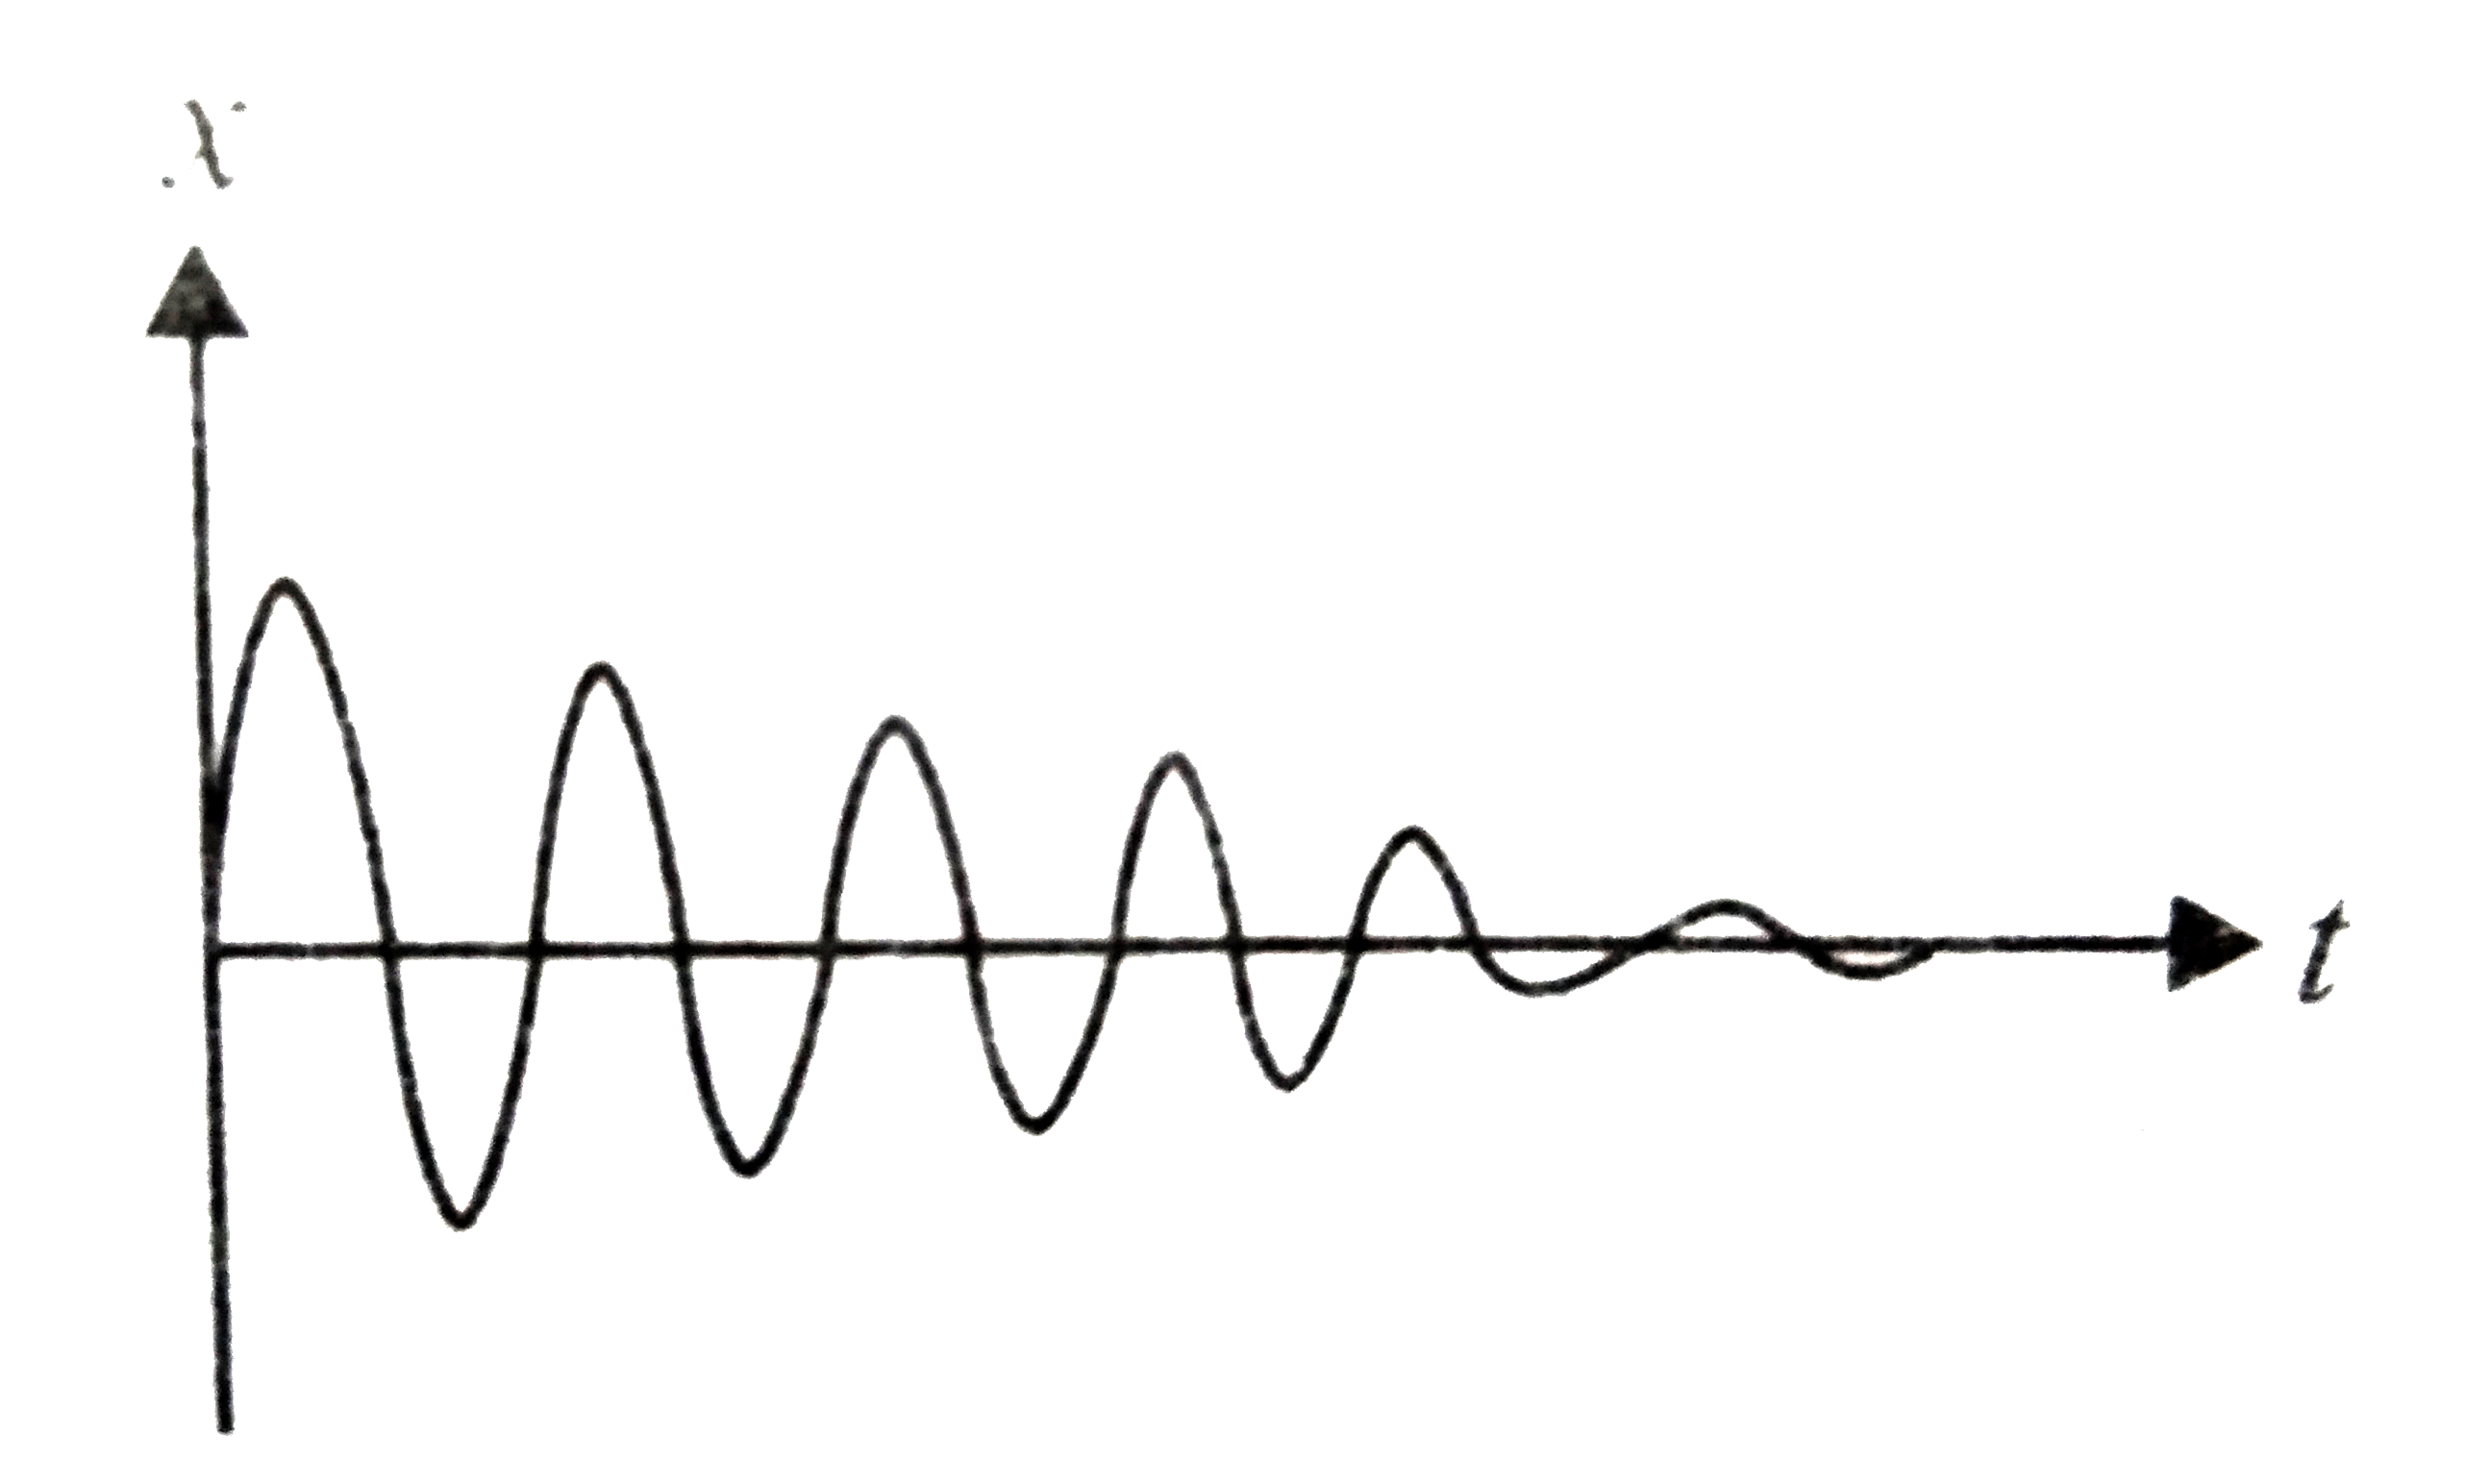 D
D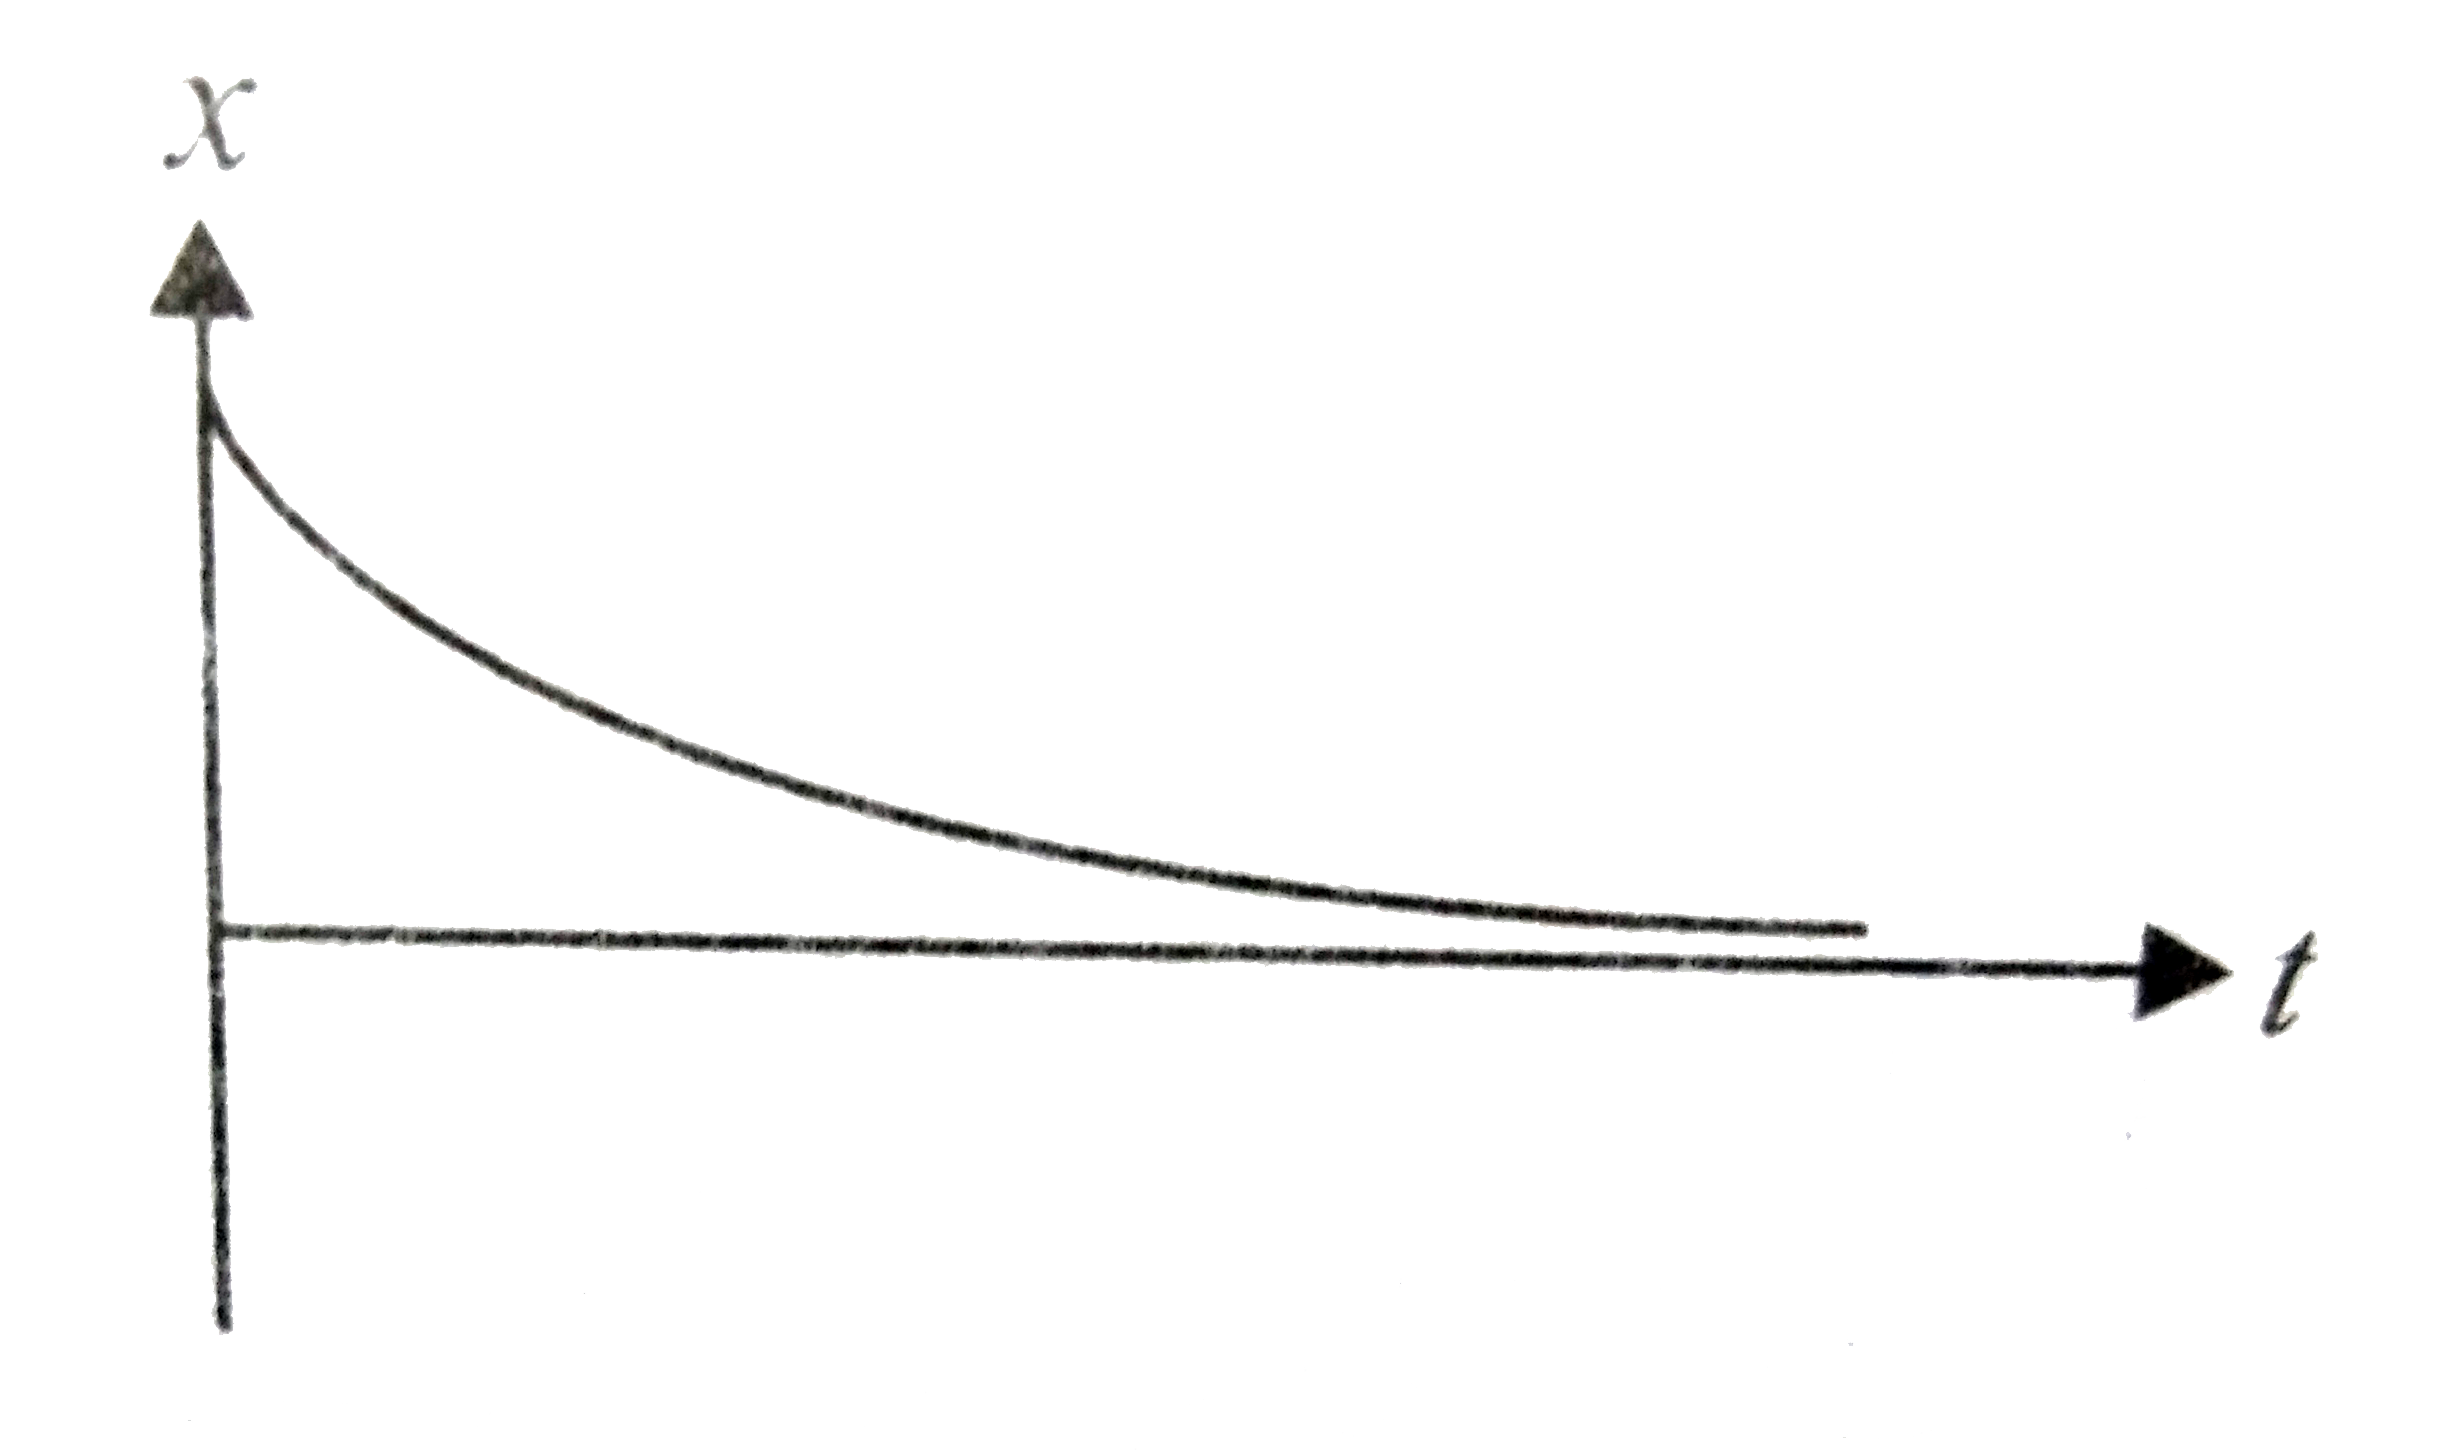
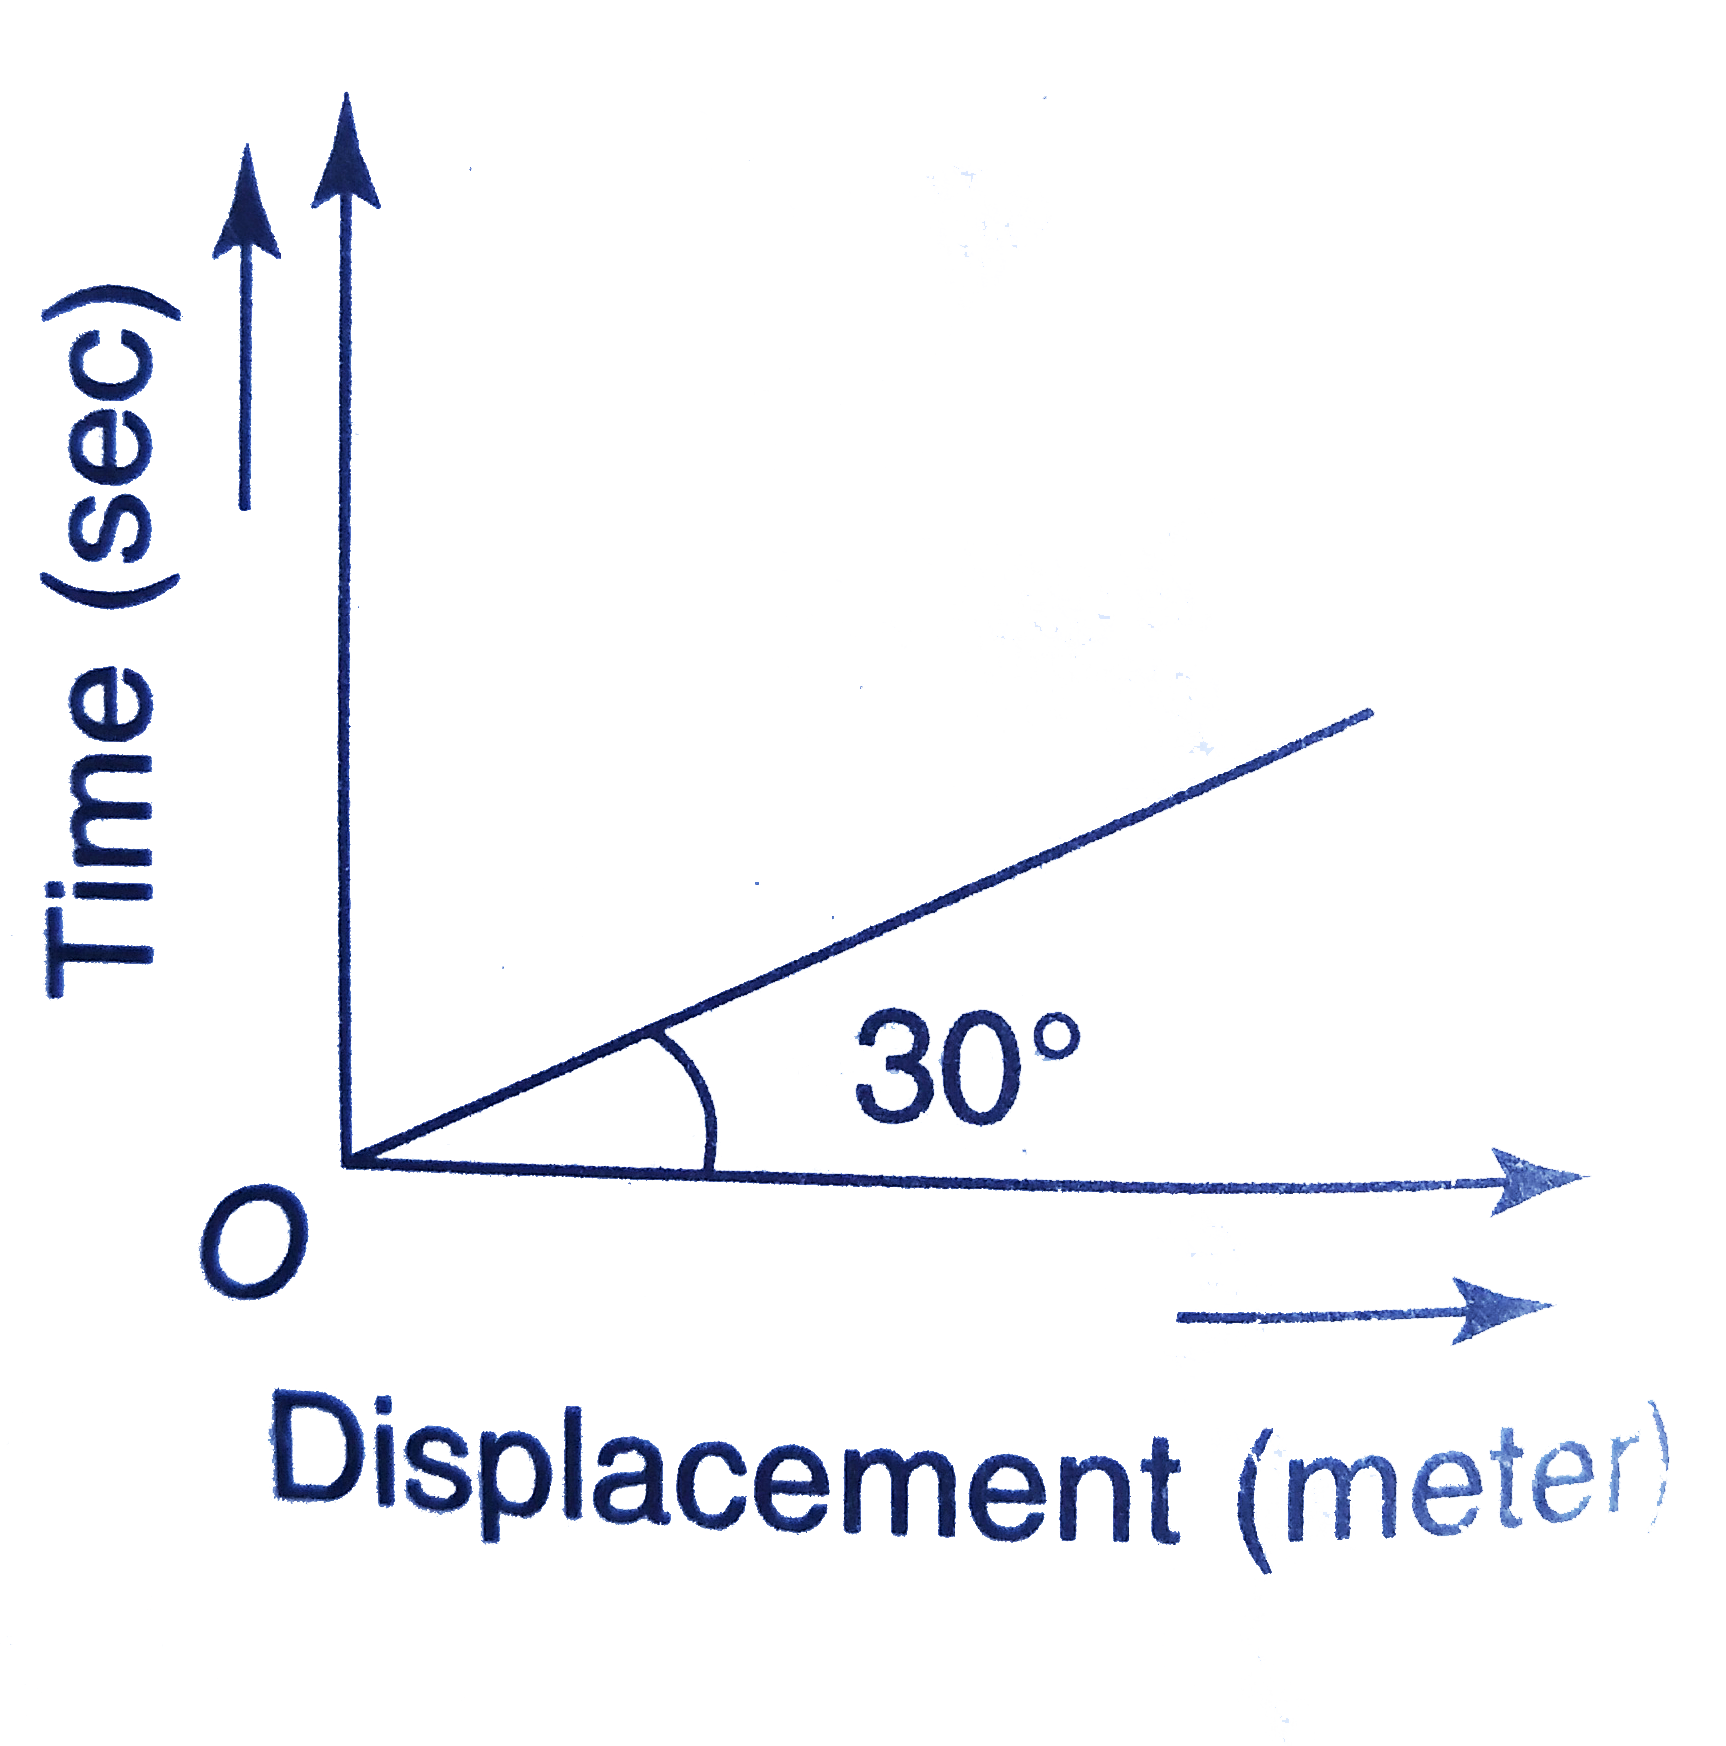
From the following displacement-time graph find out the velocity of a moving body.
View SolutionFigure shows two displacement-time graphs of particles P1 and P2
Their relative velocity is

View SolutionWhat does the slope of a displacement-time graph represent?
View SolutionDraw the position-time graph of a moving object, moving with zero acceleration.
View SolutionWhich of the following velocity-time graphs represent uniform motion
View SolutionDraw the velocity-time graph of an object moving with uniform negative acceleration.
View Solution
