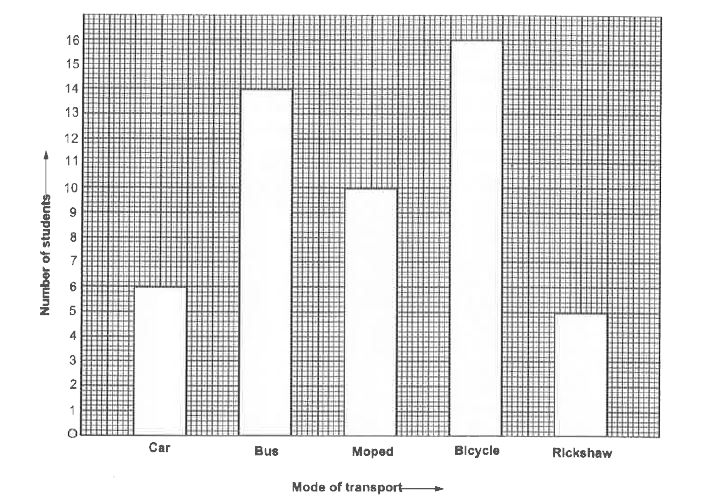
70 students from a locality use different modes of transport to go to school as given below:
 Draw the bar graph representing the above data.
The correct Answer is:(##MTGFOUCOUMATIXC14SLV003_A01##)
Topper's Solved these Questions
- STATISTICSBOOK - MTG IIT JEE FOUNDATIONCHAPTER - STATISTICSEXERCISE - SOLVED EXAMPLES
28 Videos
- STATISTICSBOOK - MTG IIT JEE FOUNDATIONCHAPTER - STATISTICSEXERCISE - NCERT SECTION (Exercise 14.1)
2 Videos
- QUADRILATERALS BOOK - MTG IIT JEE FOUNDATIONCHAPTER - QUADRILATERALS EXERCISE - Olympiad/HOTS CORNER
15 Videos
- TRIANGLESBOOK - MTG IIT JEE FOUNDATIONCHAPTER - TRIANGLESEXERCISE - OLYMPAID/ HOTS CORNER
10 Videos
Similar Questions
Hundred students from a certain locality use different modes of travelling to school as given below. Draw a bar graph.

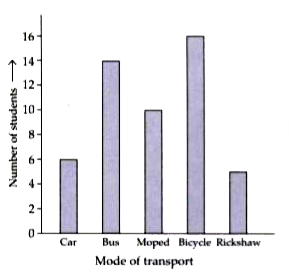
View Solution51 students from a locality use different modes of transport to school, as shown by the bar graph given below:

Look at the bar graph given above and answer the question given below:
What does the above bar graph show ?
Which mode of transport is used by maximum number of students ?
How many students use bus for going to school ?
How many students of the locality do not use bus for going to school ?
View Solution51 students from a locality use different modes of transport to go to school as shown by the bar graph given below.

Assertion : Bicycle is used by maximum number of students.
Reason : Height of bar corresponding to bicycle is maximum. So, most students use bicycle to go to school.
View SolutionStudents of a small school use different modes of travel to school as shown below:

Draw a suitable bar graph
View SolutionThe runs scored by a cricket team in first 10 overs are given below:

Draw a line graph representing the above data.
View SolutionGiven below is the data of school going students (boys and girls):

Draw the bar graph to represent the above data.
View SolutionGiven below is the data of school going students (boys and girls):

Draw the bar graph to represent the above data.
View SolutionThe expenditure of a family of different heads in a month is given below

Draw a bar graph to represent the data above.
View SolutionThe expenditure of a family of different heads in a month is given below

Draw a bar graph to represent the data above.
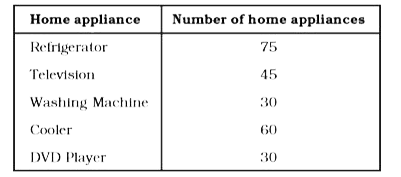
View SolutionHome appliances sold by a shop in one month are given as below:

Draw a bar graph to represent the above information.
View Solution
