(A graph on “performance”)The given graph (Fig 15.7) represents the total runs scored by two batsmen A and B, during each of the ten different matches in the year 2007. Study the graph and answer the following questions.(i) What information is given on the two axes?(ii) Which line shows the runs scored by batsman A?(iii) Were the run scored by them same in any match in 2007? If so, in which match?(iv) Among the two batsmen, who is steadier? How do you judge it?
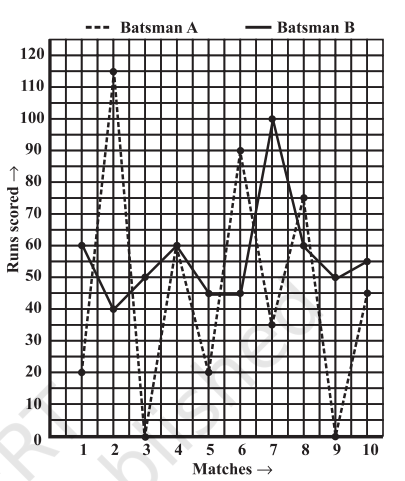
1)X-axis=Number of matches
Y-axis=Runs scored
2)dotted lines
3)Match 4 scored 60 runs.
4)it can be judge from average of both the batsman.
Topper's Solved these Questions
- INTRODUCTION TO GRAPHSBook:NCERT ENGLISHChapter:INTRODUCTION TO GRAPHSExercise:EXERCISE 15.2
Explore 4 Videos
- INTRODUCTION TO GRAPHSBook:NCERT ENGLISHChapter:INTRODUCTION TO GRAPHSExercise:EXERCISE 15.3
Explore 2 Videos
- FACTORISATIONBook:NCERT ENGLISHChapter:FACTORISATIONExercise:EXERCISE 14.1
Explore 3 Videos
- LINEAR EQUATIONS IN ONE VARIABLEBook:NCERT ENGLISHChapter:LINEAR EQUATIONS IN ONE VARIABLEExercise:EXERCISE 2.3
Explore 9 Videos
Similar Questions
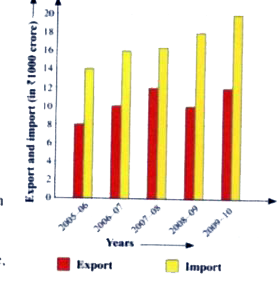
Read the bar graph and answer the following questions.
What information is given by the bar graph?
View SolutionObserve the bar graph given below :
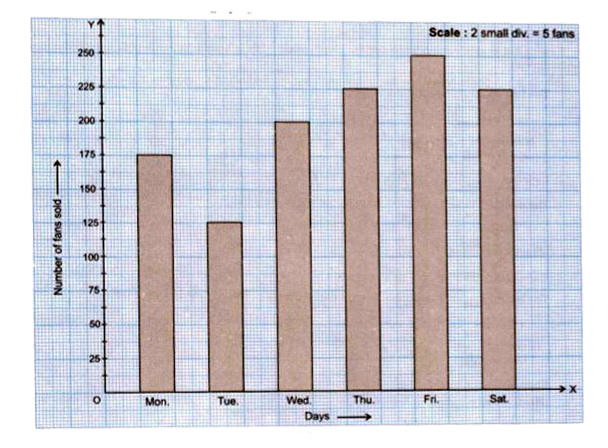
Read the bar graph carefully and answer the following questions :
What information is given by the bar graph?
View SolutionGiven below is a bar graph showing the heights of six mountain peaks.
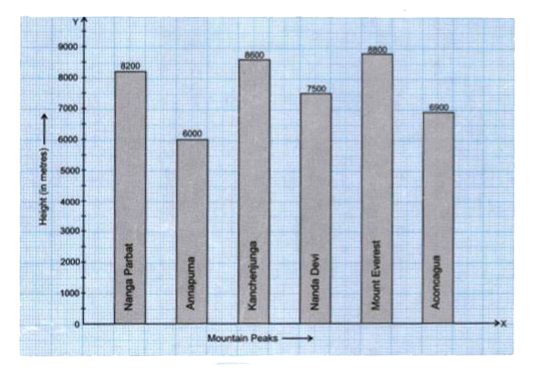
Read the above bar diagram and answer the following questions :
what is information given in the graph
View SolutionRead the given bar graph and answer the question that follow :
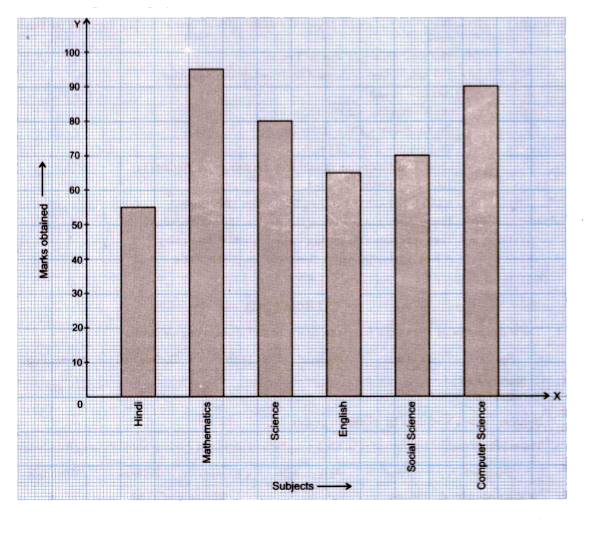
What information is represented by the bar graph?
View SolutionObserve the bar graph given below :
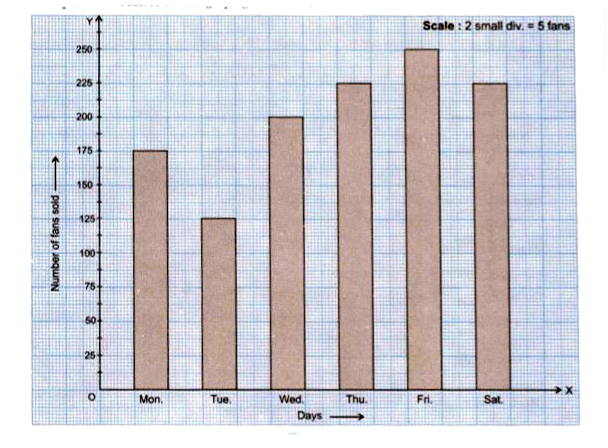
Read the bar graph carefully and answer the following questions :
What was the total sale during the week?
View SolutionRead the bar graph given below :
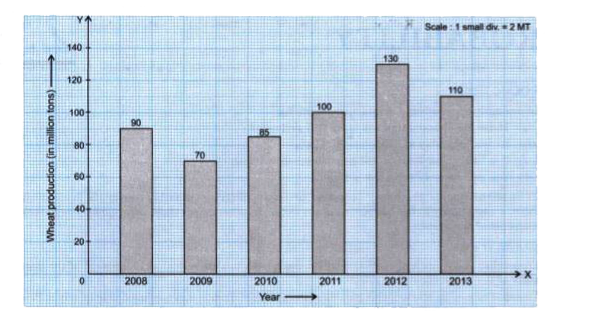
What information is given by the bar graph?
View SolutionThe given graph represents the age and number of members of a hiking group who are planning an excursion. Study the graph and answer the following question.
Which age group has the least members in the hiking group?
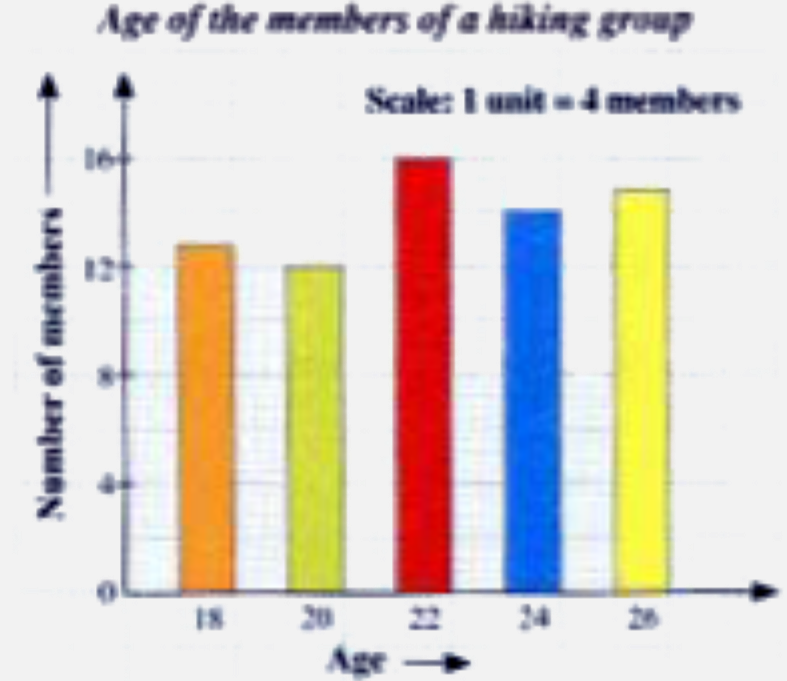
View SolutionThe given graph represents the age and number of members of a hiking group who are planning an excursion. Study the graph and answer the following question.
Which age group has the maximum members in the hiking gruoup?

View SolutionRead the bar graph given in Figure and answer the following questions: What information is given by the bar graph? What was the crop-production of rice in 1970-71? What is the difference between the maximum and minimum production of rice?
View SolutionThe given distribution shows the number of runs scored by some top batsmen of the world in one-day international cricket matches.Find the mode of the data.
View Solution