A survey conducted on 20 households in a locality by a group of students resulted in the following frequency table for the number of family members in a household:Find the mode of this data.
None
The correct Answer is:C
Maximum class frequency=8
corresponding to (3-5)
modal class=3-5
l=lower limit of modal class=3
=8, h=2
frequency of priceding class of modal class=8.
=frequency of succeding class of modal class=2
Mode=
=
=
=23/7
Topper's Solved these Questions
- STATISTICSBOOK - NCERT ENGLISHCHAPTER - STATISTICSEXERCISE - EXERCISE 14.4
3 Videos
- STATISTICSBOOK - NCERT ENGLISHCHAPTER - STATISTICSEXERCISE - Exercise 14.3
7 Videos
- SOME APPLICATIONS OF TRIGONOMETRYBOOK - NCERT ENGLISHCHAPTER - SOME APPLICATIONS OF TRIGONOMETRYEXERCISE - SOLVED EXAMPLES
7 Videos
- SURFACE AREAS AND VOLUMESBOOK - NCERT ENGLISHCHAPTER - SURFACE AREAS AND VOLUMESEXERCISE - Exercise 13.3
9 Videos
Similar Questions
Knowledge Check
To determine the mean number of children per household in a community, Tabitha surveyed 20 families at a playground. For the 20 families surveyed, the mean number of children per household was 2.4. Which of the following statements must be true?
AThe mean number of children per household in the community is 2.4.BA determination about the mean number of children per household in the community should not be made because the sample size is too smallCThe sampling method is flawed and may produce a biased estimate of the mean number of children per household in the community.DThe sampling method is not flawed and is likely to produce an unbiased estimate of the mean number of children per household in the community.
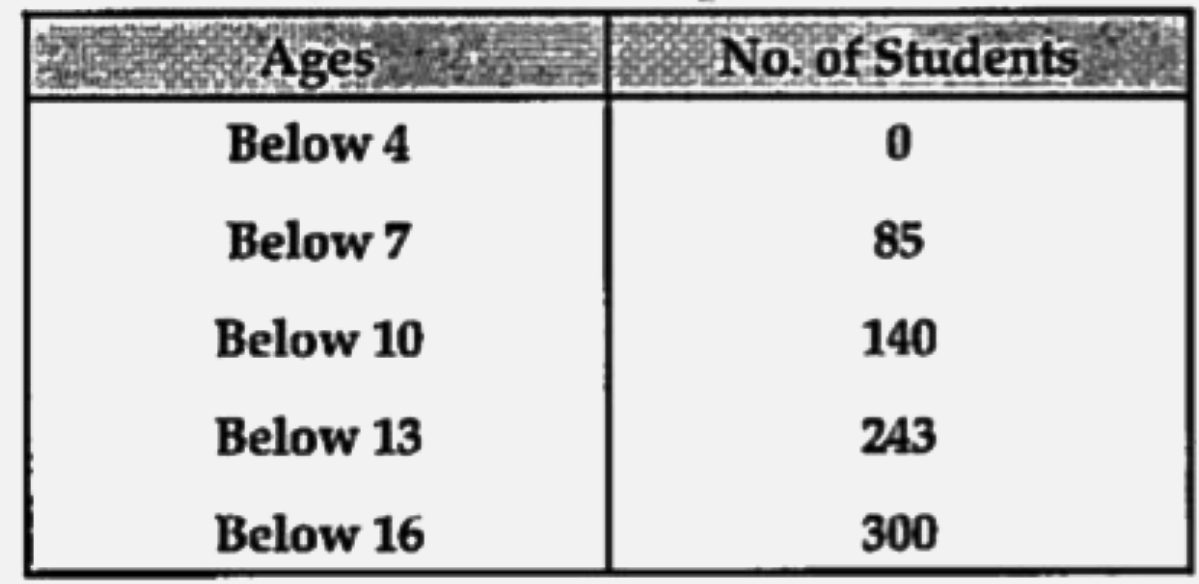
Construct the frequency distribution table from the following cumulative frequency table :

State the number of students in the age group 10 - 13.
View SolutionA survey was conducted by a group of students as a part of their environment awareness programme , in which they collected the following data regarding the number of plants in 20 houses in a locality. Find the mean number of plants per house. Number of plants: 0-2 2-4 4-6 6-8 8-10 10-12 12-14 Number of houses: 1 2 1 5 6 2 3 Which method did you use for finding the mean, and why?
View SolutionThe number of students absent in a class were recorded every day for 120 days and the information is given in the following frequency table. Then mean number of students absent per day is
No. of student absent01234567No. of days 141050341542
View SolutionA survey reagarding the heights ( in cm) of 50 girls of class X of a school was conducted and the following data was obtained. Find the mean

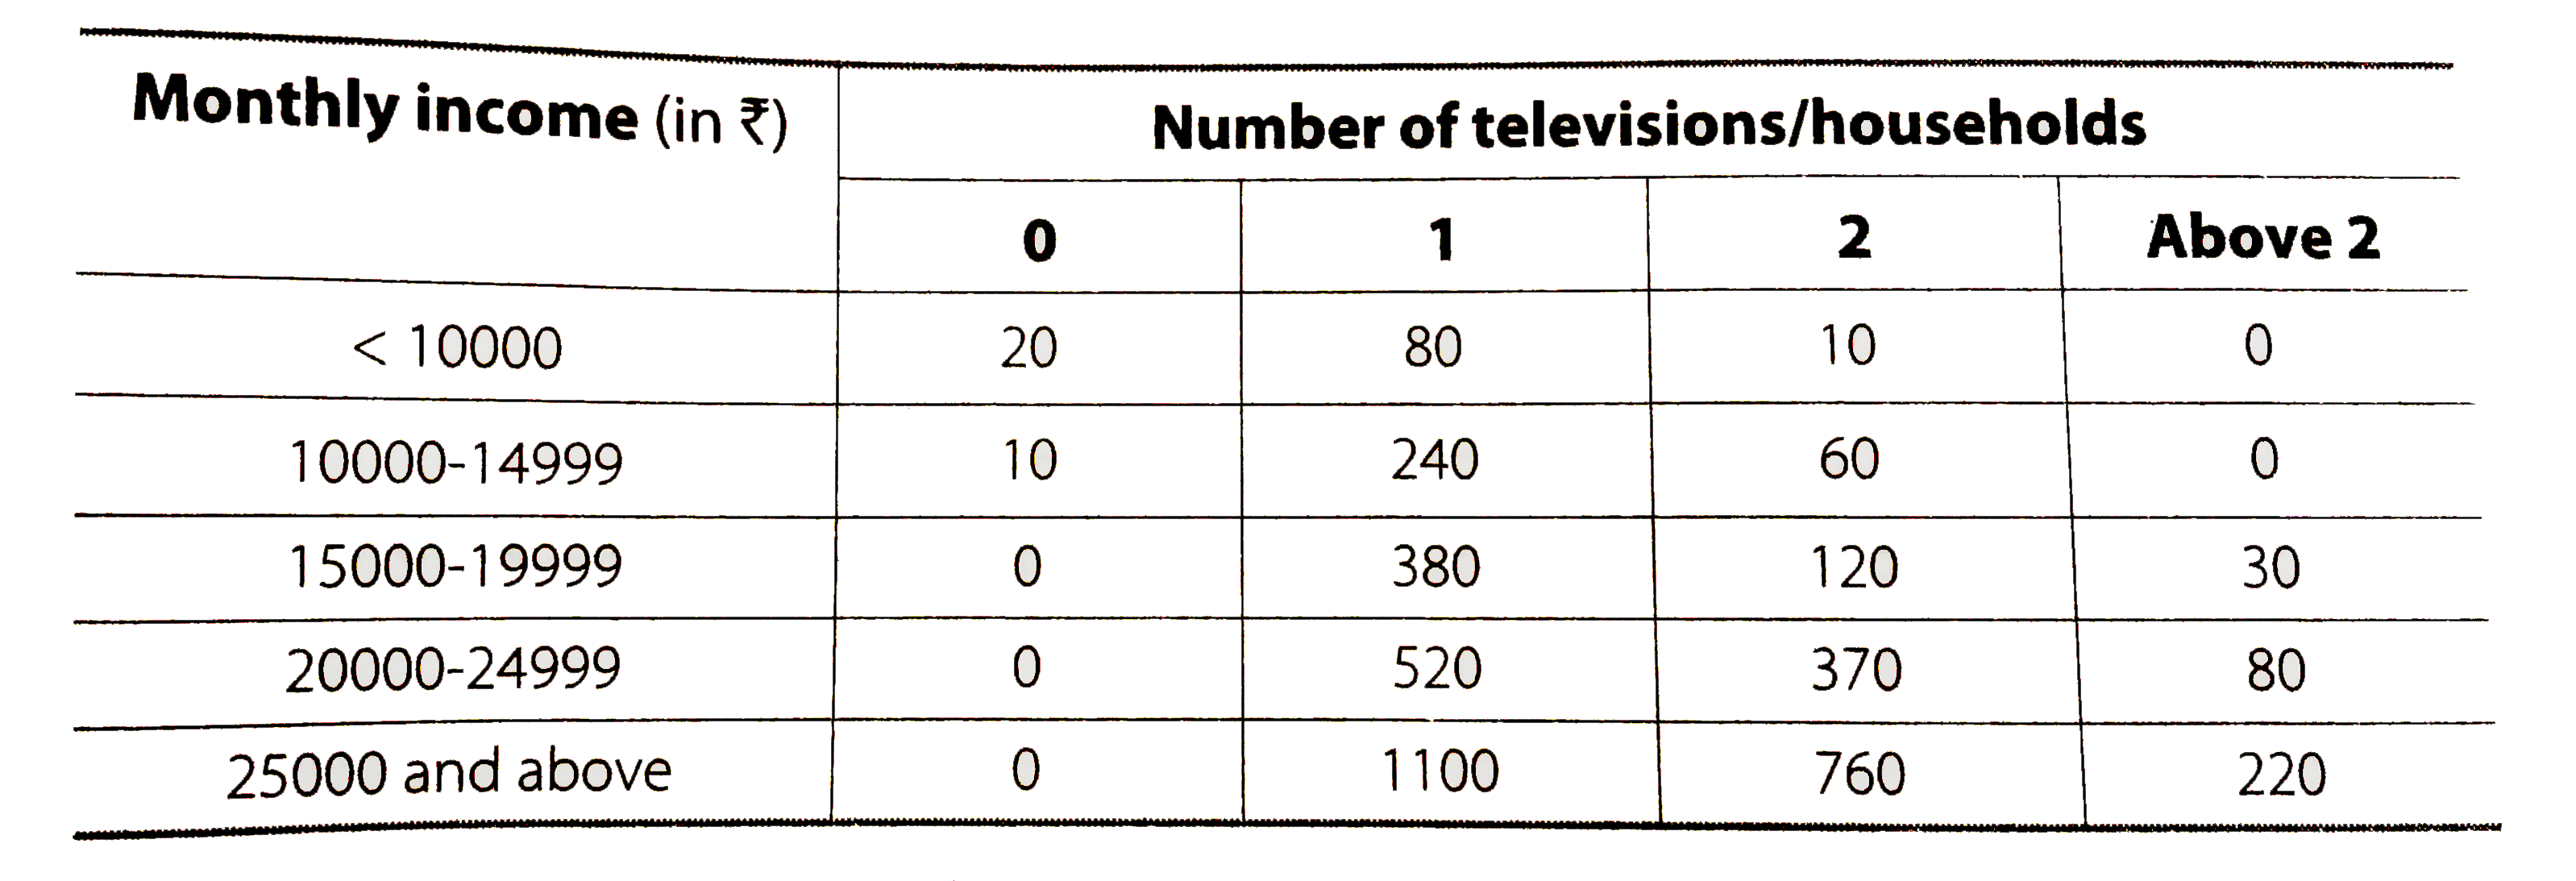
View SolutionA company selected 4000 households at random and surveyed them to find out a relationship between income level and the number of televisions sets in a home. The information, so obtained is listed in the following table.

Find the probability
i) of a household earning Rs 10000- Rs 14999 per year and having exactly one television.
ii) of a household earning Rs 25000 and more per year owning 2 televisions.
iii) of a household not having any television.
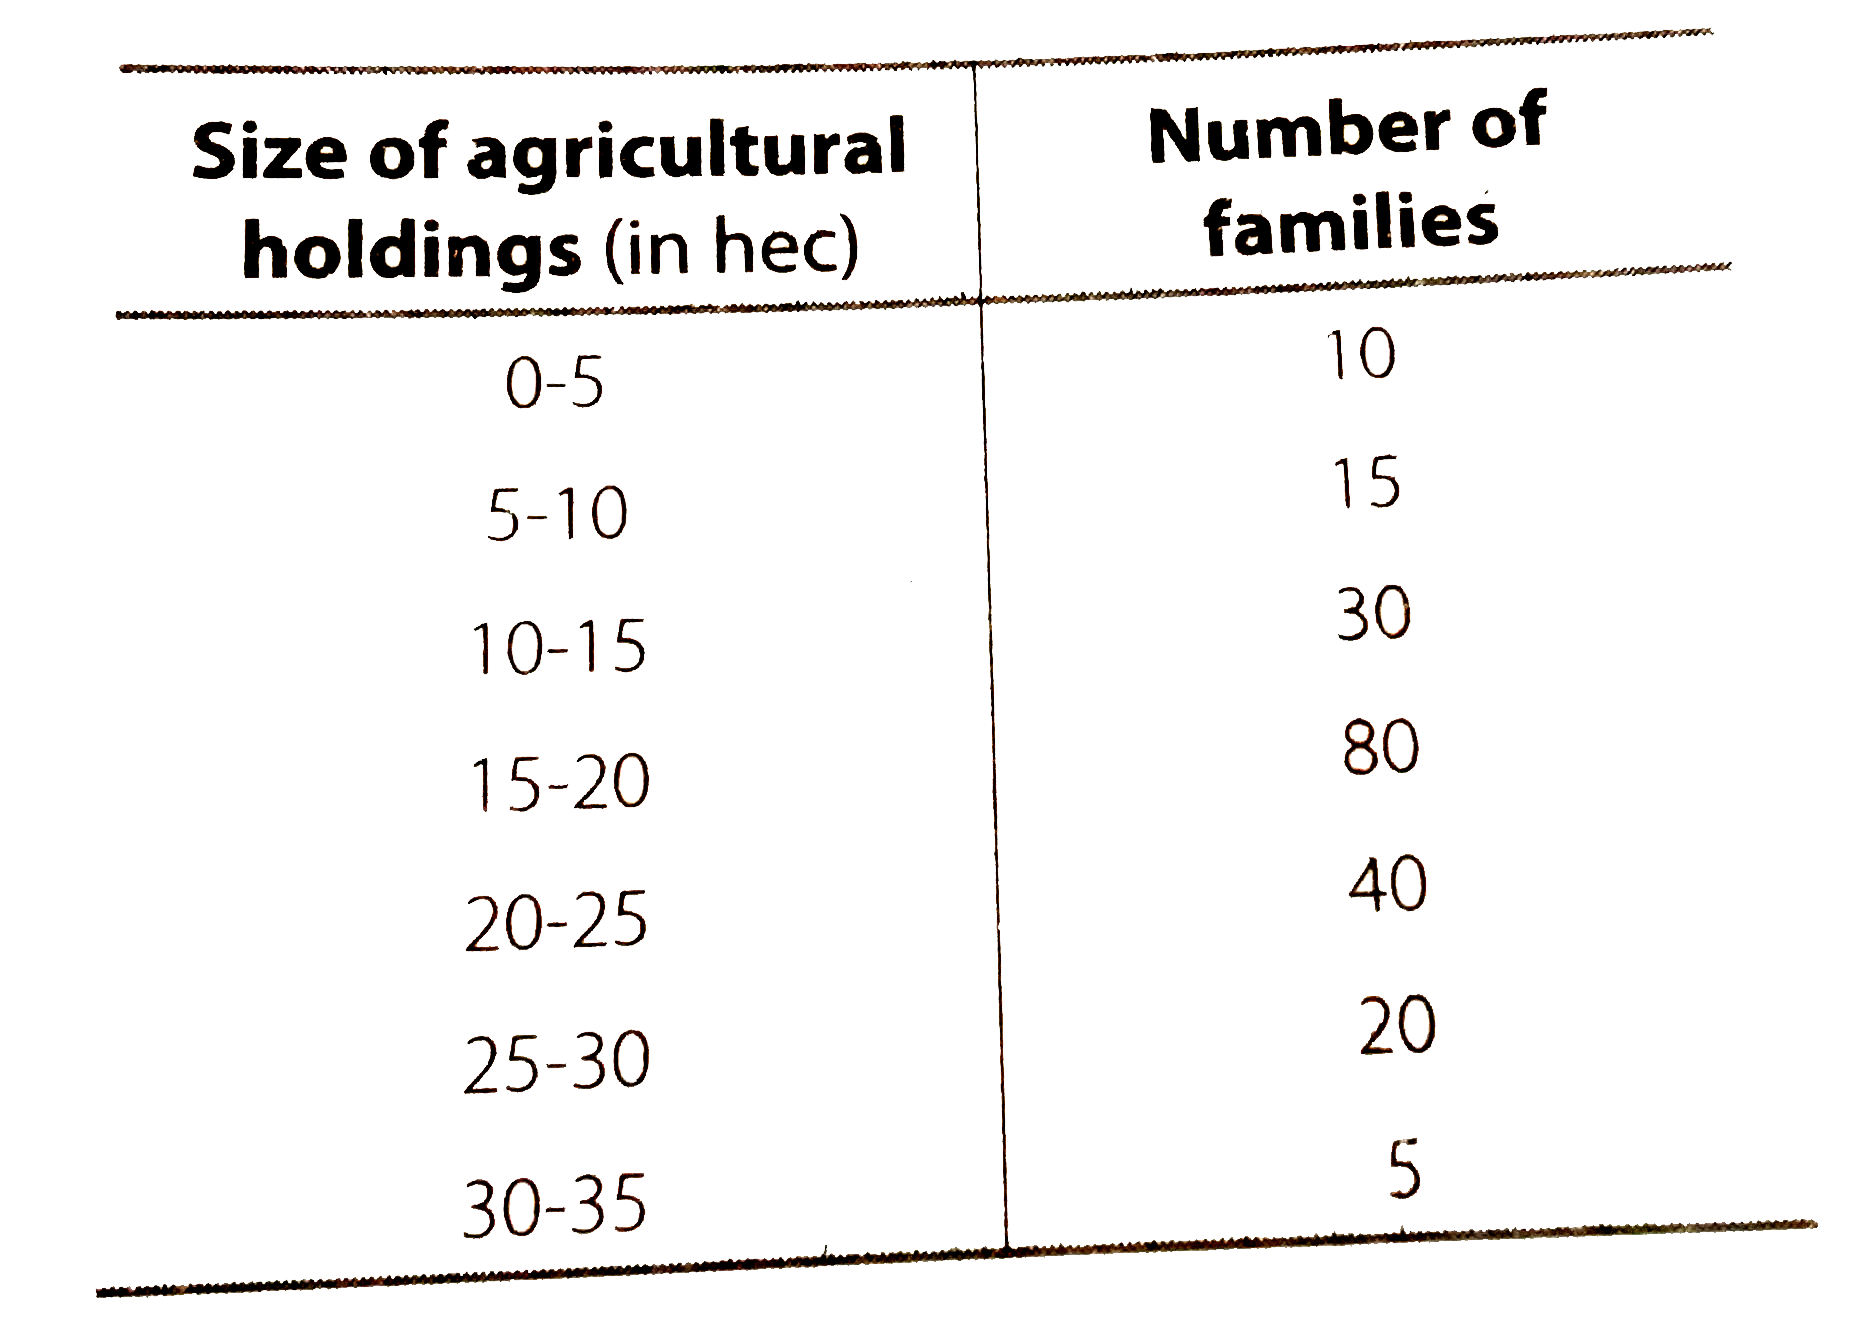
View SolutionSize of agricultural holding in a survey of 200 families is given in the following table.

Compute median and mode size of the holdings.
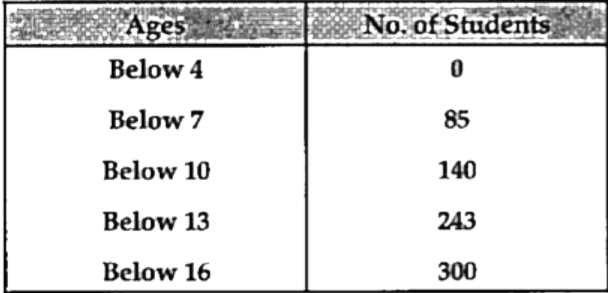
View SolutionConstruct the frequency distribution table from the following cumulative frequency table :

State the age - group which has the least number of students .
View Solution

