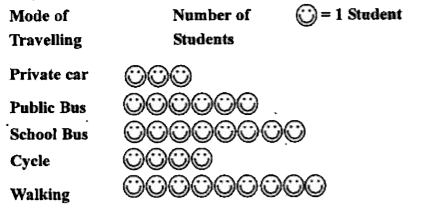
A survey was carried out on 30 students of class VI in a school. Data about different modes of transport used by them to travel to school was displayed through pictograph.

Observe this pictograph and answer these questions ?
(i) How many students come on foot ?
(ii) By which mode of transport, less students come ?Solution in Punjabi
The correct Answer is:(i) 9, (ii) Private car
Step by step video, text & image solution for A survey was carried out on 30 students of class VI in a school. Data about different modes of transport used by them to travel to school was displayed through pictograph. Observe this pictograph and answer these questions ? (i) How many students come on foot ? (ii) By which mode of transport, less students come ? by Maths experts to help you in doubts & scoring excellent marks in Class 6 exams.
Updated on:21/07/2023Topper's Solved these Questions
- DATA HANDLING BOOK - SWAN PUBLICATIONCHAPTER - DATA HANDLING EXERCISE - EXERCISE 14.3
5 Videos
- DATA HANDLING BOOK - SWAN PUBLICATIONCHAPTER - DATA HANDLING EXERCISE - MULTIPLE CHOICE QUESTIONS
9 Videos
- DATA HANDLING BOOK - SWAN PUBLICATIONCHAPTER - DATA HANDLING EXERCISE - MULTIPLE CHOICE QUESTIONS
9 Videos
- BASIC GEOMETRICAL CONCEPTSBOOK - SWAN PUBLICATIONCHAPTER - BASIC GEOMETRICAL CONCEPTSEXERCISE - MULTIPLE CHOICE QUESTIONS
12 Videos
- DECIMALSBOOK - SWAN PUBLICATIONCHAPTER - DECIMALSEXERCISE - MULTIPLE CHOICE QUESTIONS
20 Videos
Similar Questions
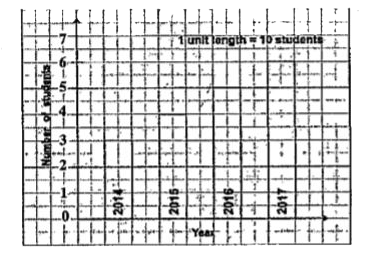
Read the adjoining bar graph showing the number of students in a particular class of a school:

Answer tbe following questions :
(i) What is the scale of.this graph ?
(ii) How many students are there in 2016 ?
(iii) Is the number of students in the year 2017 twice the year 2014 ?
View SolutionIf * represents 10 flowers then how many flowers does * * * * * represent?
View SolutionIf * represents 10 flowers then how many flowers does * * * * * represent?
View SolutionHow many lines can pass through a point ?
View Solution3+210=.............
View SolutionA survey was carried out on 30 students of class VI in a school. Data about the different modes of transport used by them to travel to school was displayed as pictograph. What can you conclude from the pictograph?
View SolutionA survey was carried out in a certain school to find about different modes of transport used by students to travel to school each day. 30 students of class VI were interviewed and the data obtained was displayed in the form of a pictographs given below: Mode of Transport, Number of Students Scooter, Figure Public Bus, Figure School Bus, Figure Cycle, Figure Walking, Figure Look at the above pictograph and answer the following questions: Look at the above pictograph and answer the following questions: How many students are using cycle or walking as a mode of travel? Which is most popular mode of travel?
View SolutionDetermine the point of symmetry of a regular hexagon.
View SolutionMatch the following Column A to Column B

View SolutionMatch the following Column A to Column B

View SolutionMatch the following Column A to Column B

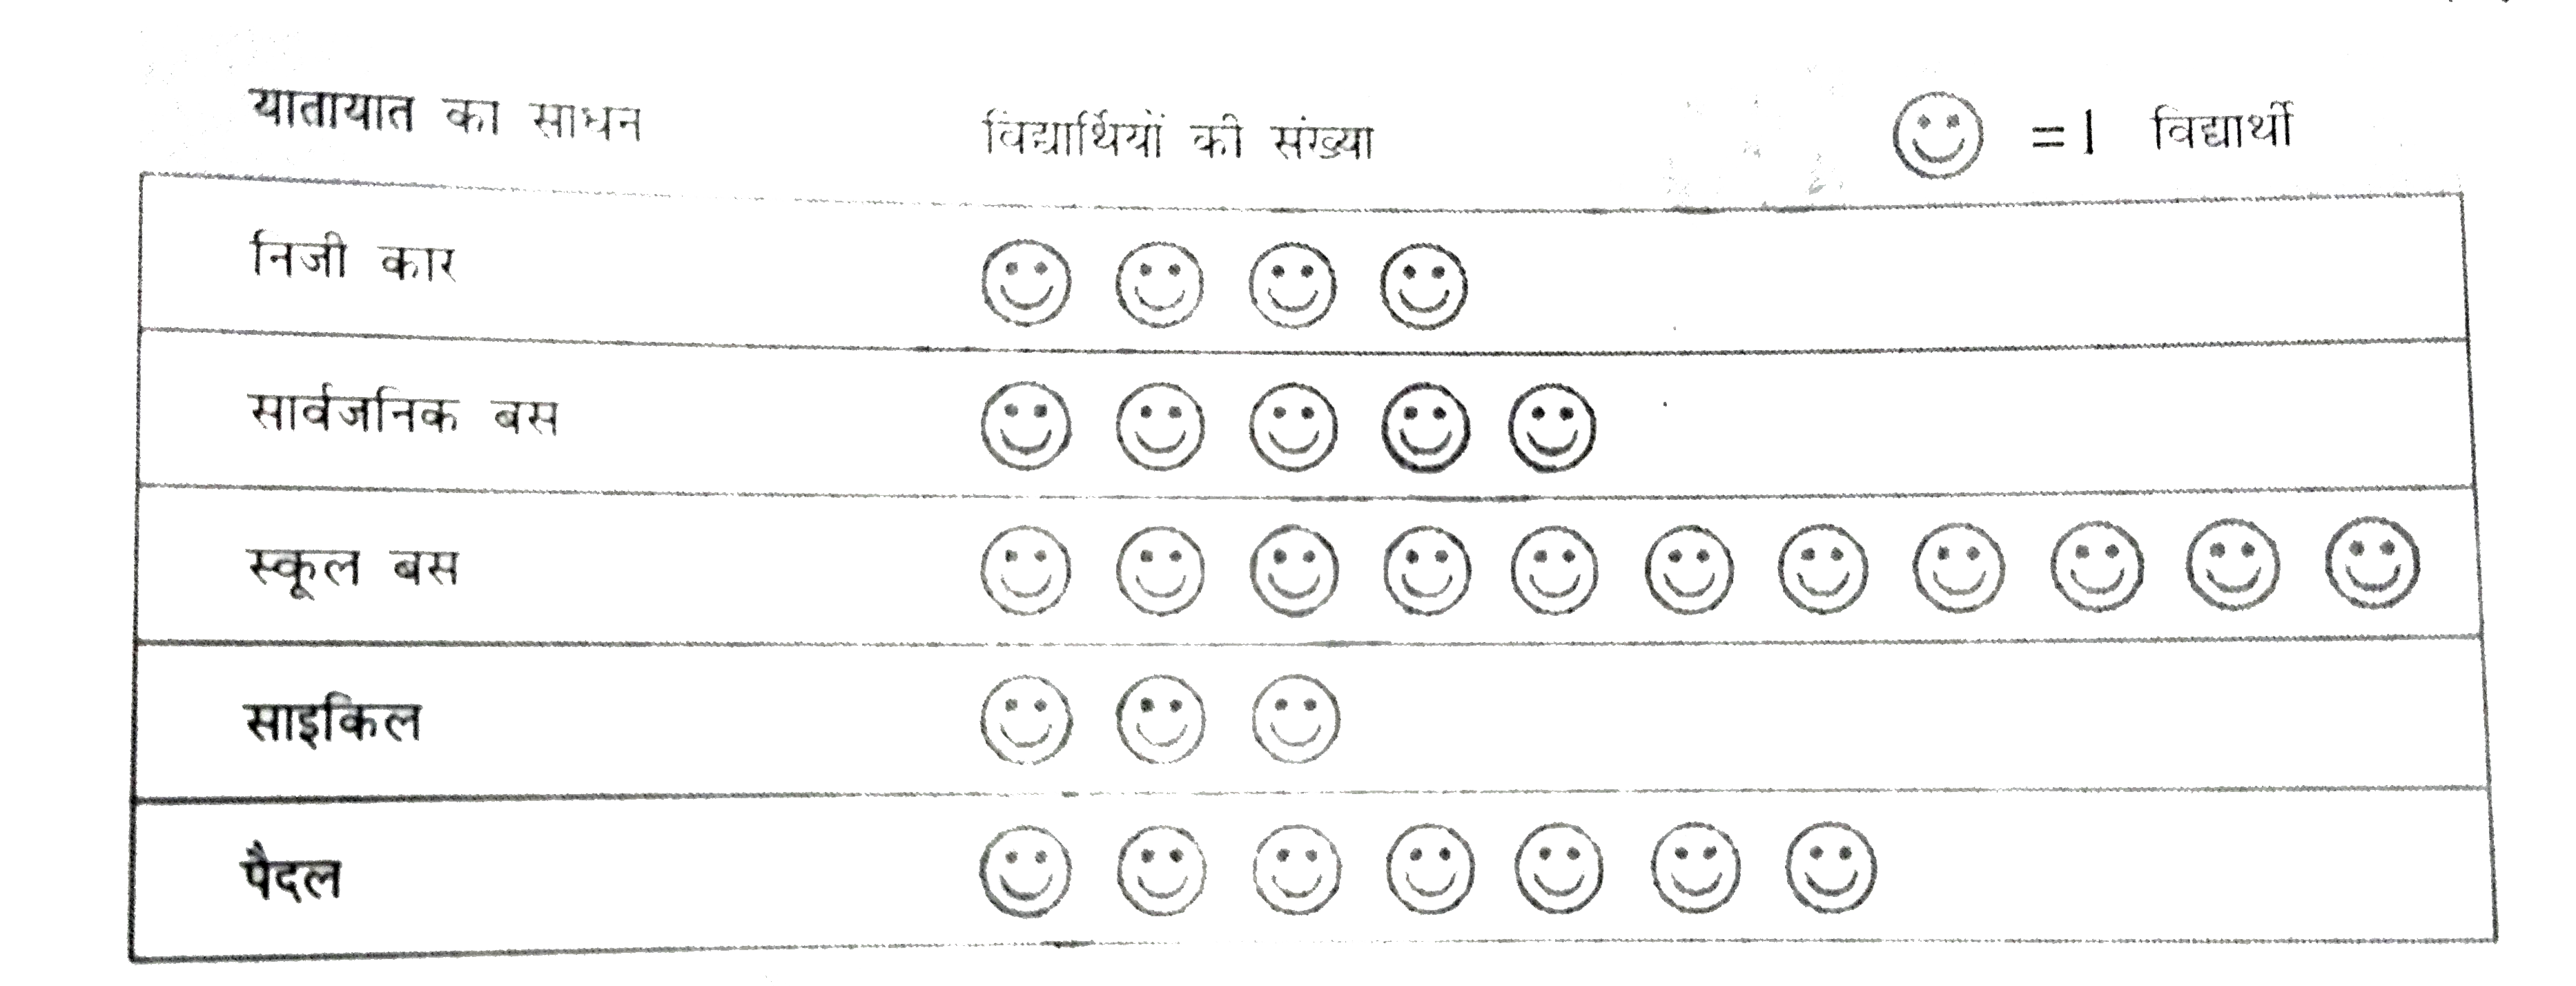
View Solutionकिसी स्कूल में एक सर्वेक्षण द्वारा यह पता लगाया गया कि प्रतिदिन स्कूल आने के लिए विद्यार्थी यातायात के किस साधन का प्रयोग करते है । कक्षा VI के 30 विद्यार्थयों से साक्षाताकार किया गया । और प्राप्त आंकड़ों को एक चित्रालेख के रूप में निम्न प्रकार प्रदर्शित किया गया :
 .
.
इस चित्रालेख से आप क्या निष्कर्ष निकाल सकते है ।
(a) निजी कार से आने वाले विद्यार्थीयो की संख्या 4 है ।
(b) अधिकतम विद्यार्थी (11) स्कूल बस से स्कूल आते है । यह यातायात का सर्वाधिक लोकप्रिय साधन है ।
(c) साइकिल का प्रयोग केवल तीन विद्यार्थी ही करते है ।
(d) अन्य साधनो का प्रयोग करने वाले विद्यार्थीयो की संख्या भी इसी प्रकार ज्ञात की जा सकती है ।
View SolutionIn a class of 50 students, each one come to school by bus or by bicycle or on foot. 25 by bus, 20 by bicycle, 30 on foot and 10 students by all the three. Now how many students come to school exactly by two modes of transport?
View SolutionA survey was carried out on 30 students of class VI in a school. Data about the different modes of transport used by them to travel to school was displayed as pictograph. What can you conclude from the pictograph?
View SolutionA survey was carried out in a certain school to find about different modes of transport used by students to travel to school each day. 30 students of class VI were interviewed and the data obtained was displayed in the form of a pictographs given below: Mode of Transport, Number of Students Scooter, Figure Public Bus, Figure School Bus, Figure Cycle, Figure Walking, Figure Look at the above pictograph and answer the following questions: Look at the above pictograph and answer the following questions: How many students are using cycle or walking as a mode of travel? Which is most popular mode of travel?
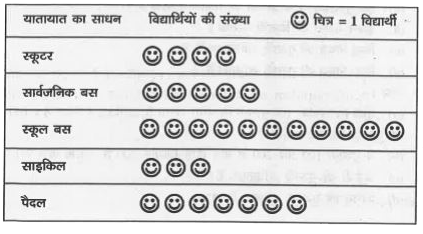
View Solutionकिसी स्कूल में एक सर्वेक्षण द्वारा यह पता लगाया गया कि प्रतिदिन स्कूल आने के लिए विद्यार्थी यातायात के किस साधन का प्रयोग करते हैं। कक्षा VI के 30 विद्यार्थियों से साक्षात्कार किया गया और प्राप्त आँकड़ों को एक चित्रालेख के रूप में निम्न प्रकार प्रदर्शित किया गया :

इस चित्रालेख को देख कर, निम्न प्रश्न के उत्तर दीजिए:
क्या आप उन विद्यार्थियों की संख्या बता सकते हैं जो स्कूल आने के लिए स्कटूर का प्रयोग करते हैं ?
View Solution
