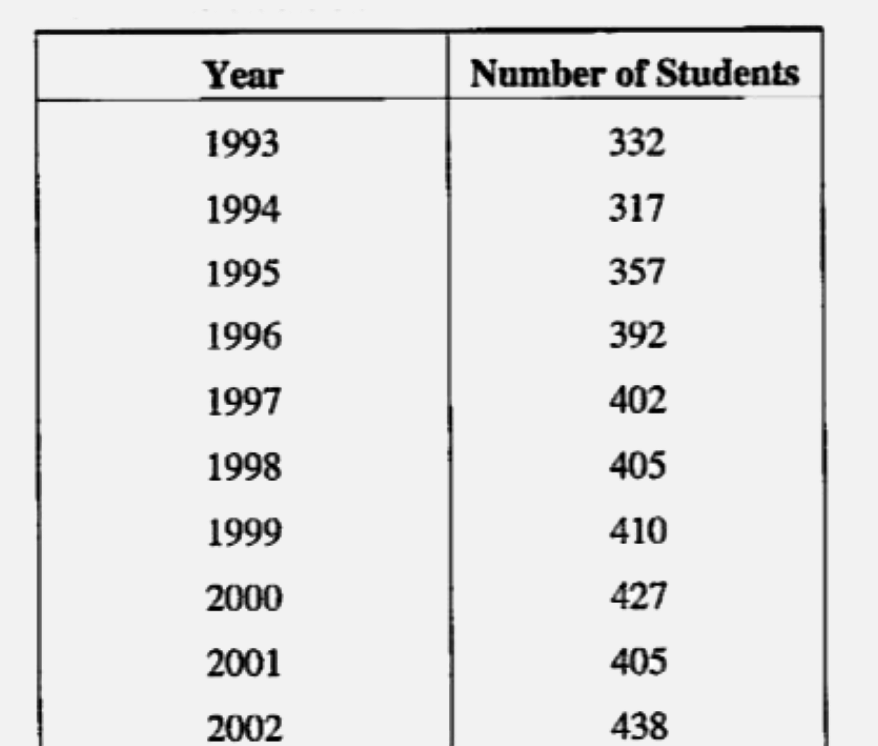
Complete the table using 4 yearly moving average method
The correct Answer is:=−,16.625,16.875
Topper's Solved these Questions
- QUESTION BANK 2021BOOK - NAVNEET PUBLICATION - MAHARASHTRA BOARDCHAPTER - QUESTION BANK 2021EXERCISE - Part II 5. INDEX NUMBERS (I) Choose the correct alternative.)
9 Videos
- QUESTION BANK 2021BOOK - NAVNEET PUBLICATION - MAHARASHTRA BOARDCHAPTER - QUESTION BANK 2021EXERCISE - Part II 5. INDEX NUMBERS (II Fill in the blanks.)
8 Videos
- QUESTION BANK 2021BOOK - NAVNEET PUBLICATION - MAHARASHTRA BOARDCHAPTER - QUESTION BANK 2021EXERCISE - Part II 4. TIME SERIES (IV) Solve the following problems.)
6 Videos
- PROBABILITY DISTRIBUTIONBOOK - NAVNEET PUBLICATION - MAHARASHTRA BOARDCHAPTER - PROBABILITY DISTRIBUTIONEXERCISE - MULTIPLE CHOICE QUESTIONS
9 Videos
- THREE DIMENSIONAL GEOMETRY BOOK - NAVNEET PUBLICATION - MAHARASHTRA BOARDCHAPTER - THREE DIMENSIONAL GEOMETRY EXERCISE - MULTIPLE CHOICE QUESTIONS
8 Videos
Similar Questions
The production of cement by a firm in years 1 to 9 is given below:

Calculate the trend values for the above series by the 3 yearly moving average method.
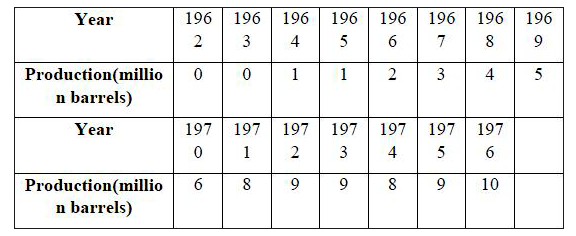
View SolutionThe following table shows the production of gasoline in U.S.A. for the years 1962 to 1976. Obtain trend values for the above data using 5-yearly moving averages.

View SolutionThe averge number , in thousands , of working hours lost in strikes each year of the period 2000-2009 was as under

. Calculate the three - yearly moving averages .
View SolutionObtain trend values for data in Problem 1 using 4-yearly centered moving averages.
View SolutionCalculate the 5 yearly moving averages of the following time series of steel production

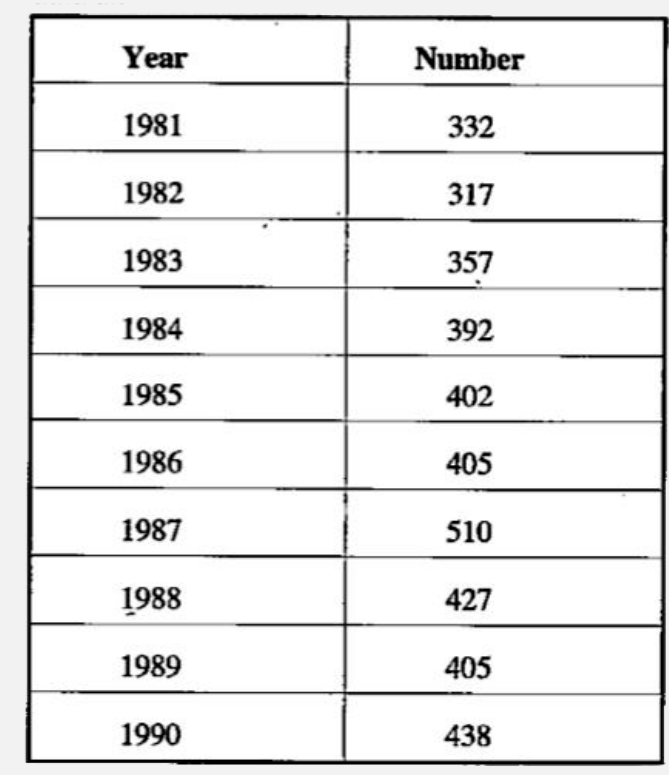
View SolutionThe following table gives the number of failures of commercial industries in a country during the year 1975 to 1990

Draw a graph illustrating these figures. Calculate the 4 yearly moving averages and plot them on the same graph.
View SolutionThe following table gives the numbers of failures of commercial industries in a country during the years 2000 to 2015.

Draw a graph illustrating these figure.
Calculate the 4 yearly moving averages and plot them on the same graph.
View SolutionCalculate the 5 yearly moving averages of the number of students in a College from the following data and plot them on a graph paper :

View SolutionFrom the details given below, calculate the five yearly moving averages of the number of students who have studied in a school.

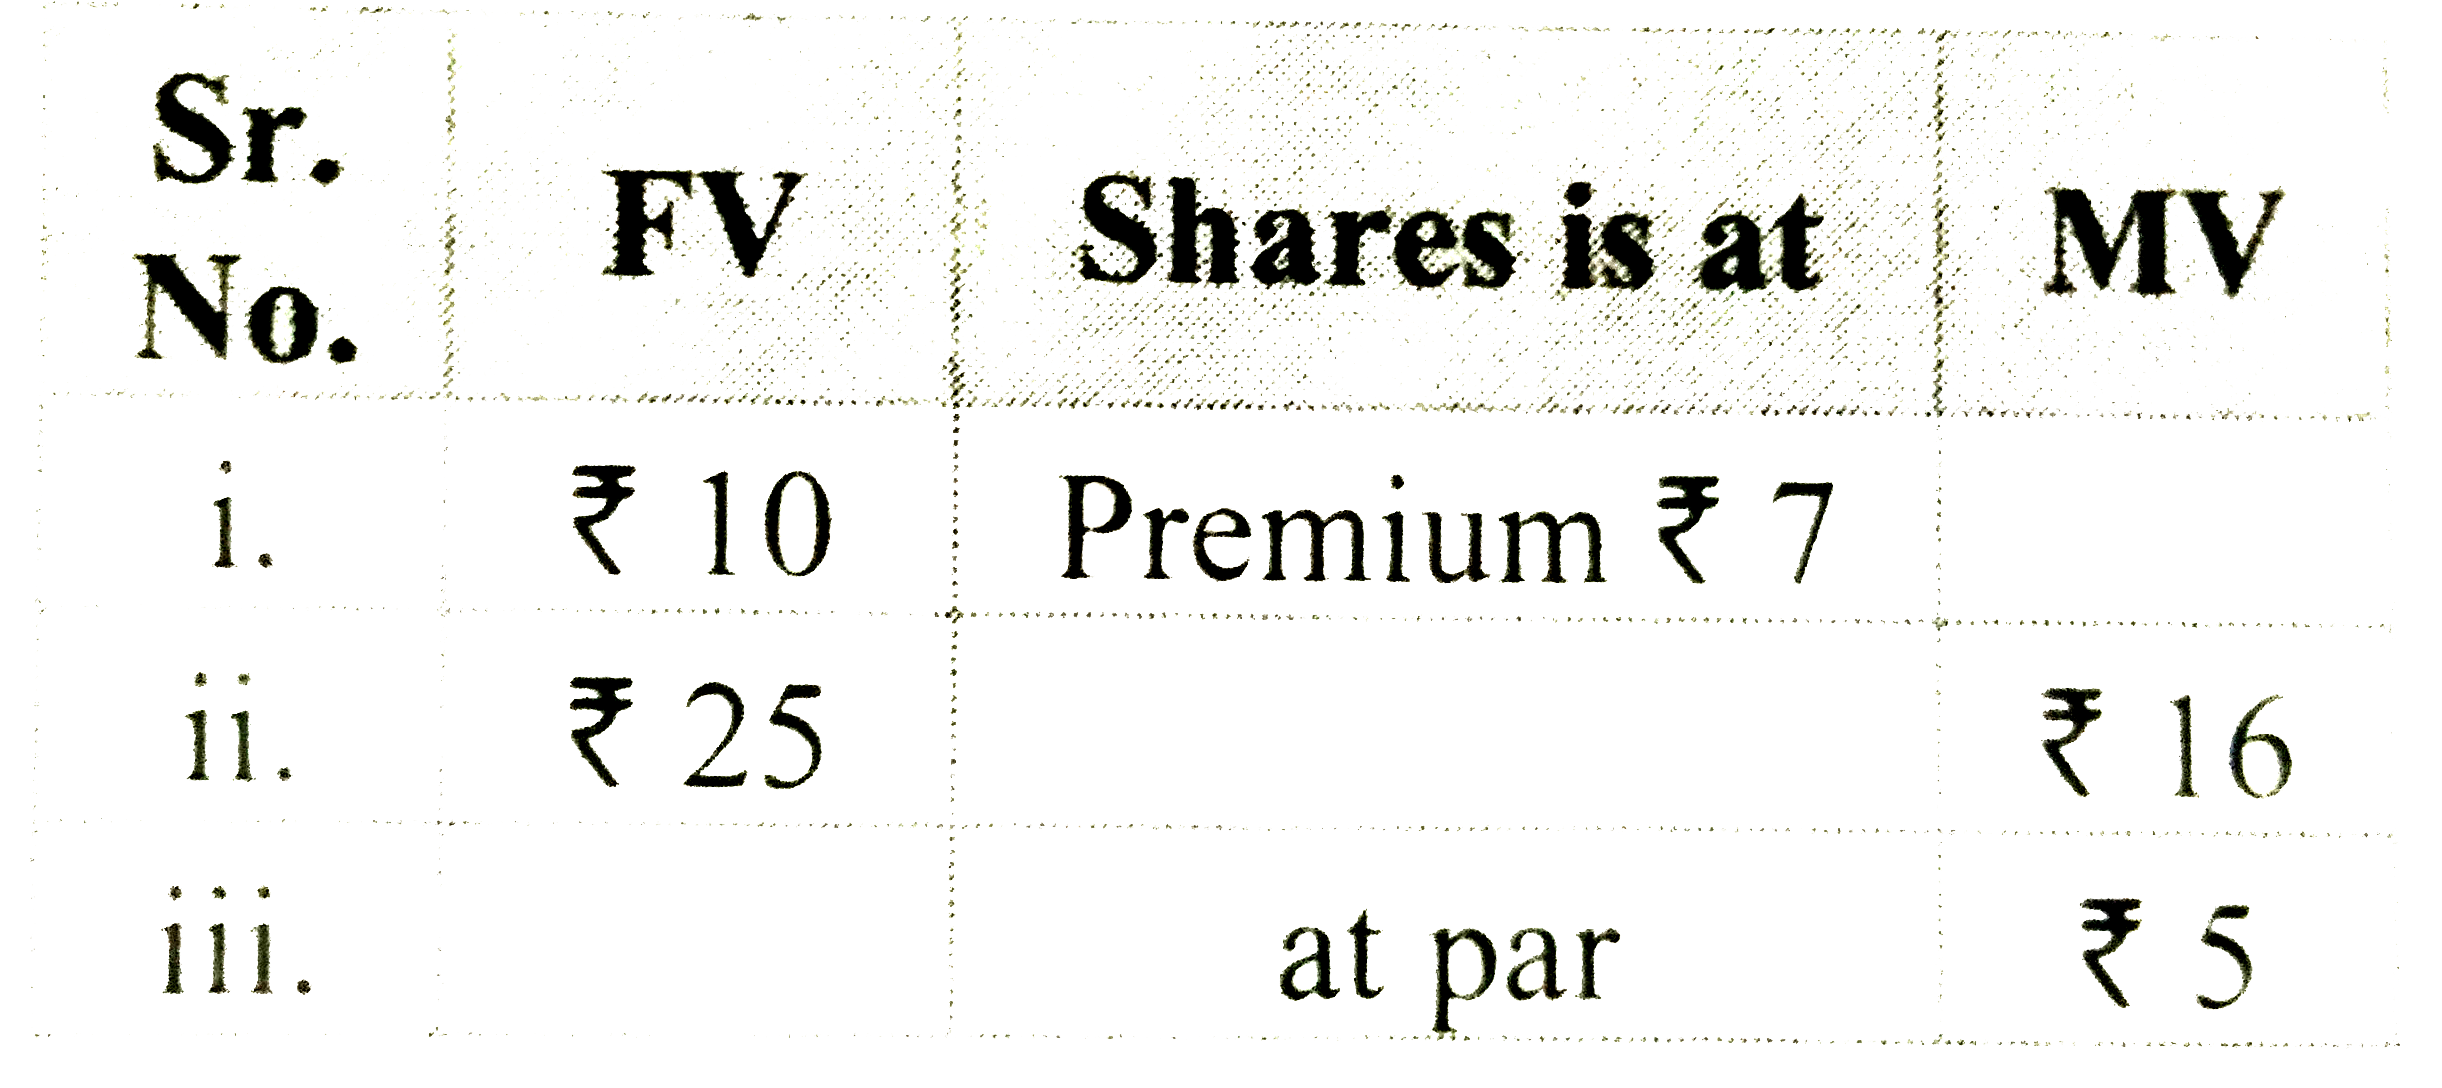
View SolutionComplete the following table using given information

View Solution
