Draw a histogram for the daily earnings of 30 drug stores in the following table: Daily earning (in Rs.), 450-500, 500-550, 550-600, 600-650, 650-700 No. of Stores:, 16, 10, 7, 3, 1
Step by step video & image solution for Draw a histogram for the daily earnings of 30 drug stores in the following table: Daily earning (in Rs.), 450-500, 500-550, 550-600, 600-650, 650-700 No. of Stores:, 16, 10, 7, 3, 1 by Maths experts to help you in doubts & scoring excellent marks in Class 9 exams.
Updated on:21/07/2023Topper's Solved these Questions
Similar Questions
Find the mean deviation from the mean for the following data: Classes 0-100 100-200 200-300 300-400 400-500 500-600 600-700 700-800 Frequencies 4 8 9 10 7 5 4 3
View SolutionThe following table gives the distribution of total household expenditure (in rupees) of manual workers in a city. Expenditure: (in Rs.) 100-150 150-200 200-250 250-300 300-350 350-400 400-450 450-500 Frequency: 24 40 33 28 30 22 16 7 Find the average expenditure (in Rs.) per household.
View SolutionTotal number of students of a school in different years is shown in the following table: Year, No. of Students 1996 1998 2000 2002 2004, 400 550 450 600 650 Represent the above data by a pictograph. Prepare a pictograph of students using one symbol an icon of a student to represent 100 students and answer the following questions: How many symbols represent total number of students in the year 2002? How many symbols represent total number of students in the year 1998? Prepare another pictograph of students using any other symbol each representing 50 students. Which pictograph do you find more informative?
View SolutionDraw a histogram for the frequency table made for the data in Question 3, and answer the following questions.(i) Which group has the maximum number of workers?(ii) How many workers earn Rs 850 and more?(iii) How many workers earn less than Rs 850?
View SolutionThe following table gives the distribution of total household expenditure (in rupees) of manual workers in a city. Expenditure (in rupees) (xi) Frequency (fi) 100-150 24 150-200 40 200-250 33 250-300 28 300-350 30 350-450 22 400-450 16 450-500 7 Find the average expenditure (in rupees) per household.
View SolutionIn an experiment on photoelectric effect, the stopping potential is measured for monochromatic light beams corresponding to different wavelength. The data collected are as follows:
wavelength (nm): 350 400 450 500 550
stopping potential (V): 1.45 1.00 0.66 0.38 0.16
Plot the stopping potential against inverse of wavelength on a graph paper and find (a) the Planck constant, (b) the work function of the emitter and (c) the threshold wavelength .
View SolutionThe median of the following data is 525. Find the missing frequency, if it is given that there are 100 observations in the data: Class interval Frequency Class interval Frequency 0 100 2 500 600 20 100 200 5 600 700 f2 200 300 f1 700 800 9 300 400 12 800 900 7 400 500 17 900 1000 4
View SolutionThe following table gives the weights (in grams) of 30 boxes of fruits :
Weight (in grams)350425500375475400450Number of boxes5364237
Find the mean and the median.
Using empirical formula, calculate its mode.
View SolutionThe weekly wages (in Rs.) of 30 workers in a factory are give: 830,835,890,810,835,836,869,845,898,890, 820,860,832,833,855,845,804,808,812,,840,885,835,835,836,878,840,868,890,806,840 Mark a frequency table with intervals as 800-810, 810-820 and so on, using tally marks. Also, draw a histogram and answer the following questions: Which group has the maximum number of workers? How many workers earn Rs. 850 and more? How many workers earn less than Rs. 850?
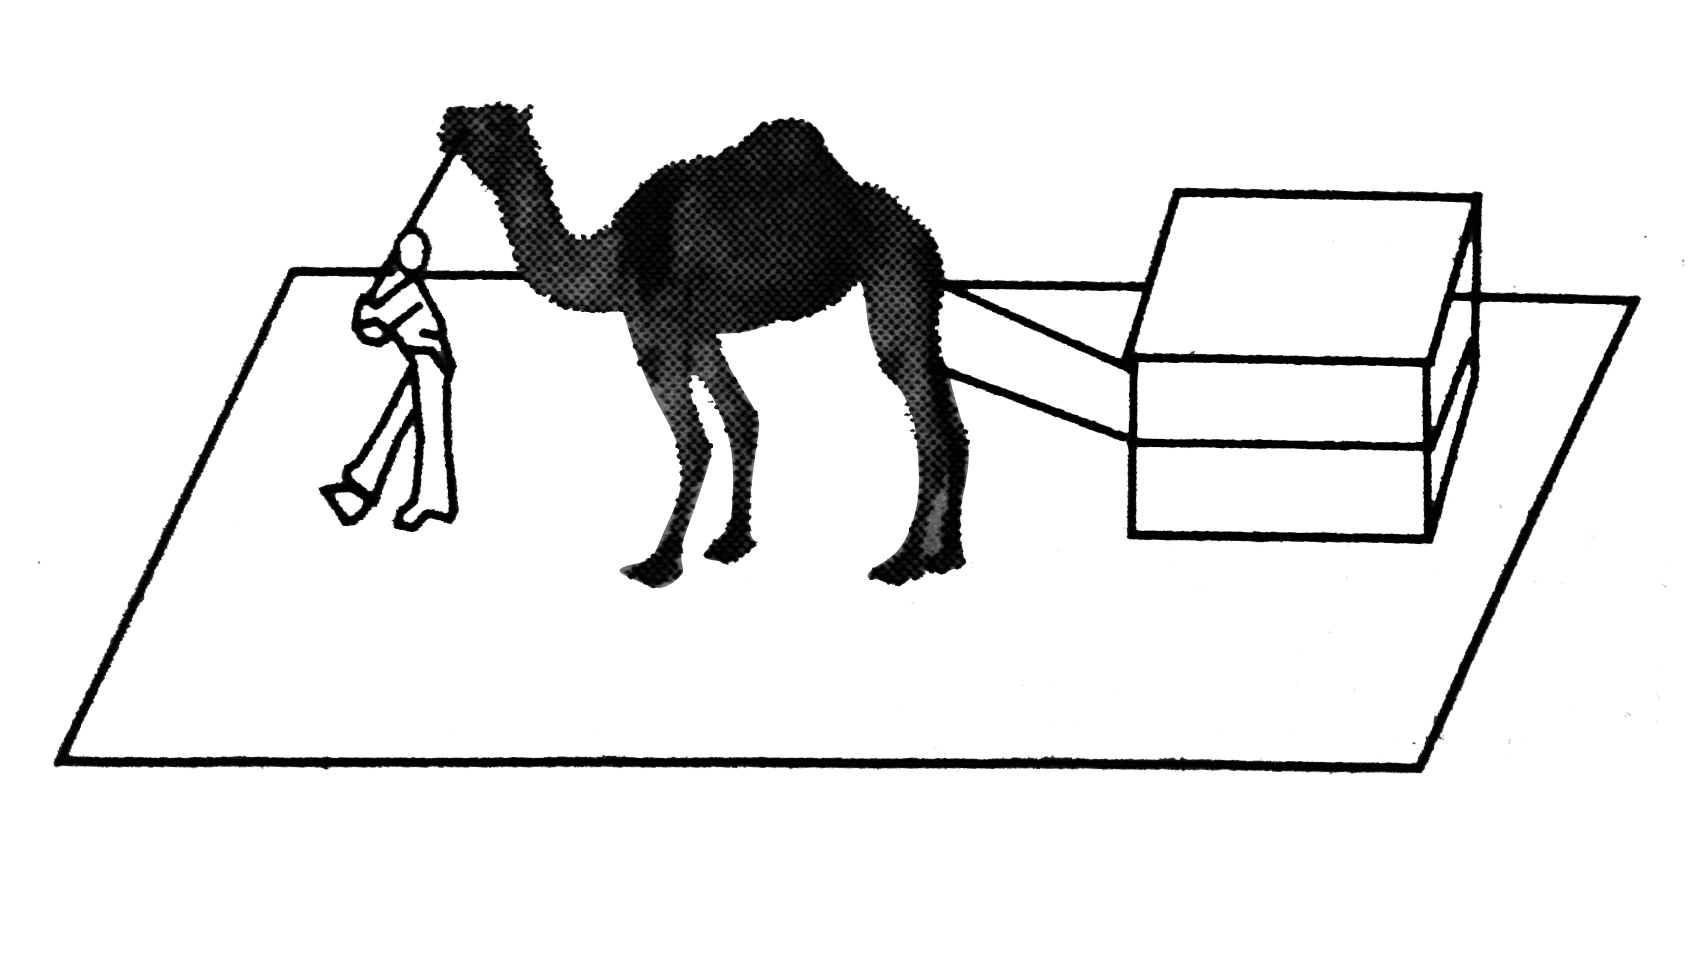
View SolutionRam and Ali have been fast friends since childhood. Ali neglected studies and now has no means to earn money other than a channel whereas Ram has become an engineer. Now both are working in the same factory. Ali uses camel to transport the load within the factory.
 Due to low salary and degradation in health of camel, Ali becomes worried and meets his friend Ram and discusses his problems. Ram collected some data and with some assumptions concluded the following:
i. The load used in each trip is 1000kg and has friction coefficient μk=0.1 and μs=0.2.
ii. Mass of camel is 500kg.
iii. Load is accelerated for first 50m with constant acceleration, then it is pulled at a constant speed of 5ms−1 for 2km and at last stopped with constant retardation in 50m.
iv. From biological data, the rate of consumption of energy of camel can be expressed as P=18×103v+104Js−1 where P is the power and v is the velocity of the camel. After calculations on different issues, Ram suggested proper food, speed of camel, etc. to his friend. For the welfare of Ali, Ram wrote a letter to the management to increase his salary.
(Assuming that the camel exerts a horizontal force on the load):
The ratio of the energy consumed by the camel during uniform motion for the two cases when it moves with speed 5ms−1 to the case when it moves with 10ms−1
View Solution
