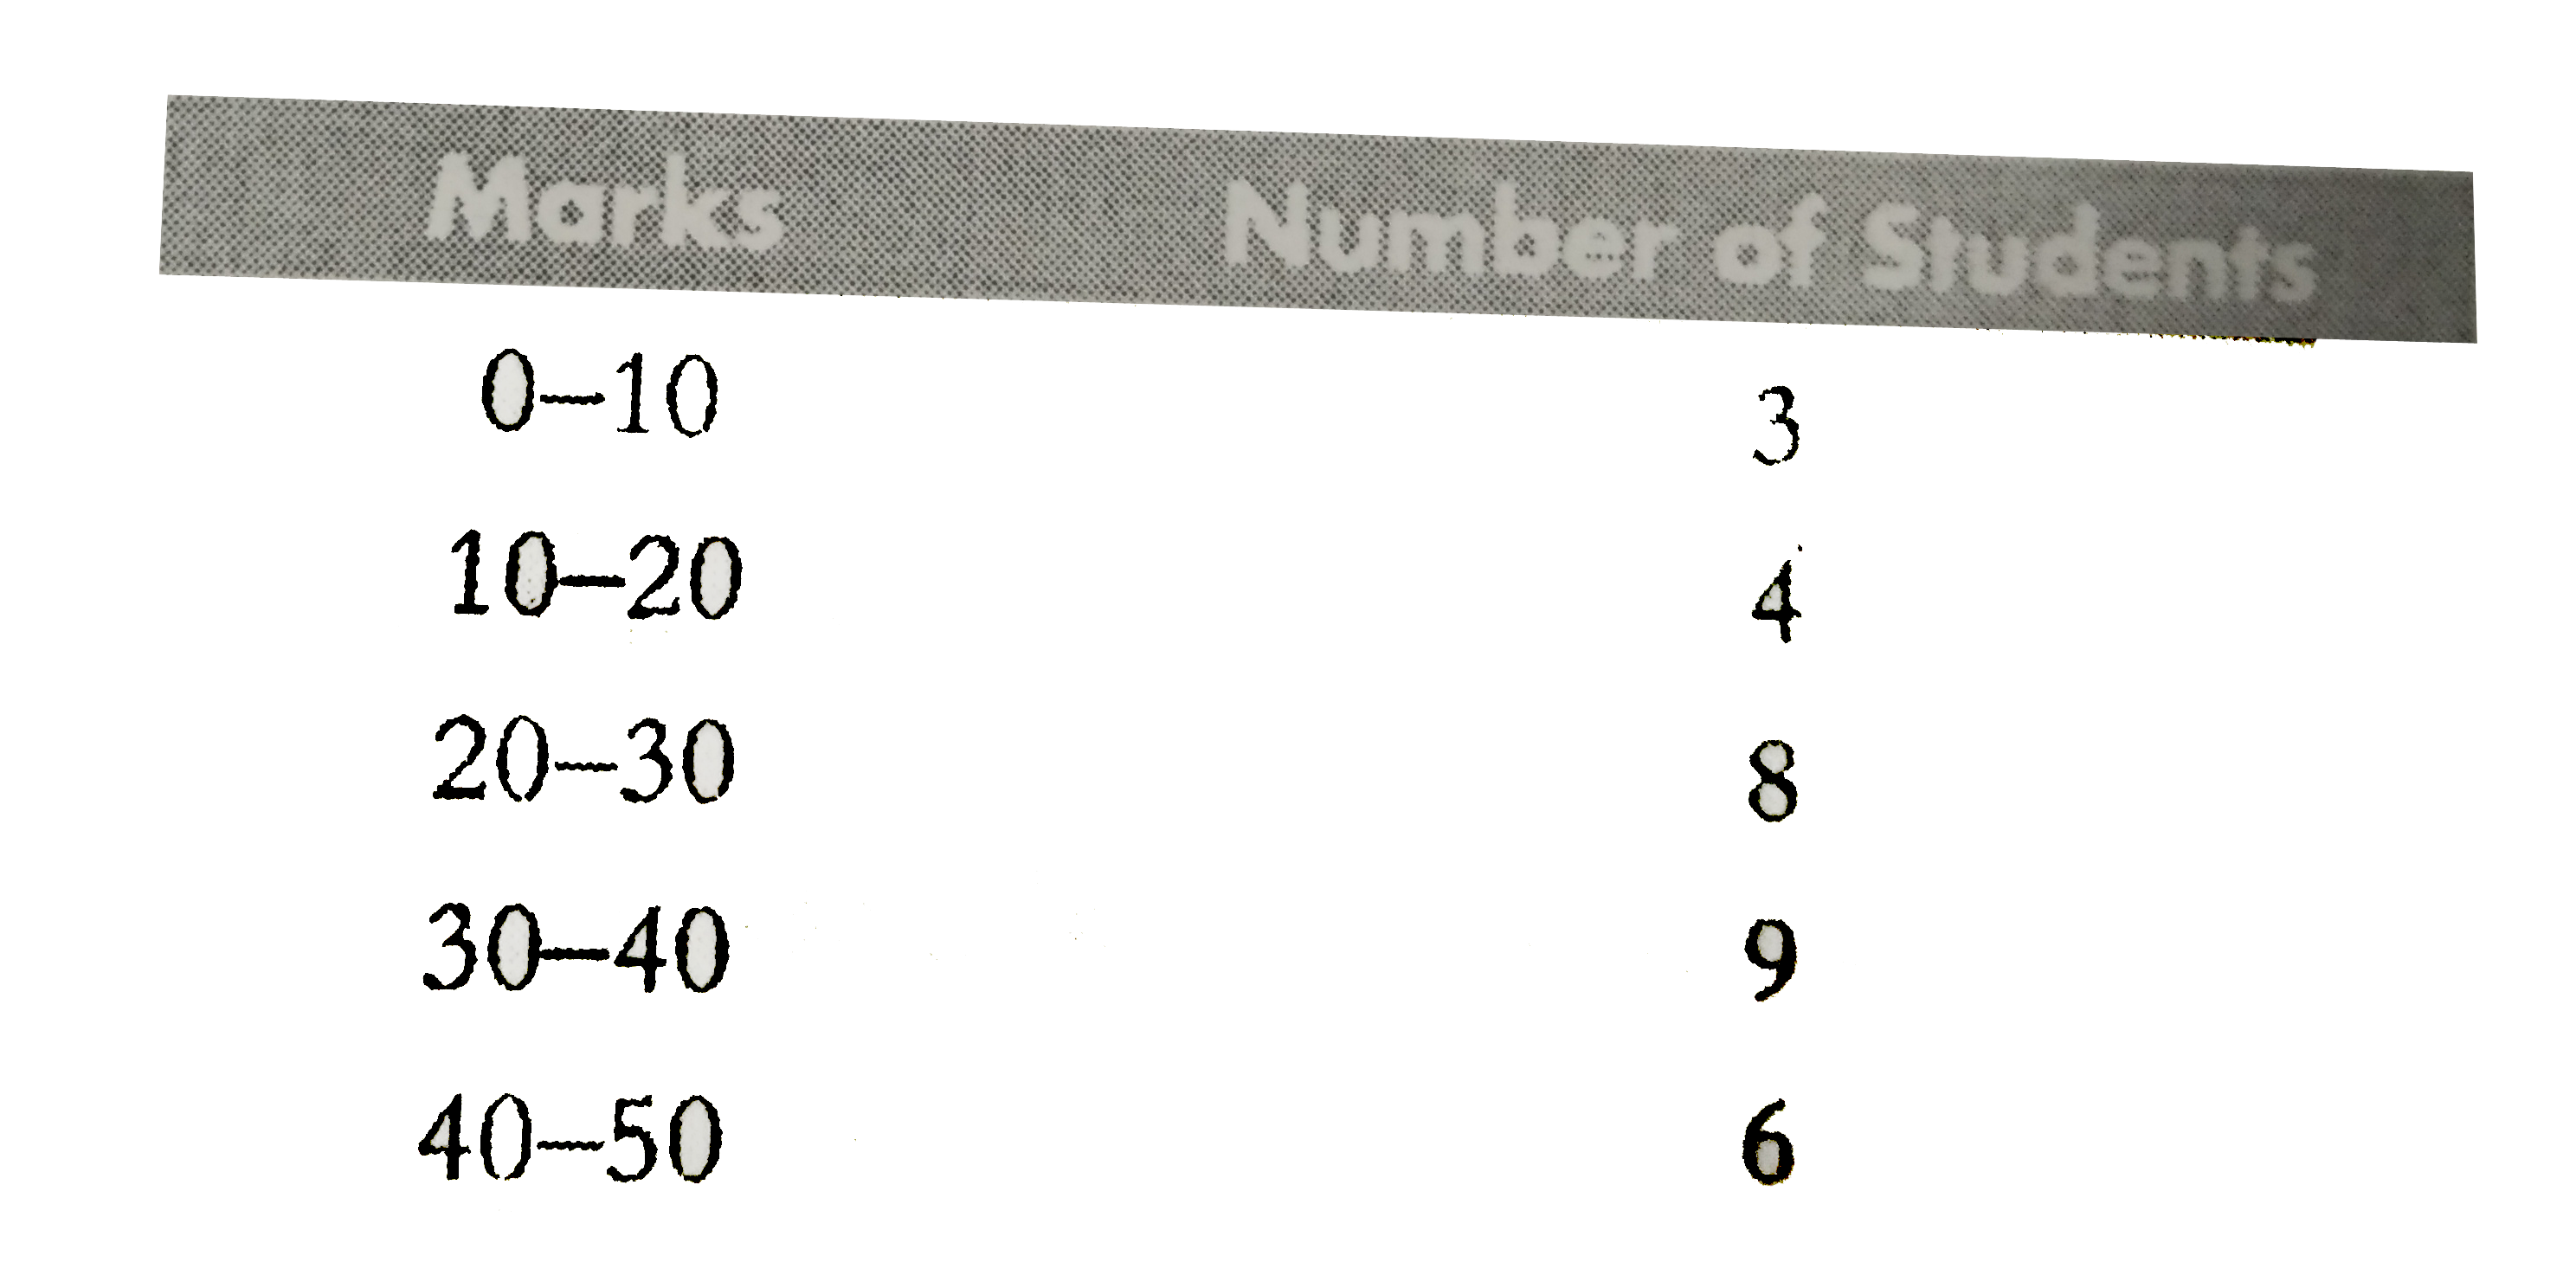
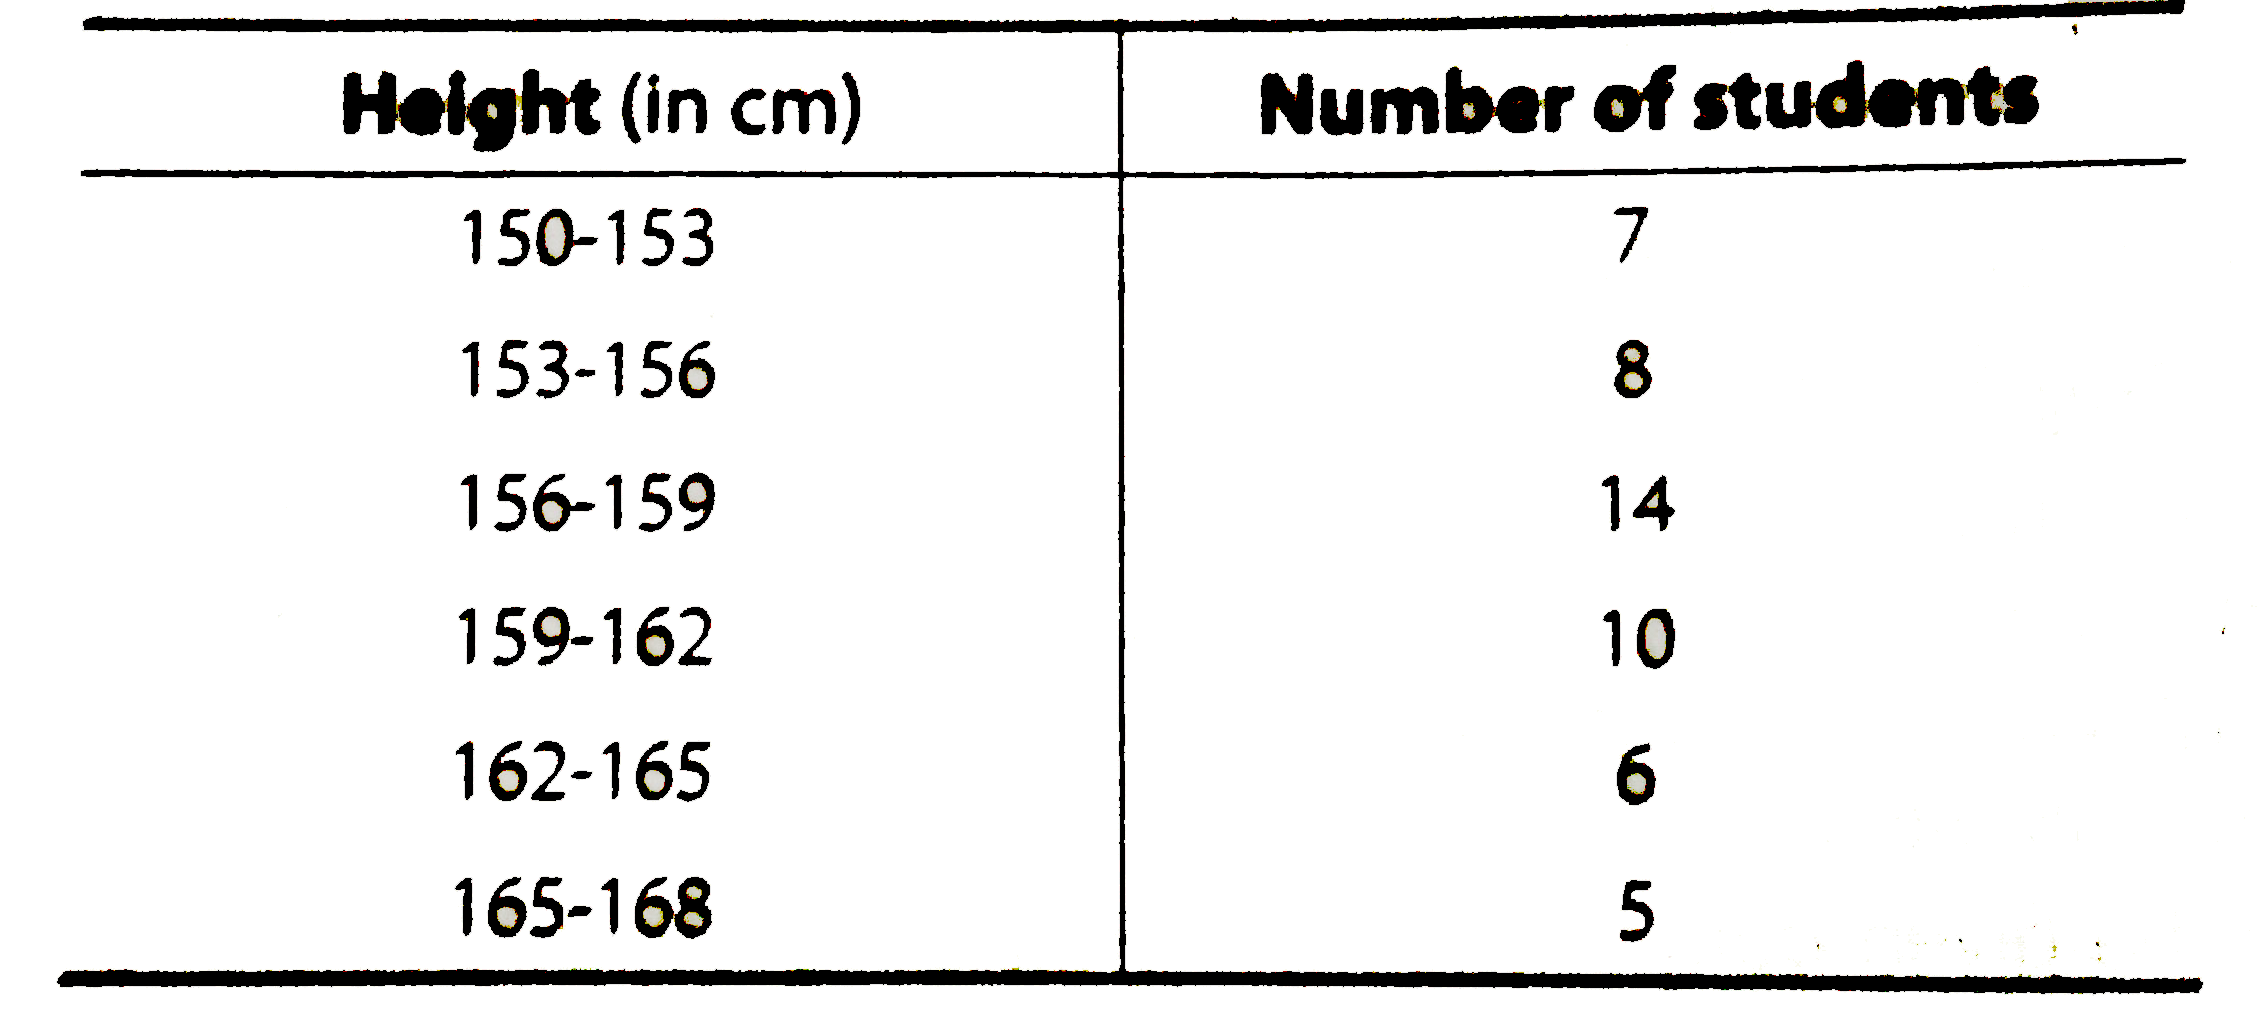
Draw a histogram for the marks of students given below :

Video Solution
Text Solution
Since the class intervals are of unequal width, we use Adjusted Frequency
Adjusted Frequency= (Minimum class sizeclass size)×Frequency of class


|
Topper's Solved these Questions
Similar Questions
Knowledge Check
Study the given histogram that shows the marks obtained by students in examination and answer the question that follows
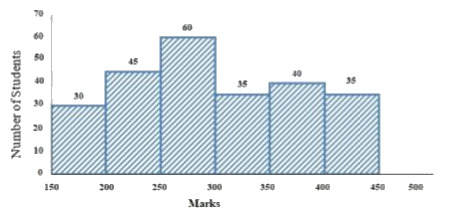
The number of students who obtained less than 200 marks is :AA)45BB)135CC)30DD)75Study the given histogram that shows the marks obtained by students in an examination and answer the question that follows .
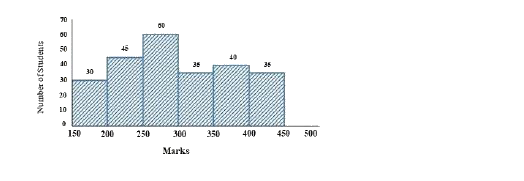
The number of students who obtained less than 250 marks is :A135B75C30D45In the given histogram, in which class notes the median height of the students lie
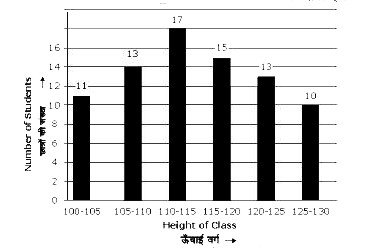 A120-125B105-110C115-120D110-115


