A histogram
is a pictorial representation of the grouped data in which class intervals
and frequency are respectively taken along.
1)vertical axis and horizontal axis
2)vertical axis only
3)horizontal axis only
4)horizontal axis and vertical axis.
In histogram class interval or group has taken on the horizontal axis and frequency on the vertical axis.
Topper's Solved these Questions
Similar Questions
Knowledge Check
- Question 1 - Select One or More
To draw a frequency polygon we need ______of the class interval of x-axis and frequency of the respective class for y-axis.
Aupper limitBlower limitCclass-markDrange - Question 2 - Select One
A magnetic needle vibrates in a vertical plane parallel to the magnetic meridlian about a horizontal axis passing through its centre. Its frequency is t. If the plane of oscillation is turned about a vertical axis by 90∘, the frequency of oscillation in vertical plane will be :
AπBzeroCless than πDmore than π
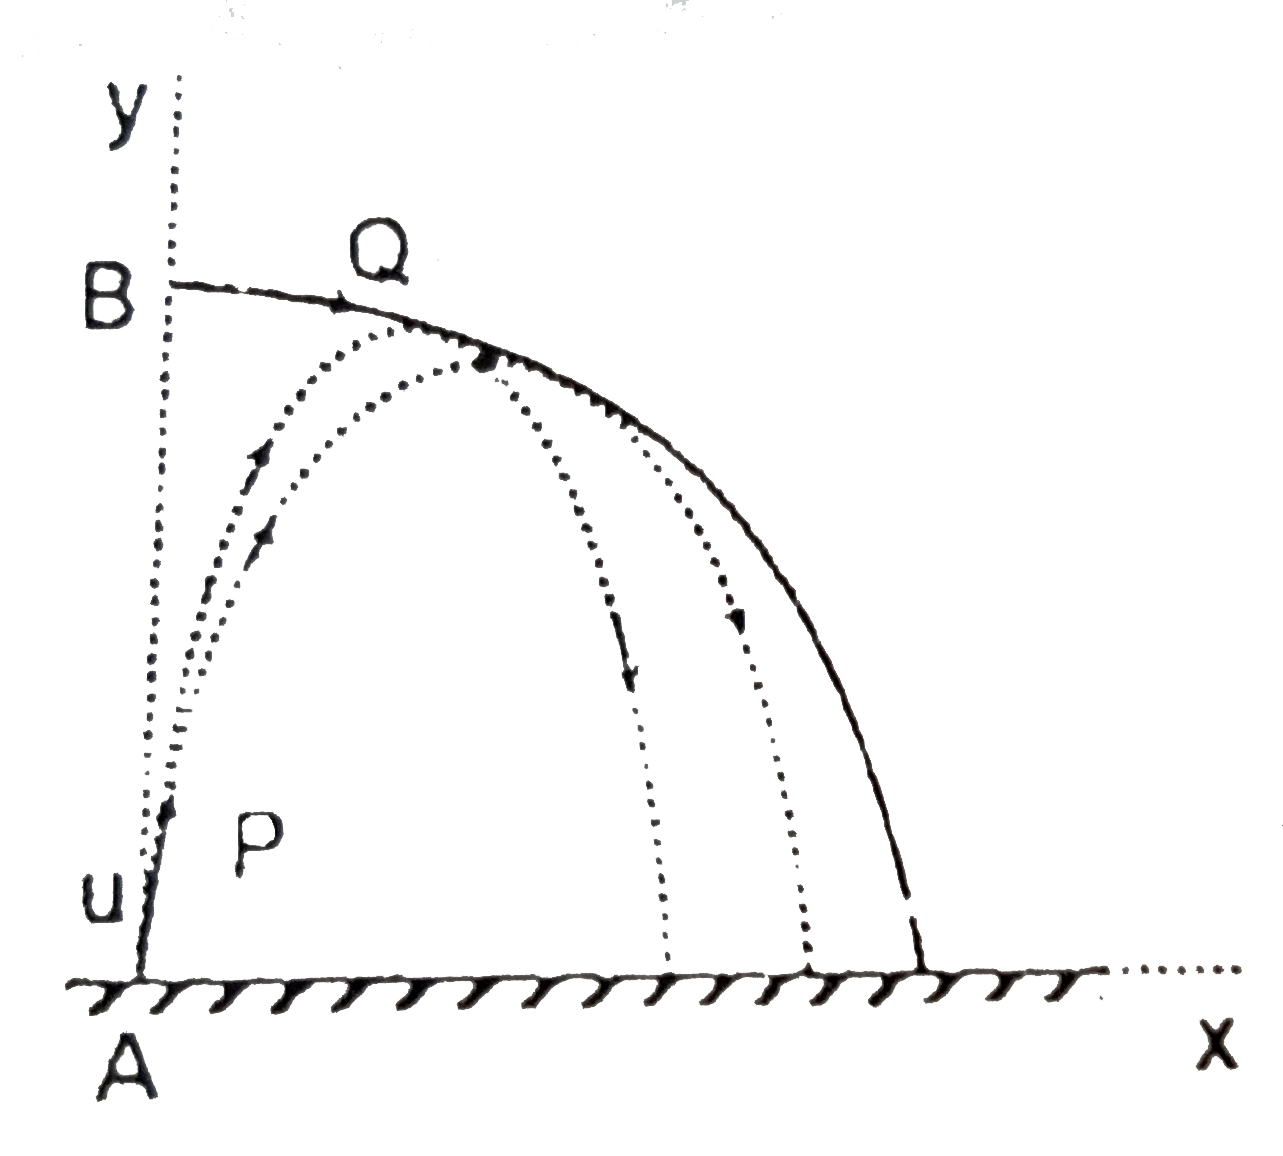
A particle P is to be projected from a fixed point A on the ground with a fixed speed u. Another particle Q is also to be projected from a point B which is directly above the point A. The trajectory of the particle Q touches all possible trajectories (for different angle of projection) of the particle P in the vertical x−y plane. Find the equation of trajectory of the particle Q. (Take the point A as origin, horizontal axis x− axis and vertical axis y−axis Consider the figure.)
 View Solution
Observe the toothpick pattern given below:

(a) Imagine that this pattern continues. Complete the table to show the number of toothpicks in the first six terms.

(b) Make a graph by taking the pattern numbers on the horizontal axis and the number of toothpicks on the vertical axis. Make the horizontal axis from 0 to 10 and the vertical axis from 0 to 30.
(c) Use your graph to predict the number of toothpicks in patterns 7 and 8. Check your answers by actually drawing them.
(d) Would it make sense to join the points on this graph? Explain.View SolutionIn a histogram the class intervals or the groups are taken along (a)Y-axis (b) X-axis (c)both of X-axis and Y-axis (d) in between X and Y axis
View SolutionRepresent EM waves propagating along the x-axis in which electric and magnetic fields are along y-axis and z-axis respectively
View SolutionAn object whose density is Pob falls from a certain height into a liquid whose density is pliq In the figure the potential energy W of the object is plotted along the vertical axis and the position of the object (its altitude) is plotted along the horizontal axis. The potential energy of the object at the level of the liquid is taken zero and the positive direction of the vertical axis (the W axis) is the one pointing upward from the liquid's surface. Determine which of the five straight lines, 1−5, corresponds to an object with the highest density and which to an object with the lowest density. Is there a straight line among these five for which Pob=(112)Pliq ? The arrows on the straight lines point in the direction of motion of the object.
View SolutionAn object is projected with velocity →v0=15ˆj+20ˆj . Considering x along horizontal axis and y along vertical axis. Find its velocity after 2s.
View Solution

