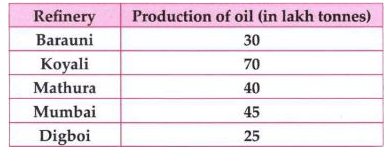
The production of oil (in lakh tonnes) in some of the refineries in India during 1982 was given below: Refinery, Barauni, Koyali, Mathura, Mumbai, Florida Production of oil (in lakh tonnes), 30, 70, 40, 45, 25 Construct a bar graph to represent the above data so that the bars are drawn horizontally.
To construct a horizontal bar graph representing the production of oil in lakh tonnes from various refineries, follow these steps:
1. Gather the Data:
- Refineries: Barauni, Koyali, Mathura, Mumbai, Florida
- Production (in lakh tonnes): 30, 70, 40, 45, 25
2. Draw the Axes:
- Draw a horizontal line (X-axis) and a vertical line (Y-axis).
- Label the X-axis as "Refineries" and the Y-axis as "Production of Oil (in lakh tonnes)".
3. Determine the Scale for the Y-axis:
- Since the highest production is 70 lakh tonnes, choose a suitable scale for the Y-axis. For example, you can use increments of 10 lakh tonnes.
4. Label the Y-axis:
- Mark the Y-axis with values: 0, 10, 20, 30, 40, 50, 60, 70, 80.
5. Plot the Bars:
- For each refinery, draw a horizontal bar corresponding to its production:
- Barauni: Draw a bar that reaches up to 30 on the Y-axis.
- Koyali: Draw a bar that reaches up to 70 on the Y-axis.
- Mathura: Draw a bar that reaches up to 40 on the Y-axis.
- Mumbai: Draw a bar that reaches up to 45 on the Y-axis.
- Florida: Draw a bar that reaches up to 25 on the Y-axis.
6. Label Each Bar:
- At the end of each bar, write the name of the refinery and the corresponding production value.
7. Final Touches:
- Ensure all bars are of equal width and clearly visible.
- Add a title to the graph, such as "Production of Oil in Refineries (1982)".
- Refineries: Barauni, Koyali, Mathura, Mumbai, Florida
- Production (in lakh tonnes): 30, 70, 40, 45, 25
- Draw a horizontal line (X-axis) and a vertical line (Y-axis).
- Label the X-axis as "Refineries" and the Y-axis as "Production of Oil (in lakh tonnes)".
- Since the highest production is 70 lakh tonnes, choose a suitable scale for the Y-axis. For example, you can use increments of 10 lakh tonnes.
- Mark the Y-axis with values: 0, 10, 20, 30, 40, 50, 60, 70, 80.
- For each refinery, draw a horizontal bar corresponding to its production:
- Barauni: Draw a bar that reaches up to 30 on the Y-axis.
- Koyali: Draw a bar that reaches up to 70 on the Y-axis.
- Mathura: Draw a bar that reaches up to 40 on the Y-axis.
- Mumbai: Draw a bar that reaches up to 45 on the Y-axis.
- Florida: Draw a bar that reaches up to 25 on the Y-axis.
- At the end of each bar, write the name of the refinery and the corresponding production value.
- Ensure all bars are of equal width and clearly visible.
- Add a title to the graph, such as "Production of Oil in Refineries (1982)".
Topper's Solved these Questions
Similar Questions
The production of oil (in lakh tonnes) in some of the refineries in India during 2008 is given below :

Construct a bar graph to represent the above data
View SolutionThe production of saleable steel in some of the steel plants of our country during 1999 is given below: Plant, Bhilai, Durgapur, Rourkela, Bokaro Production (in thousand tonnes), 160, 80, 200, 150 Construct a bar graph to represent the above data on a graph paper by using the scale 1 big divisions = 20 thousand and tonnes.
View Solution
Knowledge Check
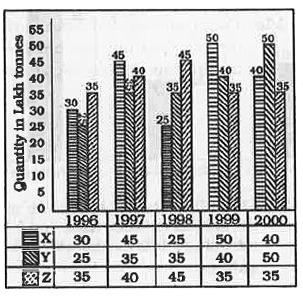
The bar graph provided below gives the data of the production of paper (in lakh tonnes) by three different companies X, Y and Z over the years. Study the bar chart and answer the following questions.

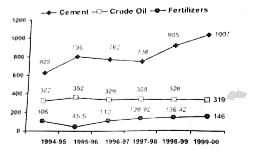
The ratio of the average production of company X in the production of company X in the period 1998-2000 to the average production of company Y in the same period is :A27:29B23:25C25:26D24:27Study the following graph carefully to answer the questions given below.

What is the difference between the average cement production and the average crude oil production during the given years (in lakh tonnes)?A474B460C560D469
The population of four major cities in India in a particular year is given below: City: Mumbai Kolkata Delhi Chennai No. of Students: 120 130 150 80 Construct a bar graph to represent the above data.
View SolutionThe population of four major cities in India in a particular year is given below: City, Mumbai, Kolkata, Delhi, Chennai No. of Students, 120, 130, 150, 80 Construct a bar graph to represent the above data.
View SolutionDirections (Questions 21-26): The bar graph given below gives the data of the production of paper (in lakh tonnes) by three different companies X, Y and Z over last 5 years. Study the graph carefully and answer the questions that follow. Production of Paper (in lakh tons) By Companies X, Y and Z over the Years (FIGURE) What is the difference between the production of Company Z in 2008 and Company Y in 2006? (a) 2 lakh tons (b) 20 lakh tons (c) 20 thousand tons (d) 200 lakh tons (e) None of these
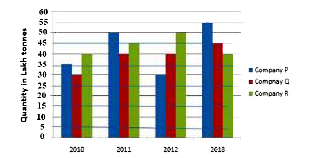
View SolutionThe bar graph given below shows the data of the production of paper (in lakh tonnes) by three different companies P, Q and R over the years.

What is the percentage increase in the productionby company Q from 2010 to 2013?
View SolutionThe following data gives the production of food grains (in thousand tonnes) for some years: Year 1995 1996 1997 1998 1999 2000 Production (in thousand tonnes) 120 150 140 180 170 190 Represent the above data with the help of a bar graph.
View SolutionIn a school, there are five sections of class IX. The number of students in each section is given below. Construct a bar graph representing this data: Section: A B C D E No. of Students 40 48 52 45 30
View Solution
