Draw a pie-diagram for the following data of expenditure pattern in a family: Items, Food, Clothing, Rent, Education, Unforessen events, Midicine Expenditure (in percent), 40%, 20%, 10%, 10%, 15%, 5%
To draw a pie diagram (or pie chart) for the given data on expenditure patterns in a family, we need to follow these steps:
Step 1: Understand the Data
We have the following items and their corresponding expenditures in percentages:
- Food: 40%
- Clothing: 20%
- Rent: 10%
- Education: 10%
- Unforeseen Events: 15%
- Medicine: 5%
Step 2: Convert Percentages to Angles
Since a pie chart represents a circle of 360 degrees, we need to convert each percentage into an angle using the formula:
Angle=(Percentage100)×360
Calculating Angles:
1. Food:
Angle=(40100)×360=144∘
2. Clothing:
Angle=(20100)×360=72∘
3. Rent:
Angle=(10100)×360=36∘
4. Education:
Angle=(10100)×360=36∘
5. Unforeseen Events:
Angle=(15100)×360=54∘
6. Medicine:
Angle=(5100)×360=18∘
Step 3: Summarize the Angles
Now we summarize the angles for each item:
- Food: 144°
- Clothing: 72°
- Rent: 36°
- Education: 36°
- Unforeseen Events: 54°
- Medicine: 18°
Step 4: Draw the Pie Chart
1. Start by drawing a circle.
2. Use a protractor to measure and draw each angle starting from a point on the circle:
- Draw 144° for Food.
- From the end of the Food section, measure and draw 72° for Clothing.
- Continue this process for Rent (36°), Education (36°), Unforeseen Events (54°), and Medicine (18°).
3. Label each section with the item name and the percentage.
Step 5: Finalize the Chart
Make sure each section is clearly labeled, and you can use different colors for each item to enhance readability.
---
We have the following items and their corresponding expenditures in percentages:
- Food: 40%
- Clothing: 20%
- Rent: 10%
- Education: 10%
- Unforeseen Events: 15%
- Medicine: 5%
Since a pie chart represents a circle of 360 degrees, we need to convert each percentage into an angle using the formula:
Angle=(Percentage100)×360
1. Food:
Angle=(40100)×360=144∘
2. Clothing:
Angle=(20100)×360=72∘
3. Rent:
Angle=(10100)×360=36∘
4. Education:
Angle=(10100)×360=36∘
5. Unforeseen Events:
Angle=(15100)×360=54∘
6. Medicine:
Angle=(5100)×360=18∘
Now we summarize the angles for each item:
- Food: 144°
- Clothing: 72°
- Rent: 36°
- Education: 36°
- Unforeseen Events: 54°
- Medicine: 18°
1. Start by drawing a circle.
2. Use a protractor to measure and draw each angle starting from a point on the circle:
- Draw 144° for Food.
- From the end of the Food section, measure and draw 72° for Clothing.
- Continue this process for Rent (36°), Education (36°), Unforeseen Events (54°), and Medicine (18°).
3. Label each section with the item name and the percentage.
Make sure each section is clearly labeled, and you can use different colors for each item to enhance readability.
Topper's Solved these Questions
Similar Questions
Draw a pie-diagram for the following data of expenditure pattern in a family: Items, Food, Clothing, Rent, Edu, Misc. Expenditure (in Rs) 4000, 2000, 1500, 1500, 1000
View SolutionThe following table shows the expenditure incurred by a publisher in publishing a book: Items, Paper, Printing, Binding, Advertishing, Misc. Expenditure (in %), 35%, 20%, 10%, 5%, 30% Present the above data in the form of a pie-chart.
View Solution
Knowledge Check
Following bar diagram shows the monthly expenditure of two families on food, clothing, education, fuel, house rent and miscellaneous (in percentage).
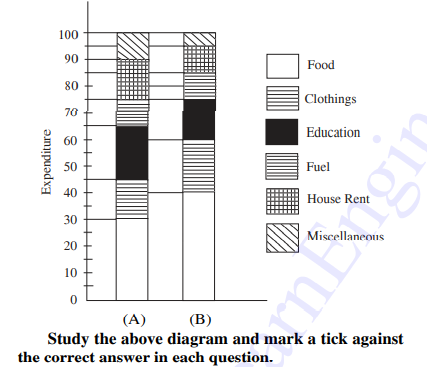
What fraction of the total expenditure is spent on Education in Family A ?A(13)/(20)B2/3C9 / (13)DNone of theseFollowing bar diagram shows the monthly expenditure of two families on food, clothing, education, fuel, house rent and miscellaneous (in percentage).
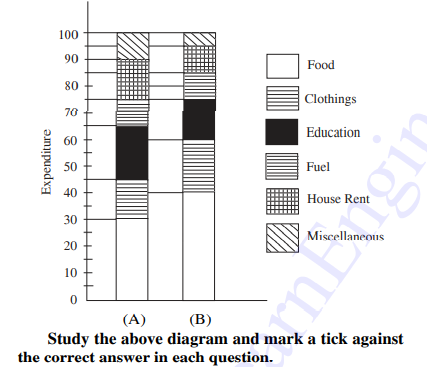
If both the families have the same expenditure, which one spends more on education and miscellaneous together ?AFamily ABFamily BCNoneDBoth equalFollowing bar diagram shows the monthly expenditure of two families on food, clothing, education, fuel, house rent and miscellaneous (in percentage).
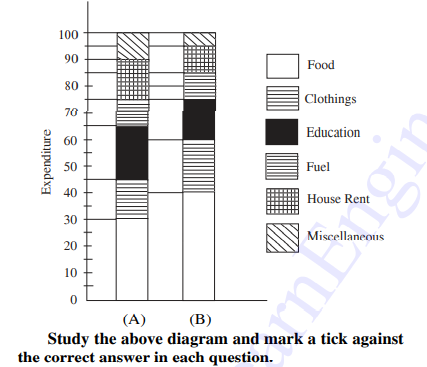
What percentage is B's expenditure on food over A's expenditure on food ? ( Taking equal total expenditure)A10%B70%C13313%D75%
The following pie-chart shows the monthly expenditure of a family on food, house rent clothing, education, fuel and miscellaneous Study the pie-chart
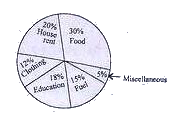
Total percentage of expenditure on house rent, clothing and fuel is greater than the percentage of expenditure on food by
View SolutionThe following table shows how a student spends his pocket money during the course of a month. Represent it by a pie-diagram. Items, Food, Entertainment, Other expenditure, Savings Expenditure, 40%, 25%, 20%, 15%
View SolutionThe following pie-chart shows the monthly expenditure of a family on food, house rent clothing, education, fuel and miscellaneous Study the pie-chart
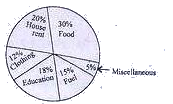
If the percentage of expenditure on food is x % of the total percentage of expenditure on clothing, education and fuel, then x equals
View SolutionThe following table shows the household expenditure of family on different items. Draw a pie chart to represent the given data.
ItemRentFoodClotingEducationOthersExpenditure25%30%10%15%20%
View SolutionA single discount equivalent to a discount seres of 5%, 10% , 15% and 20%, is :
View Solution
