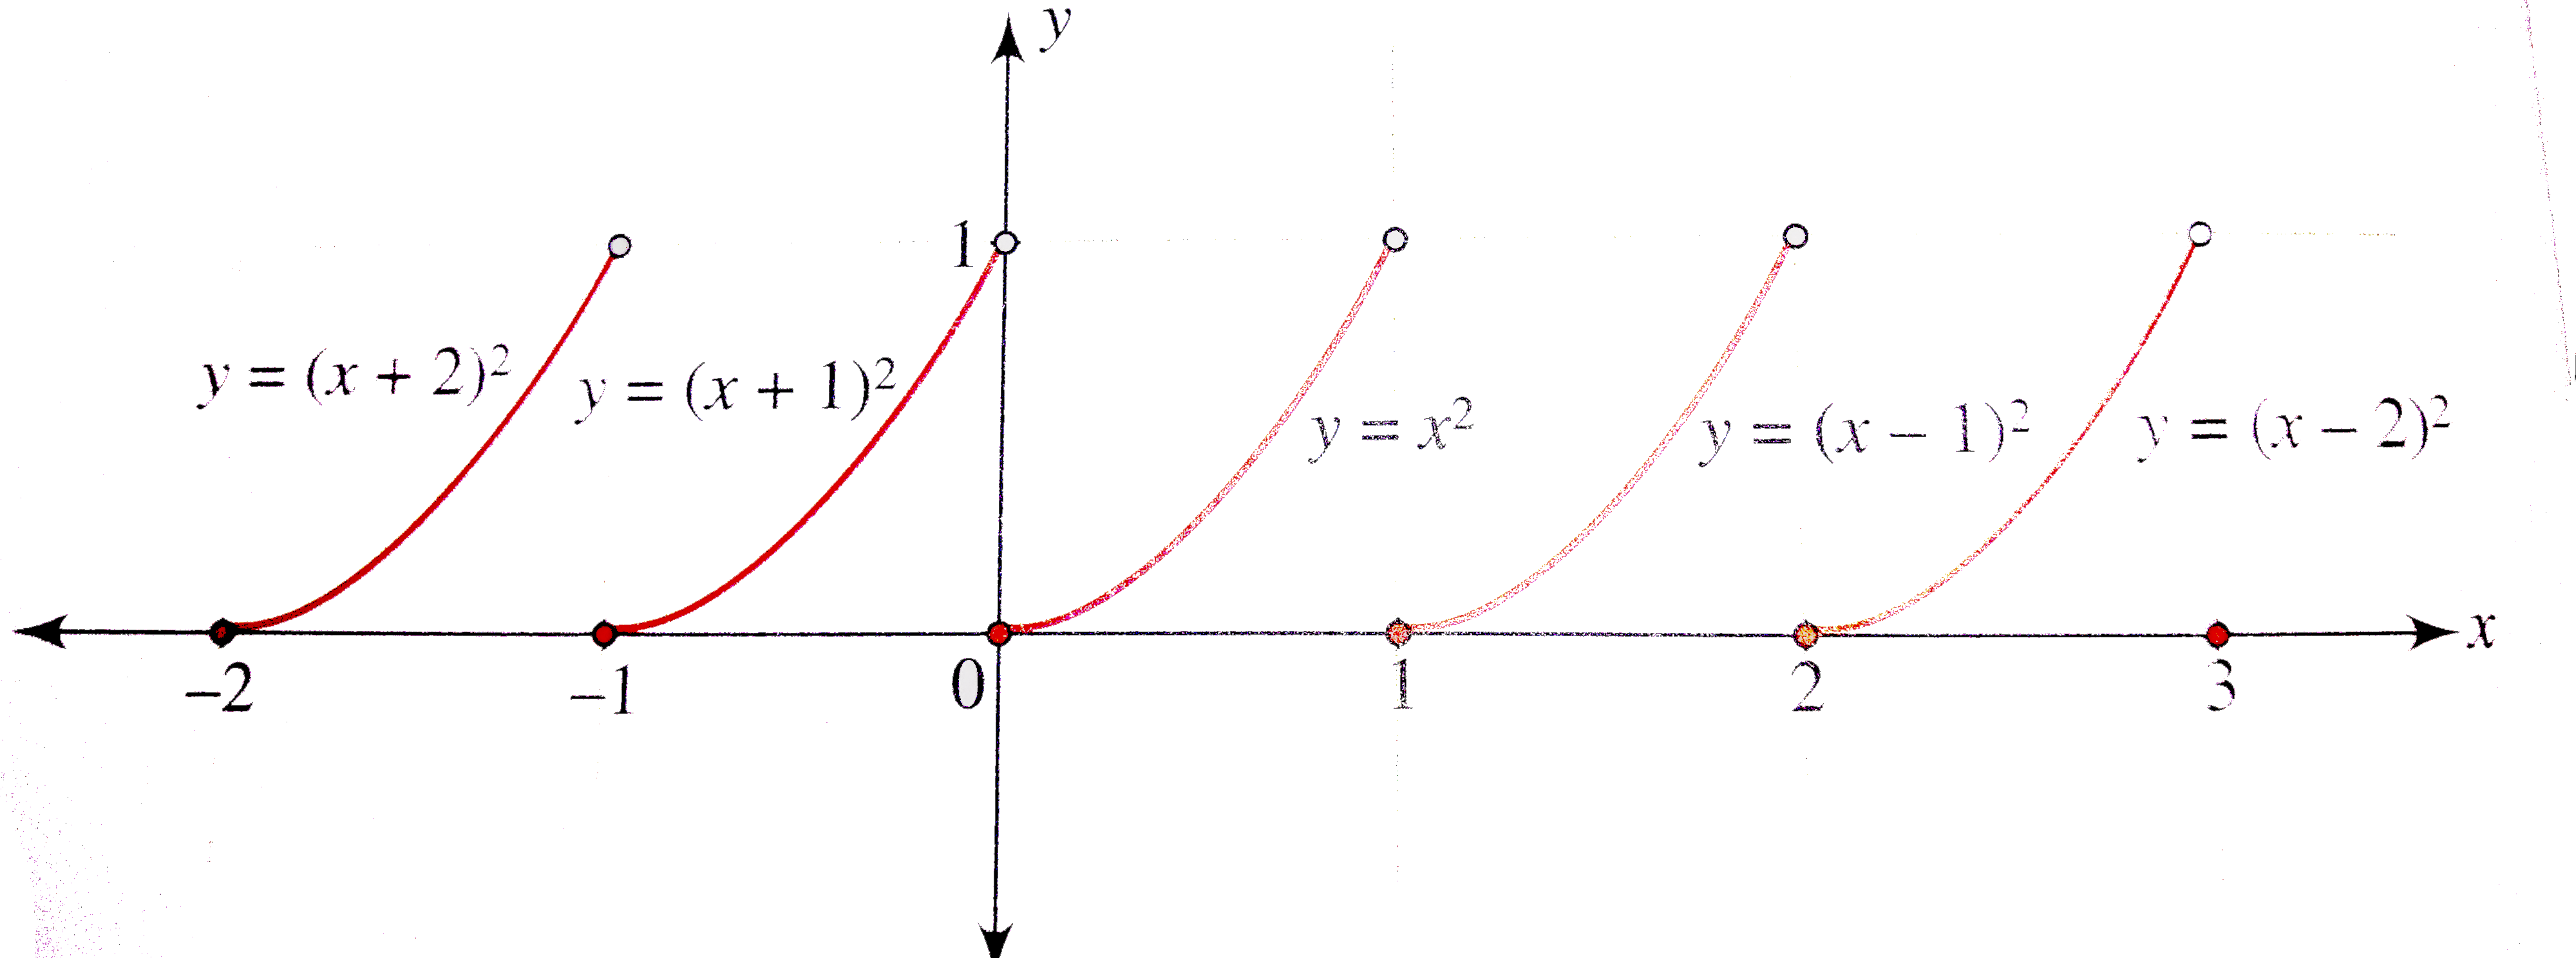
Draw the graph of y={x}2, where [⋅] represents the fractional part function.
We have y=f(x)={x}2
or y=(x−[x])2
Since 0≤{x}<1,0≤{x}2<1.
For 0≤x<1,y=x2, which is a half parabola to the right of the vertex at (0,0).
For 1≤x<2,y=(x−1)2, which is a half parabola to the right of the vertex at (1, 0).
For 2≤x<3,y=(x+1)2, which is a half parabola to the right of the vertex at (2, 0).
For −1≤x<0,y=(x+1)2, which is a half parabola to the right of the vertex at (−1,0), and so on.
The graph of the function is as shown in the following figure.

Topper's Solved these Questions
- GRAPHS OF ELEMENTARY FUNCTIONS Book:CENGAGEChapter:GRAPHS OF ELEMENTARY FUNCTIONS Exercise:Exercise
Explore 34 Videos
- GRAPHS OF POLYNOMIAL AND RATIONAL FUNCTIONSBook:CENGAGEChapter:GRAPHS OF POLYNOMIAL AND RATIONAL FUNCTIONSExercise:Exercise
Explore 13 Videos
- GRAPHS OF TRIGONOMETRIC FUNCTIONSBook:CENGAGEChapter:GRAPHS OF TRIGONOMETRIC FUNCTIONSExercise:Exercise
Explore 22 Videos
Similar Questions
Draw the graph of y=2{x}, where {⋅} represents the fractional part function.
View SolutionDraw the graph of y2={x}, where {⋅} represents the fractional part function.
View SolutionDraw the graph of f(x)={sinx}, where {⋅} represents the fractional part function.
View SolutionDraw the graph of y={|x|}, where {.} represents the fractional part function.
View SolutionDraw the graph of |y|={x}, where {.} represents the fractional part function.
View SolutionDraw the graph of y=|{x}−0.5|, where {.} represents the fractional part function.
View SolutionDraw the graph of f(x)={2x}, where {⋅} represents the fractional part function.
View SolutionDraw the graph of y=cos−1{x}, where {⋅} represetns the fractional part function.
View SolutionDraw the graphs of y=sin−1{x}, where {⋅} resresent the fractional part function.
View SolutionDraw the graph of y=1{x}, where {⋅} denotes the fractional part function.
View Solution