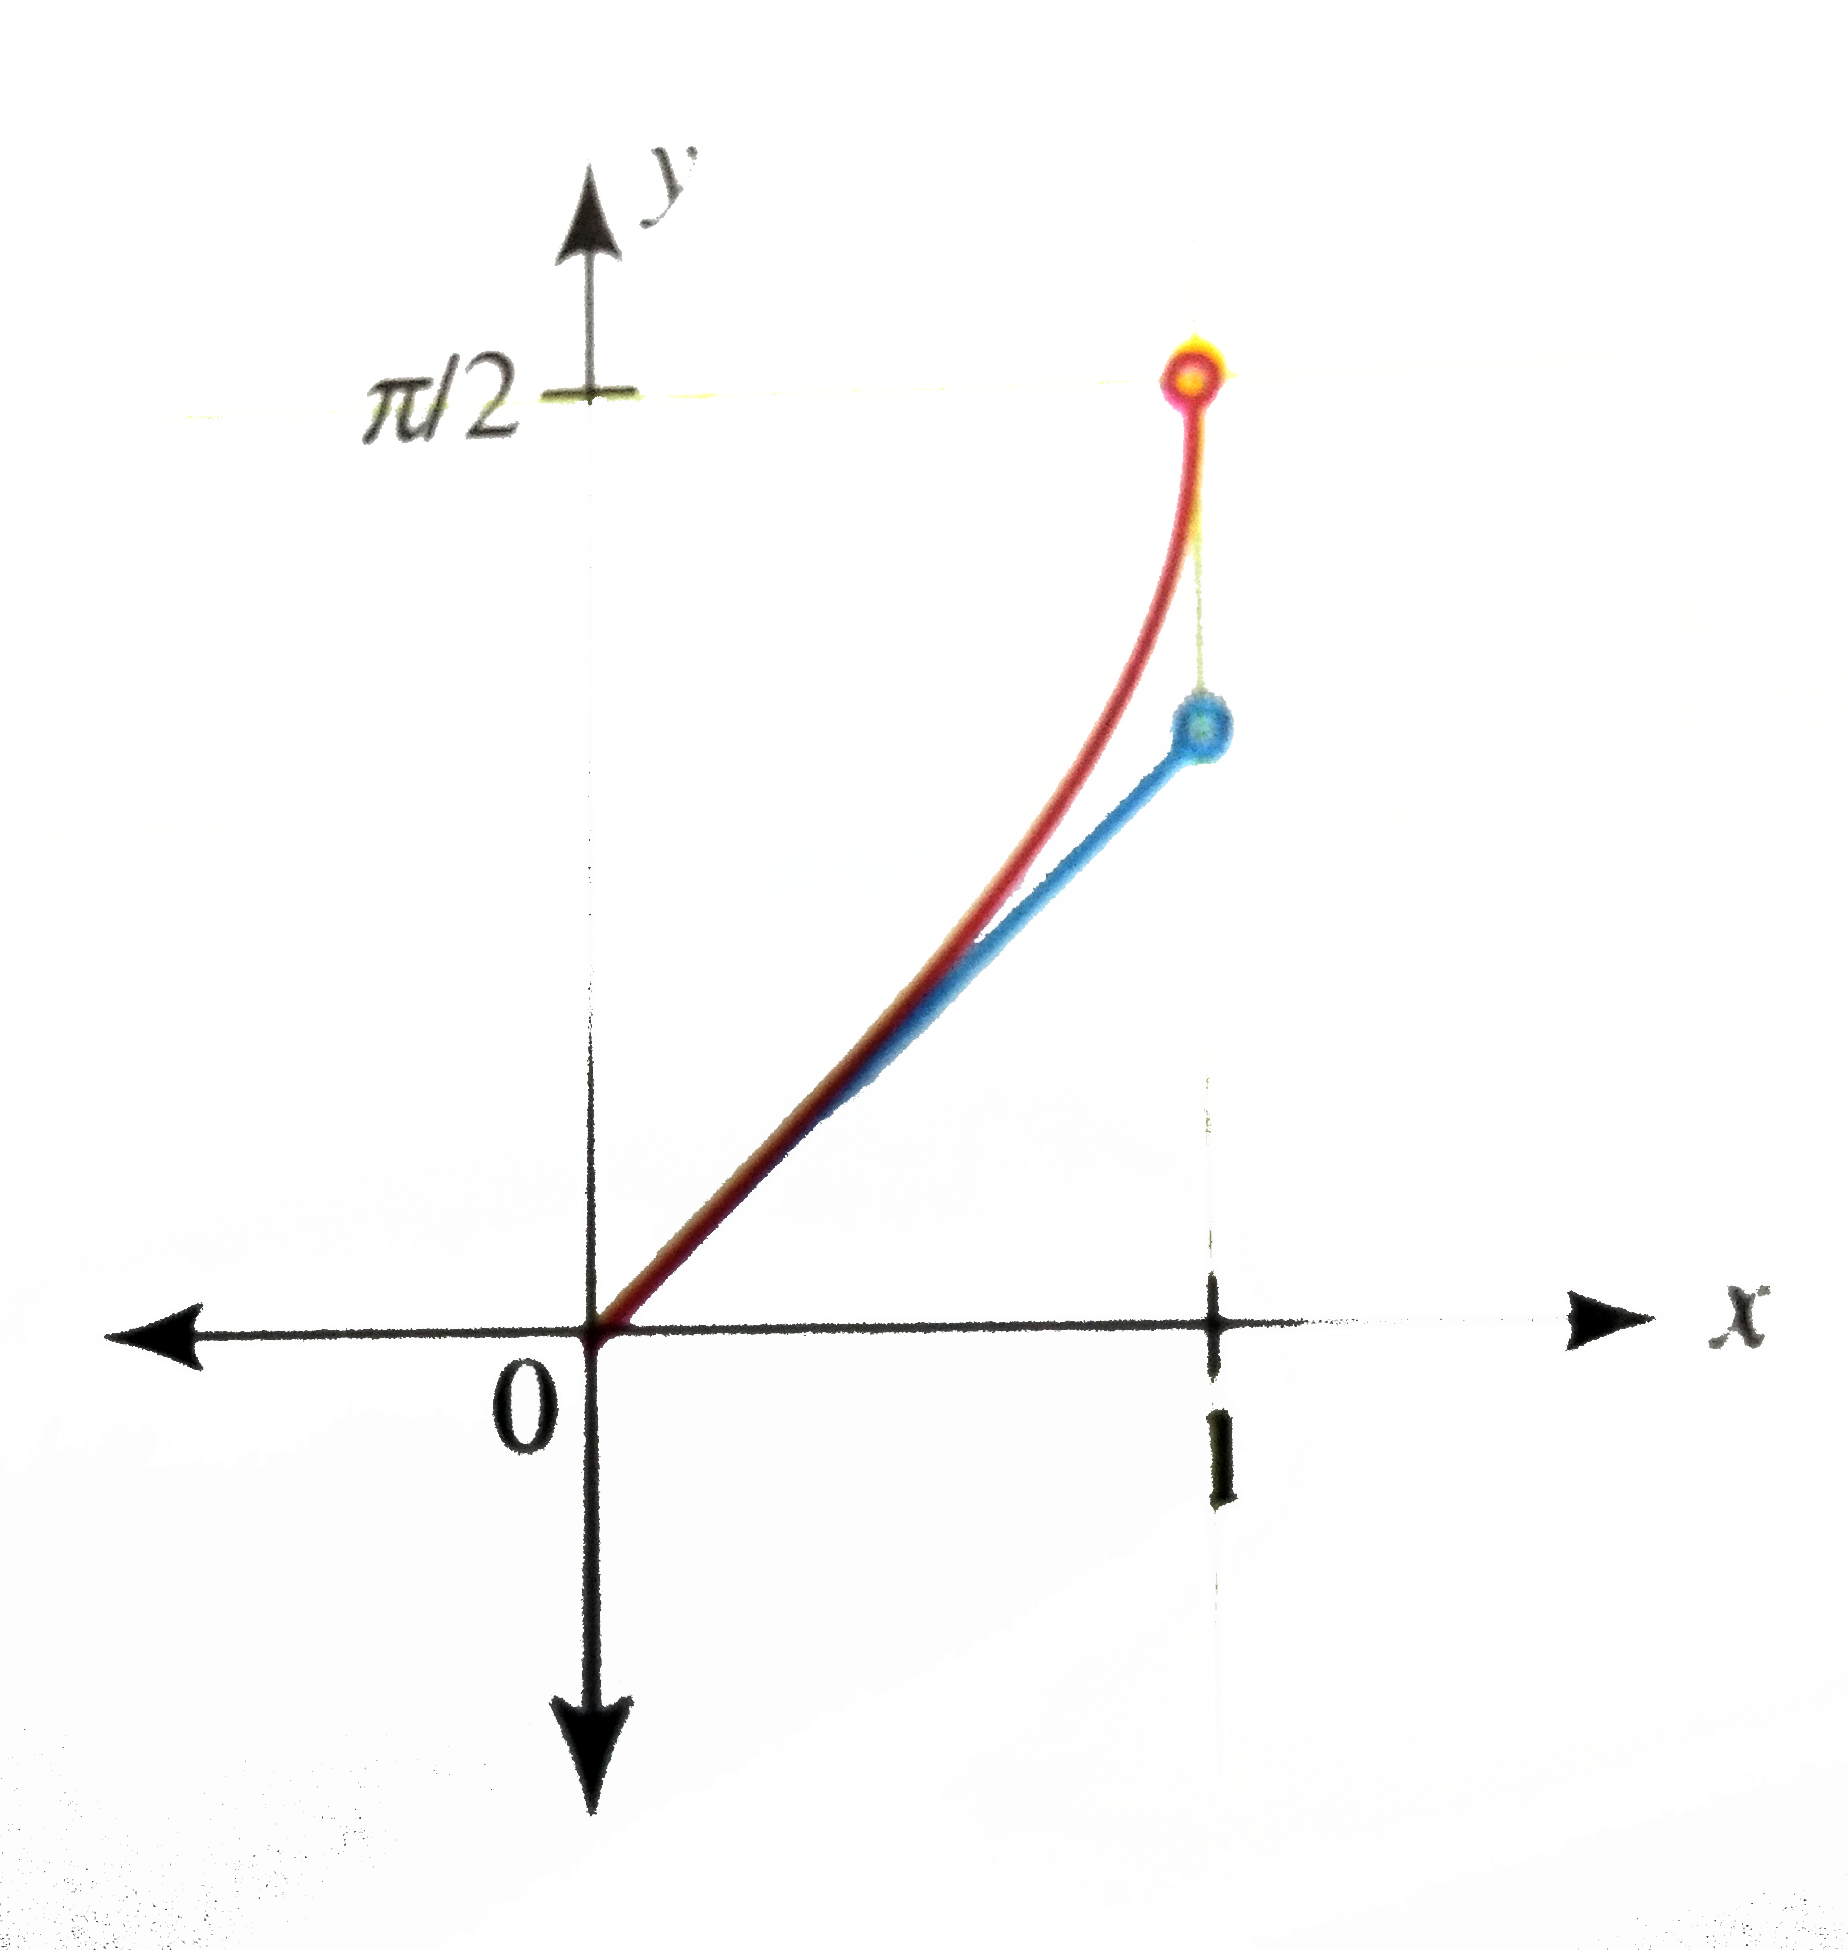
Draw the graphs of y=sin−1{x}, where {⋅} resresent the fractional part function.
Video Solution
Text Solution
We have y=sin−1{x}
{x}∈[0,1)∀x∈R.
Here the domain of the function is R.
0≤{x}<1
∴ 0≤sin−1{x}<π/2
So the range of y=f(x) is [0,π/2).
Now y = f(x) is periodic and has period 'I'.
Also for 0≤x<1,{x}=x∴y=sin−1{x}=sin−1x
Graphs of y = {x} =x and y=sin−1{x}=sin−1x and y=sin−1x for x∈[0,1) are shown in the adjecent figure.
Since the perios of y y =f(x) is 'I', the graph of the function can be drawn by repetitoon of the above graph for each interval (n,n+1),n∈Z


|
Topper's Solved these Questions
- GRAPH OF INVERSE TRIGONOMETRIC FUNCTIONSBOOK - CENGAGECHAPTER - GRAPH OF INVERSE TRIGONOMETRIC FUNCTIONSEXERCISE - Exercise
18 Videos
- GETTING STARTED WITH GRAPHSBOOK - CENGAGECHAPTER - GETTING STARTED WITH GRAPHSEXERCISE - Exercise
18 Videos
- GRAPHICAL TRANSFORMATIONSBOOK - CENGAGECHAPTER - GRAPHICAL TRANSFORMATIONSEXERCISE - Exercise
22 Videos
Similar Questions
Draw the graph of y=cos−1{x}, where {⋅} represetns the fractional part function.
View SolutionDraw the graph of y=sin−1|x|.
View SolutionDraw the graph of y2={x}, where {⋅} represents the fractional part function.
View SolutionDraw the graph of y=2{x}, where {⋅} represents the fractional part function.
View SolutionDraw the graph of f(x)={sinx}, where {⋅} represents the fractional part function.
View SolutionDraw the graph of y=sin3x.
View SolutionDraw the graph of f(x)={2x}, where {⋅} represents the fractional part function.
View SolutionDraw the graph of y=sin−1(sinx)
View SolutionDraw the graph of y=sin−1(x−3).
View SolutionDraw the graph of y=sin−1(x2)
View Solution
