Draw the graph of .Solution in Tamil
Video Solution
Text Solution
We have
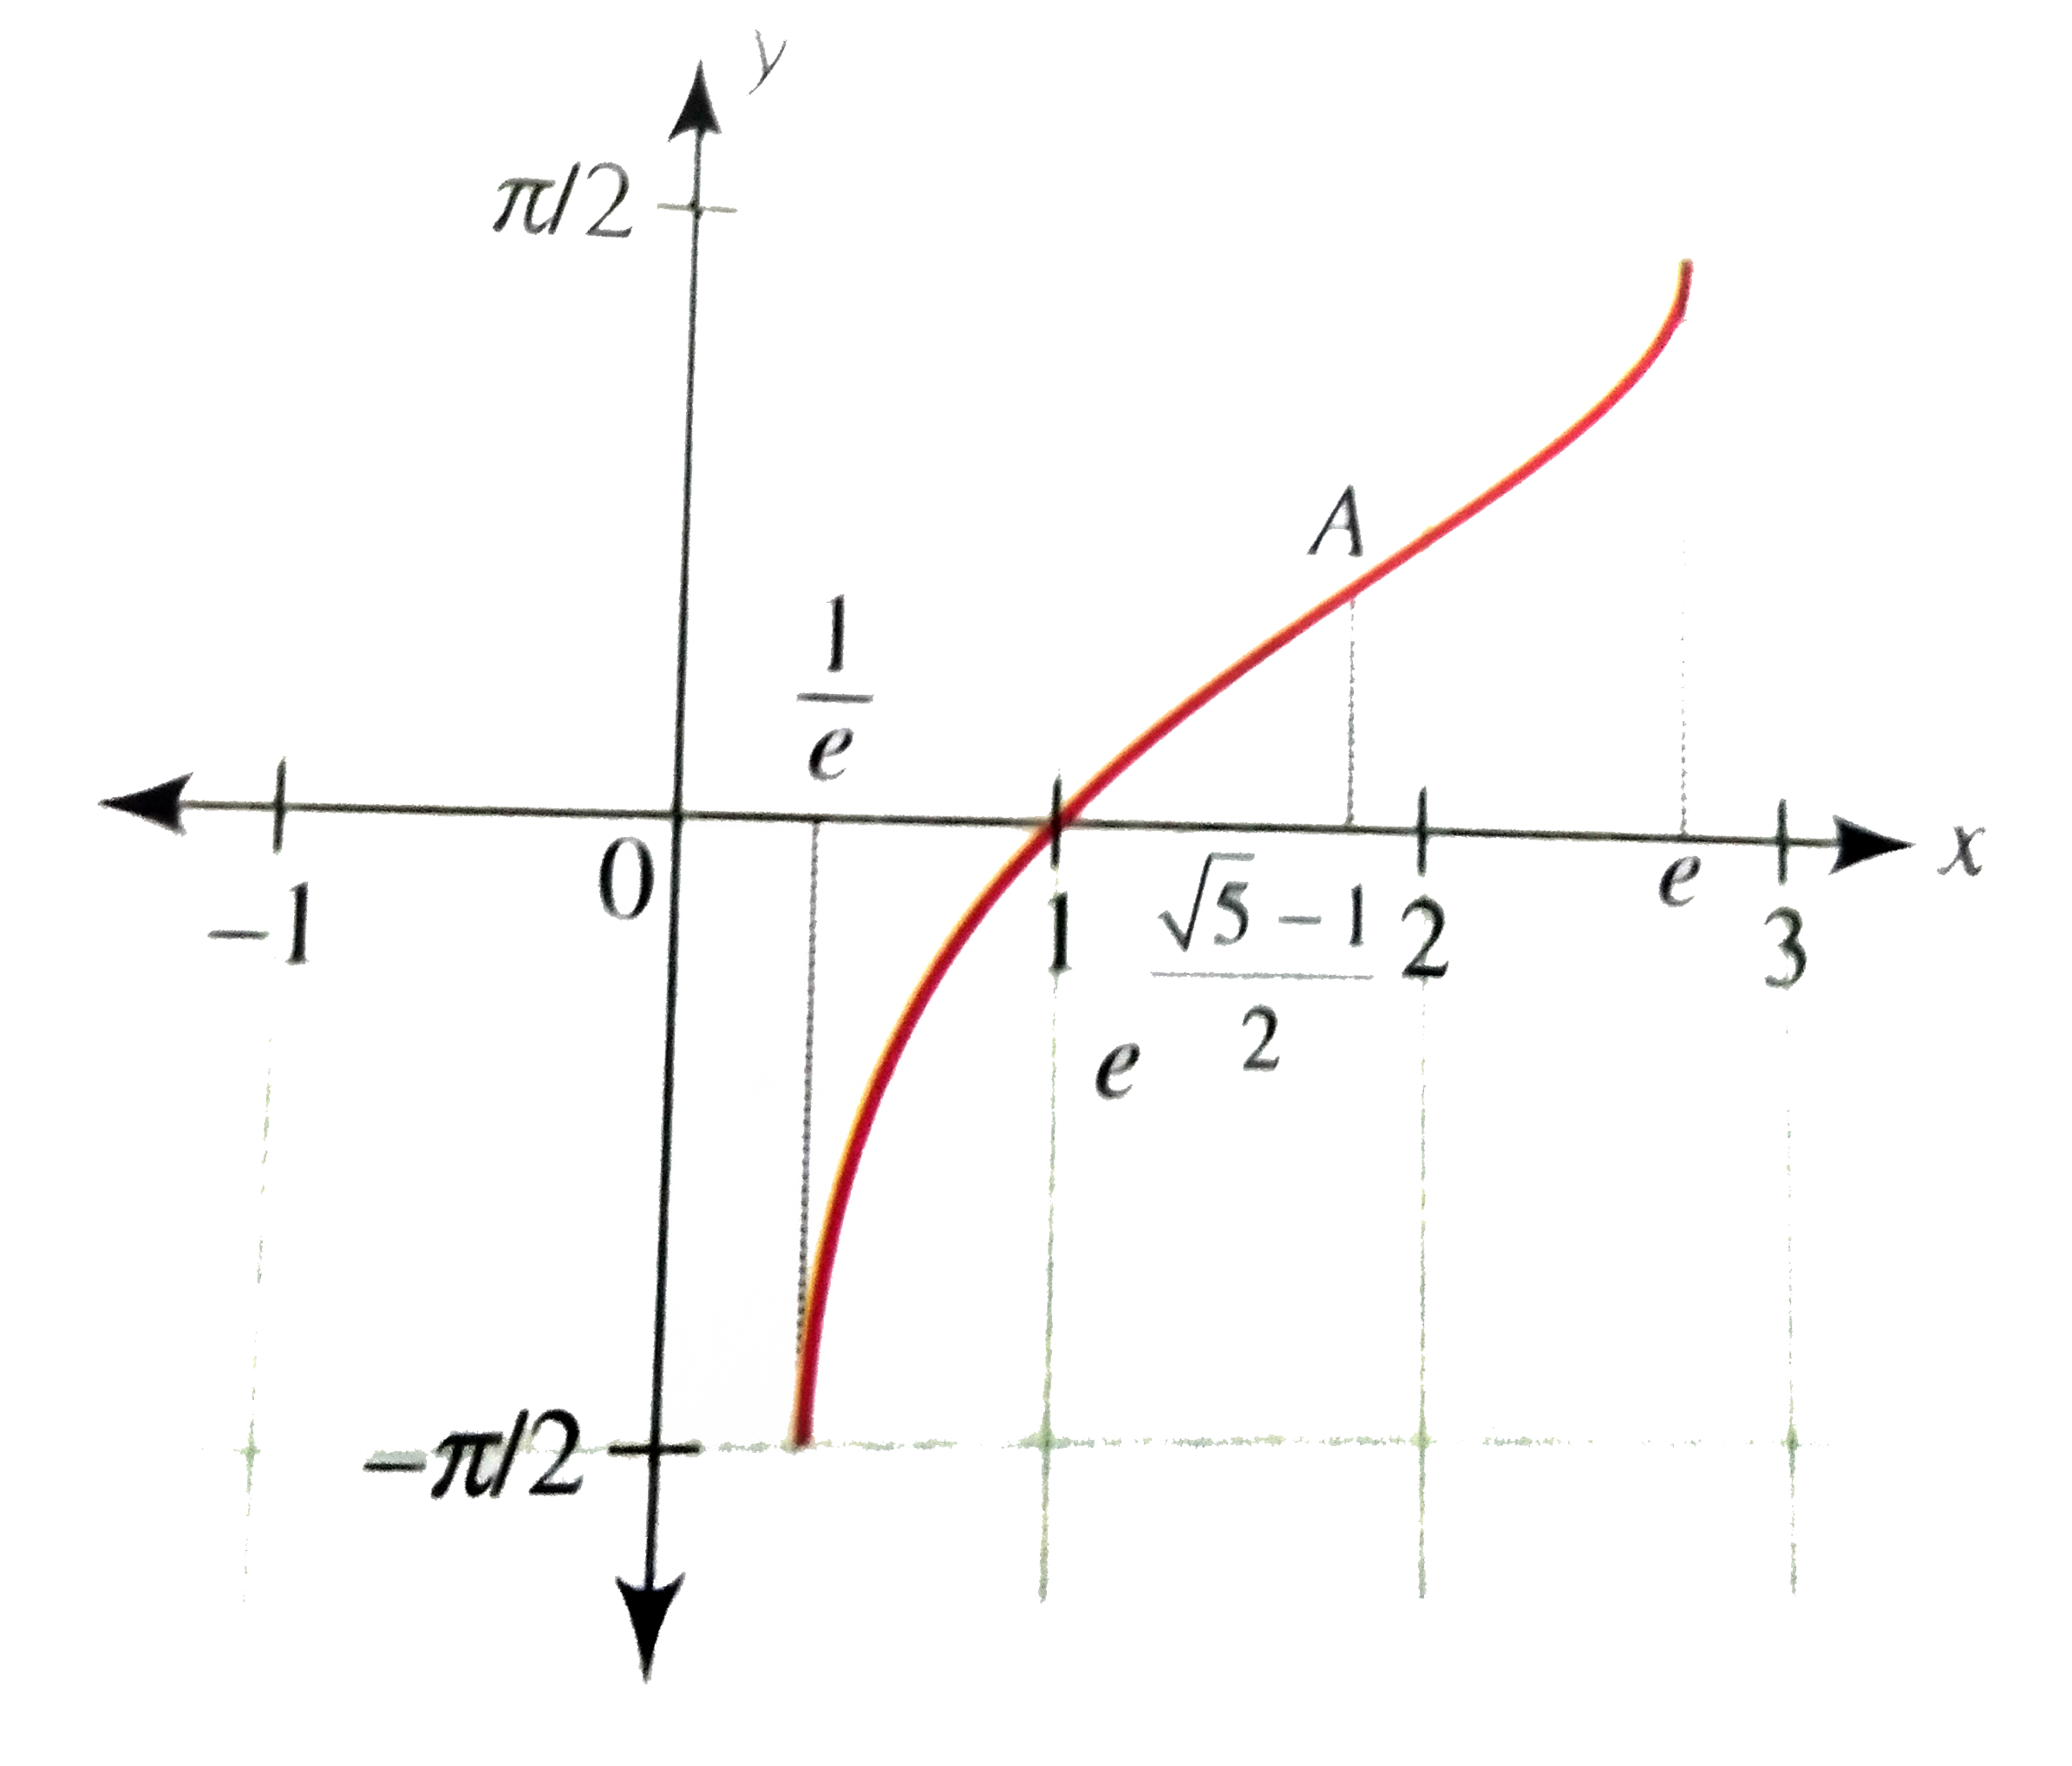
So the graph meets the x-axis at (1,0).
Hence the graph of the function is as shown in the following figure.

In the figure, the graph has his point of infection at point A.
|
Topper's Solved these Questions
- GRAPH OF INVERSE TRIGONOMETRIC FUNCTIONSBOOK - CENGAGECHAPTER - GRAPH OF INVERSE TRIGONOMETRIC FUNCTIONSEXERCISE - Exercise
18 Videos
- GETTING STARTED WITH GRAPHSBOOK - CENGAGECHAPTER - GETTING STARTED WITH GRAPHSEXERCISE - Exercise
18 Videos
- GRAPHICAL TRANSFORMATIONSBOOK - CENGAGECHAPTER - GRAPHICAL TRANSFORMATIONSEXERCISE - Exercise
14 Videos
Similar Questions
Draw the graph of y=tan−1x+cot−1x
View SolutionDoes the following graph pass the vertical or horizontal line test ?

View SolutionDraw the graph of y=tan−1x−cot−1x.
View SolutionDraw the graph of y=sin−1(x−3).
View SolutionDraw the graph of y=sin−1|x|.
View SolutionDraw the graph of y=sin−1x3 and compare wire the graph of y=sin−1x.
View SolutionDraw the graph of y=sin−1(sinx)
View SolutionDraw the graph of y=sin−1,1x
View SolutionDraw the graph of y=sin−1(x2)
View SolutionDraw the graph of y=sin−1(x−3).
View SolutionDraw the graph of y=sin−1|x|.
View SolutionDraw the graph of y=sin−1x3 and compare wire the graph of y=sin−1x.
View SolutionDraw the graph of y=sin−1(sinx)
View SolutionDraw the graph of y=sin−1,1x
View SolutionDraw the graph of y=sin−1(x2)
View SolutionDraw the graph of y=sin^(-1)(x-3) .
View Solution
