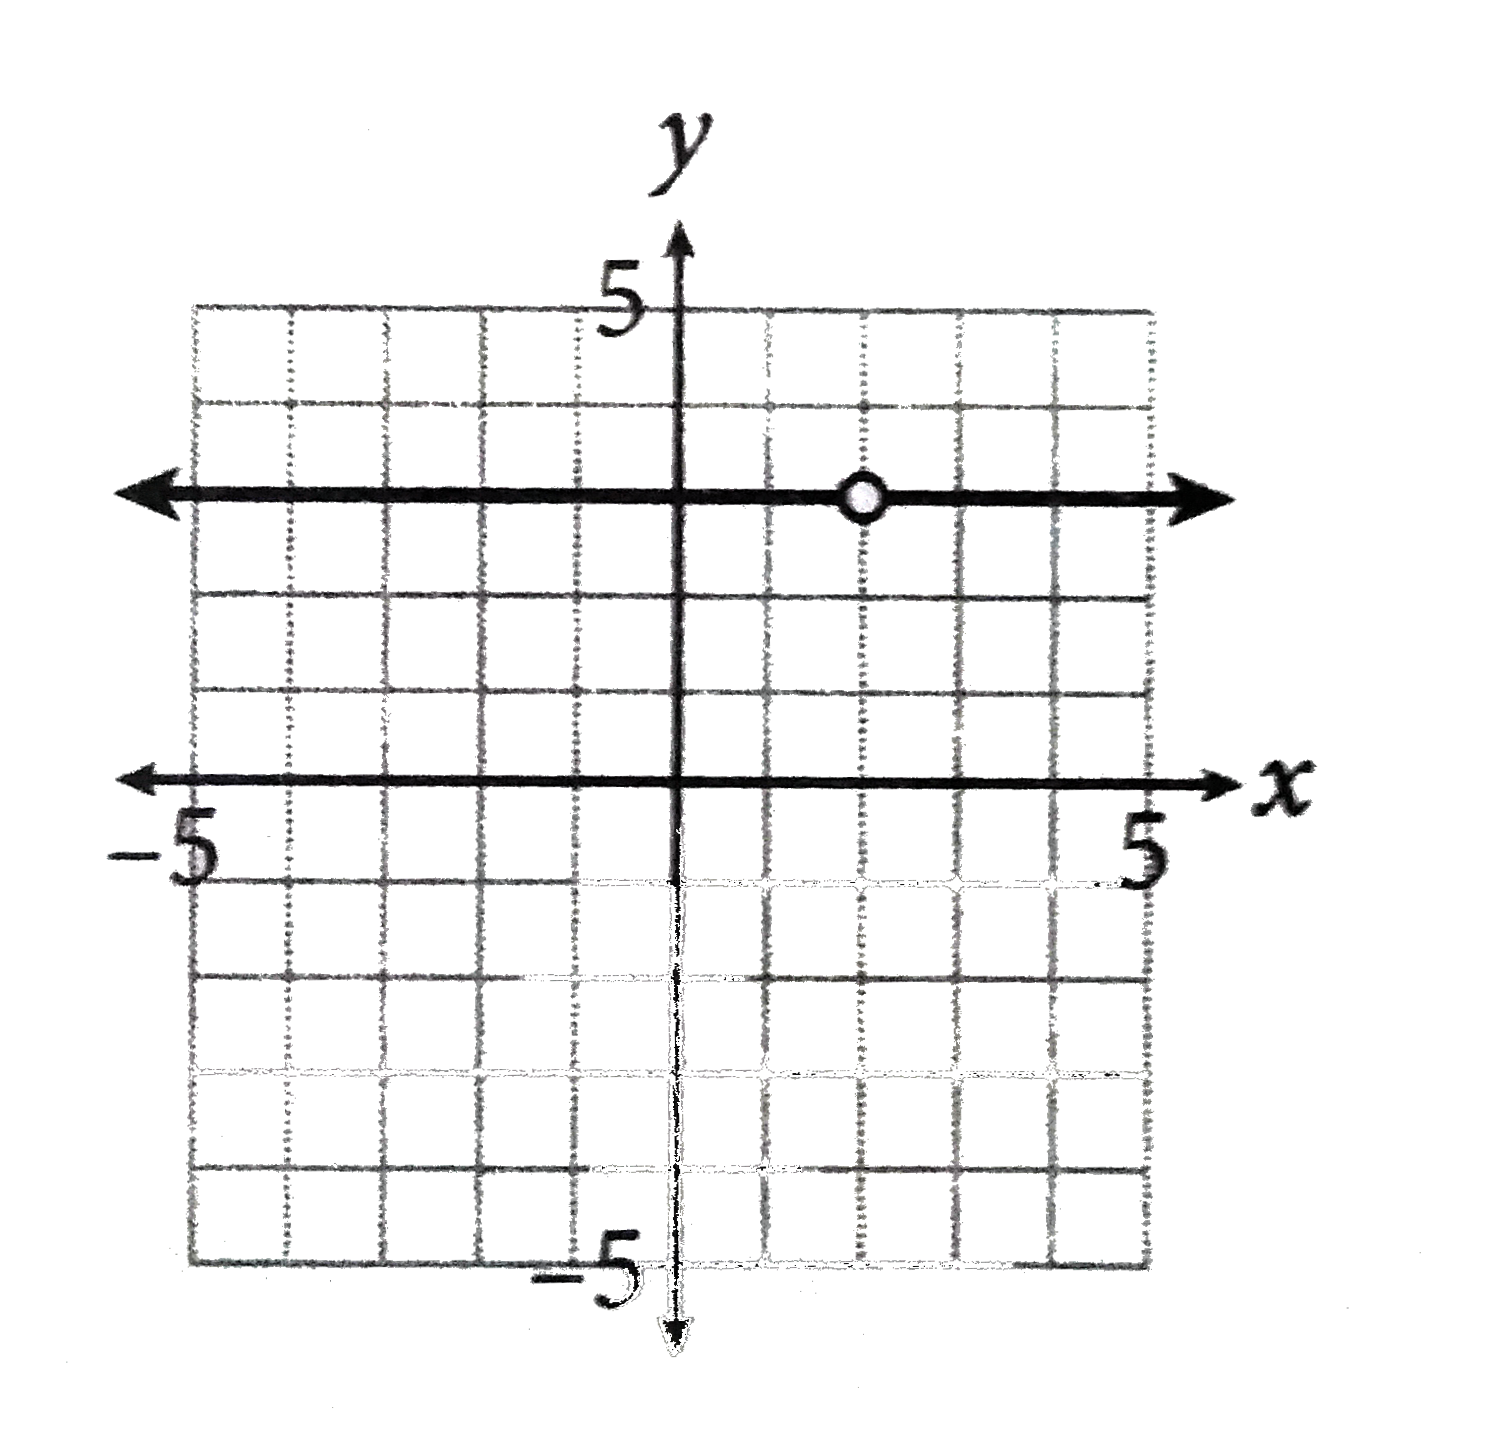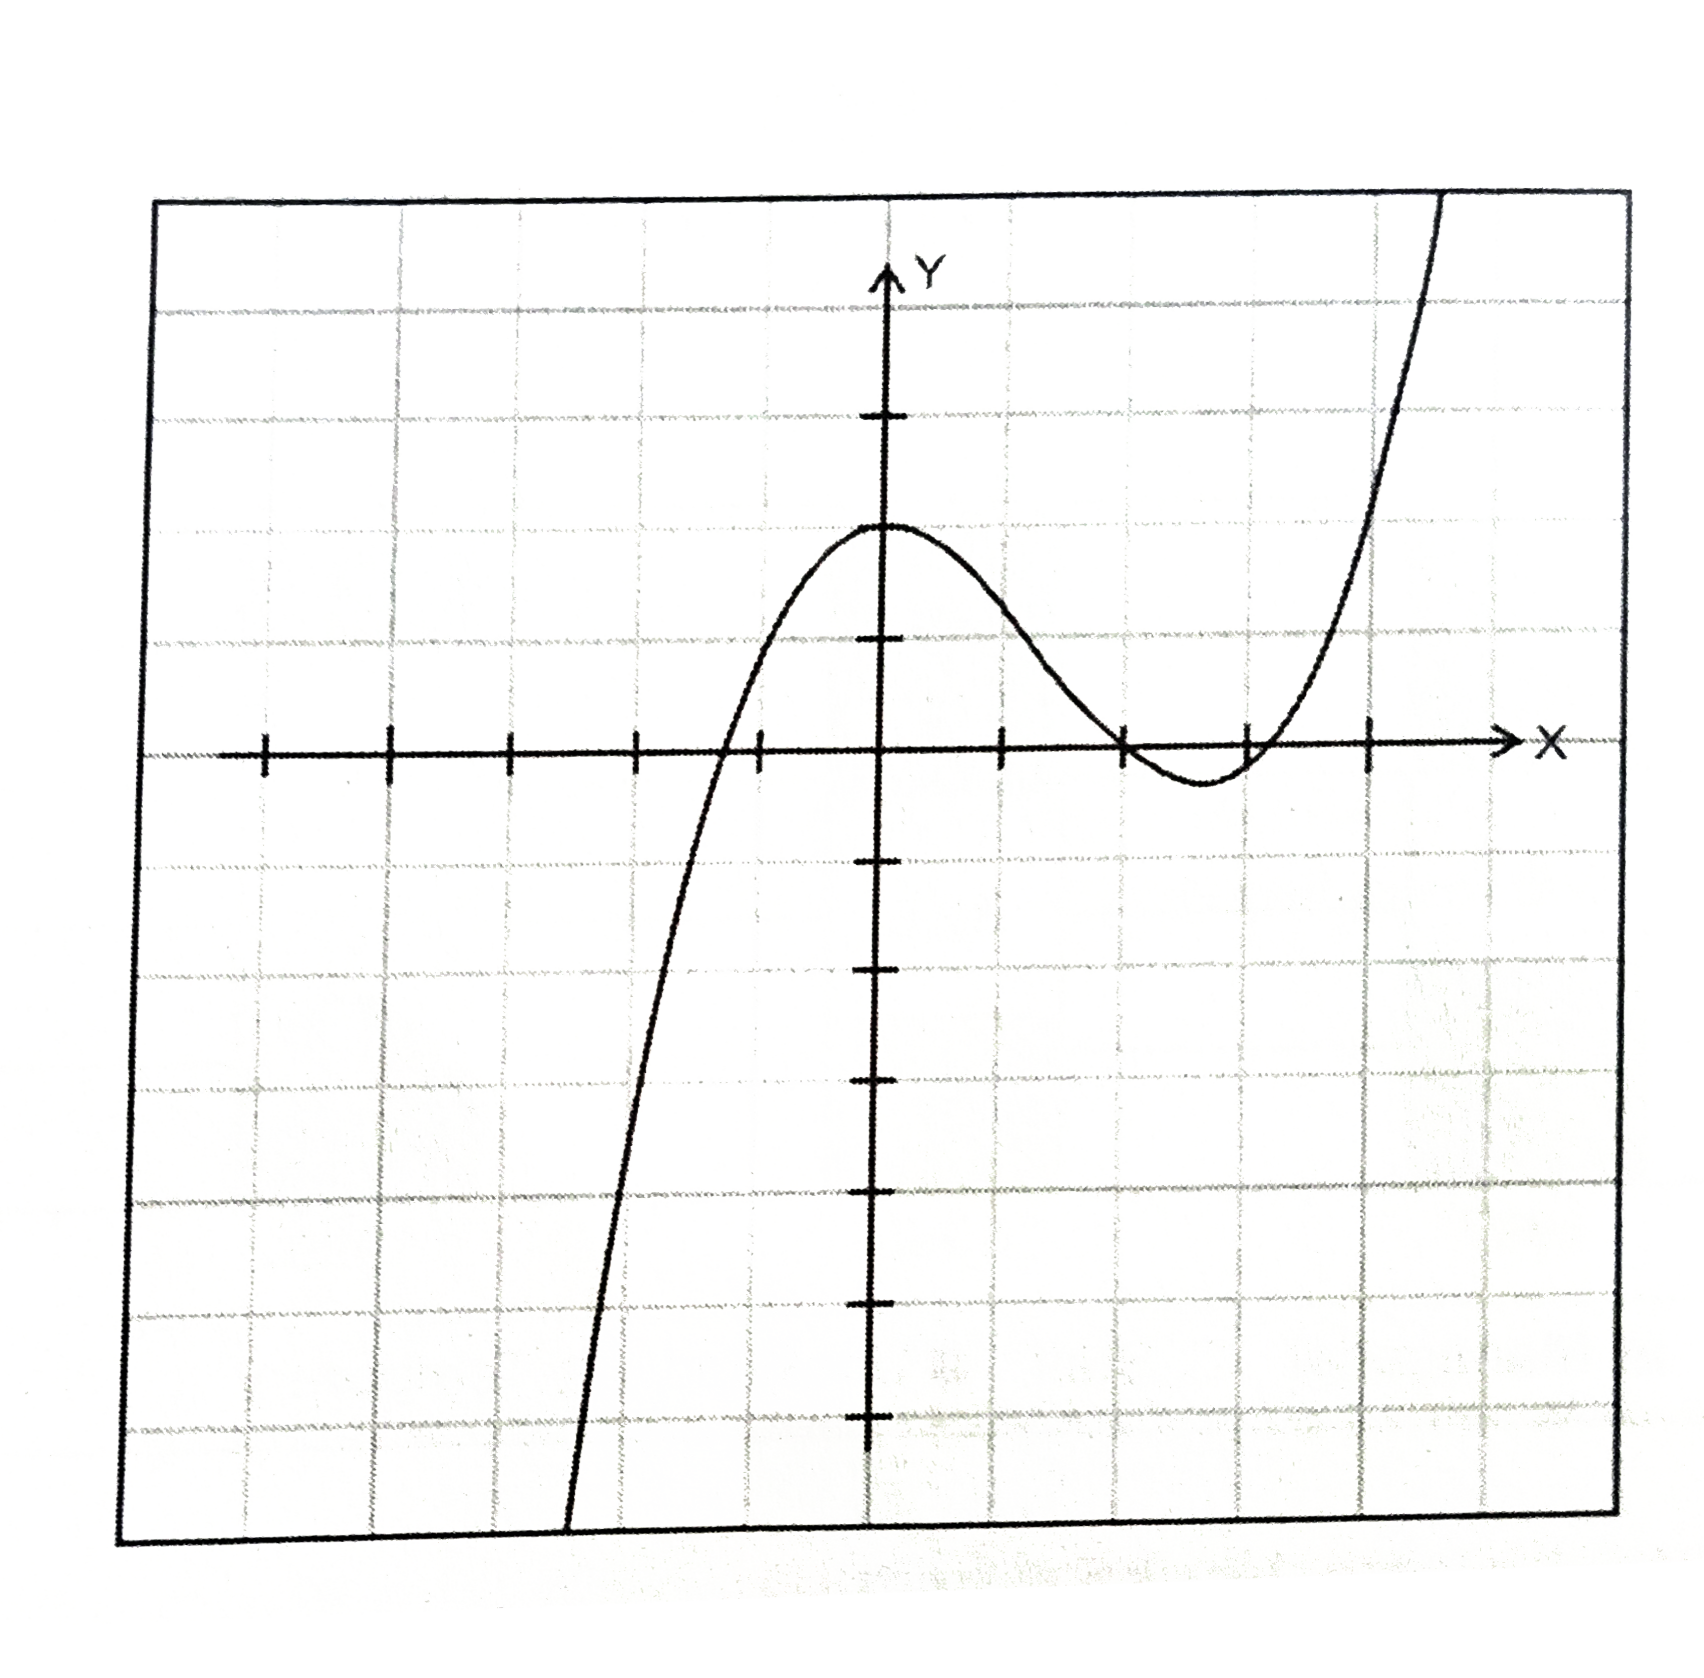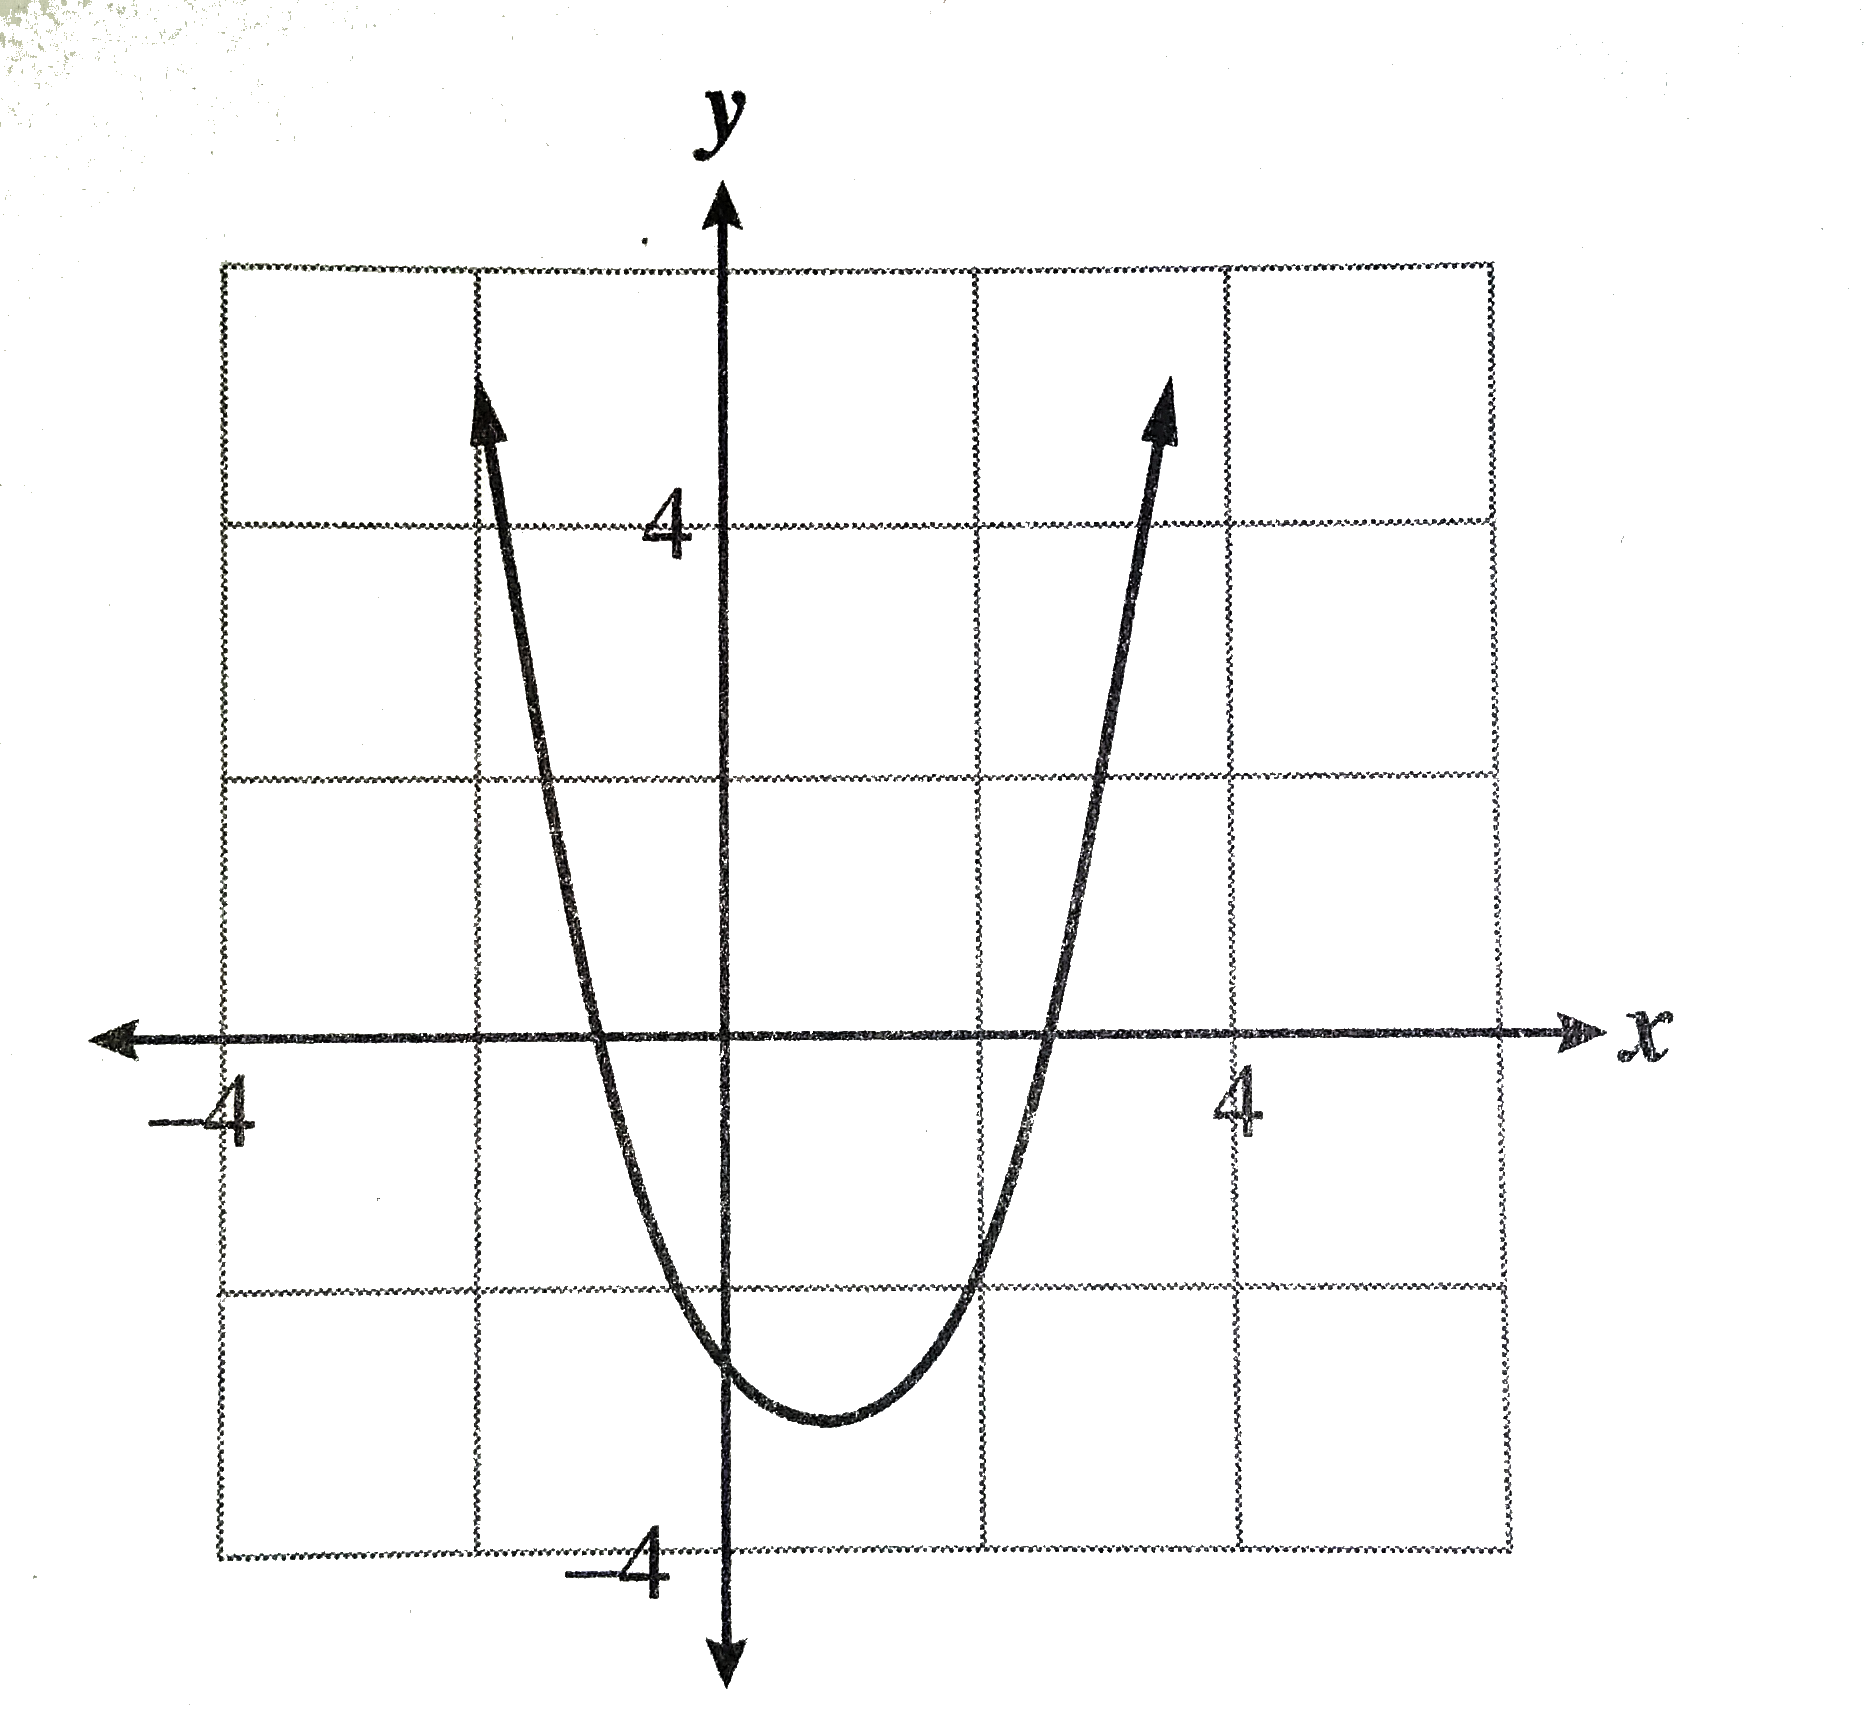
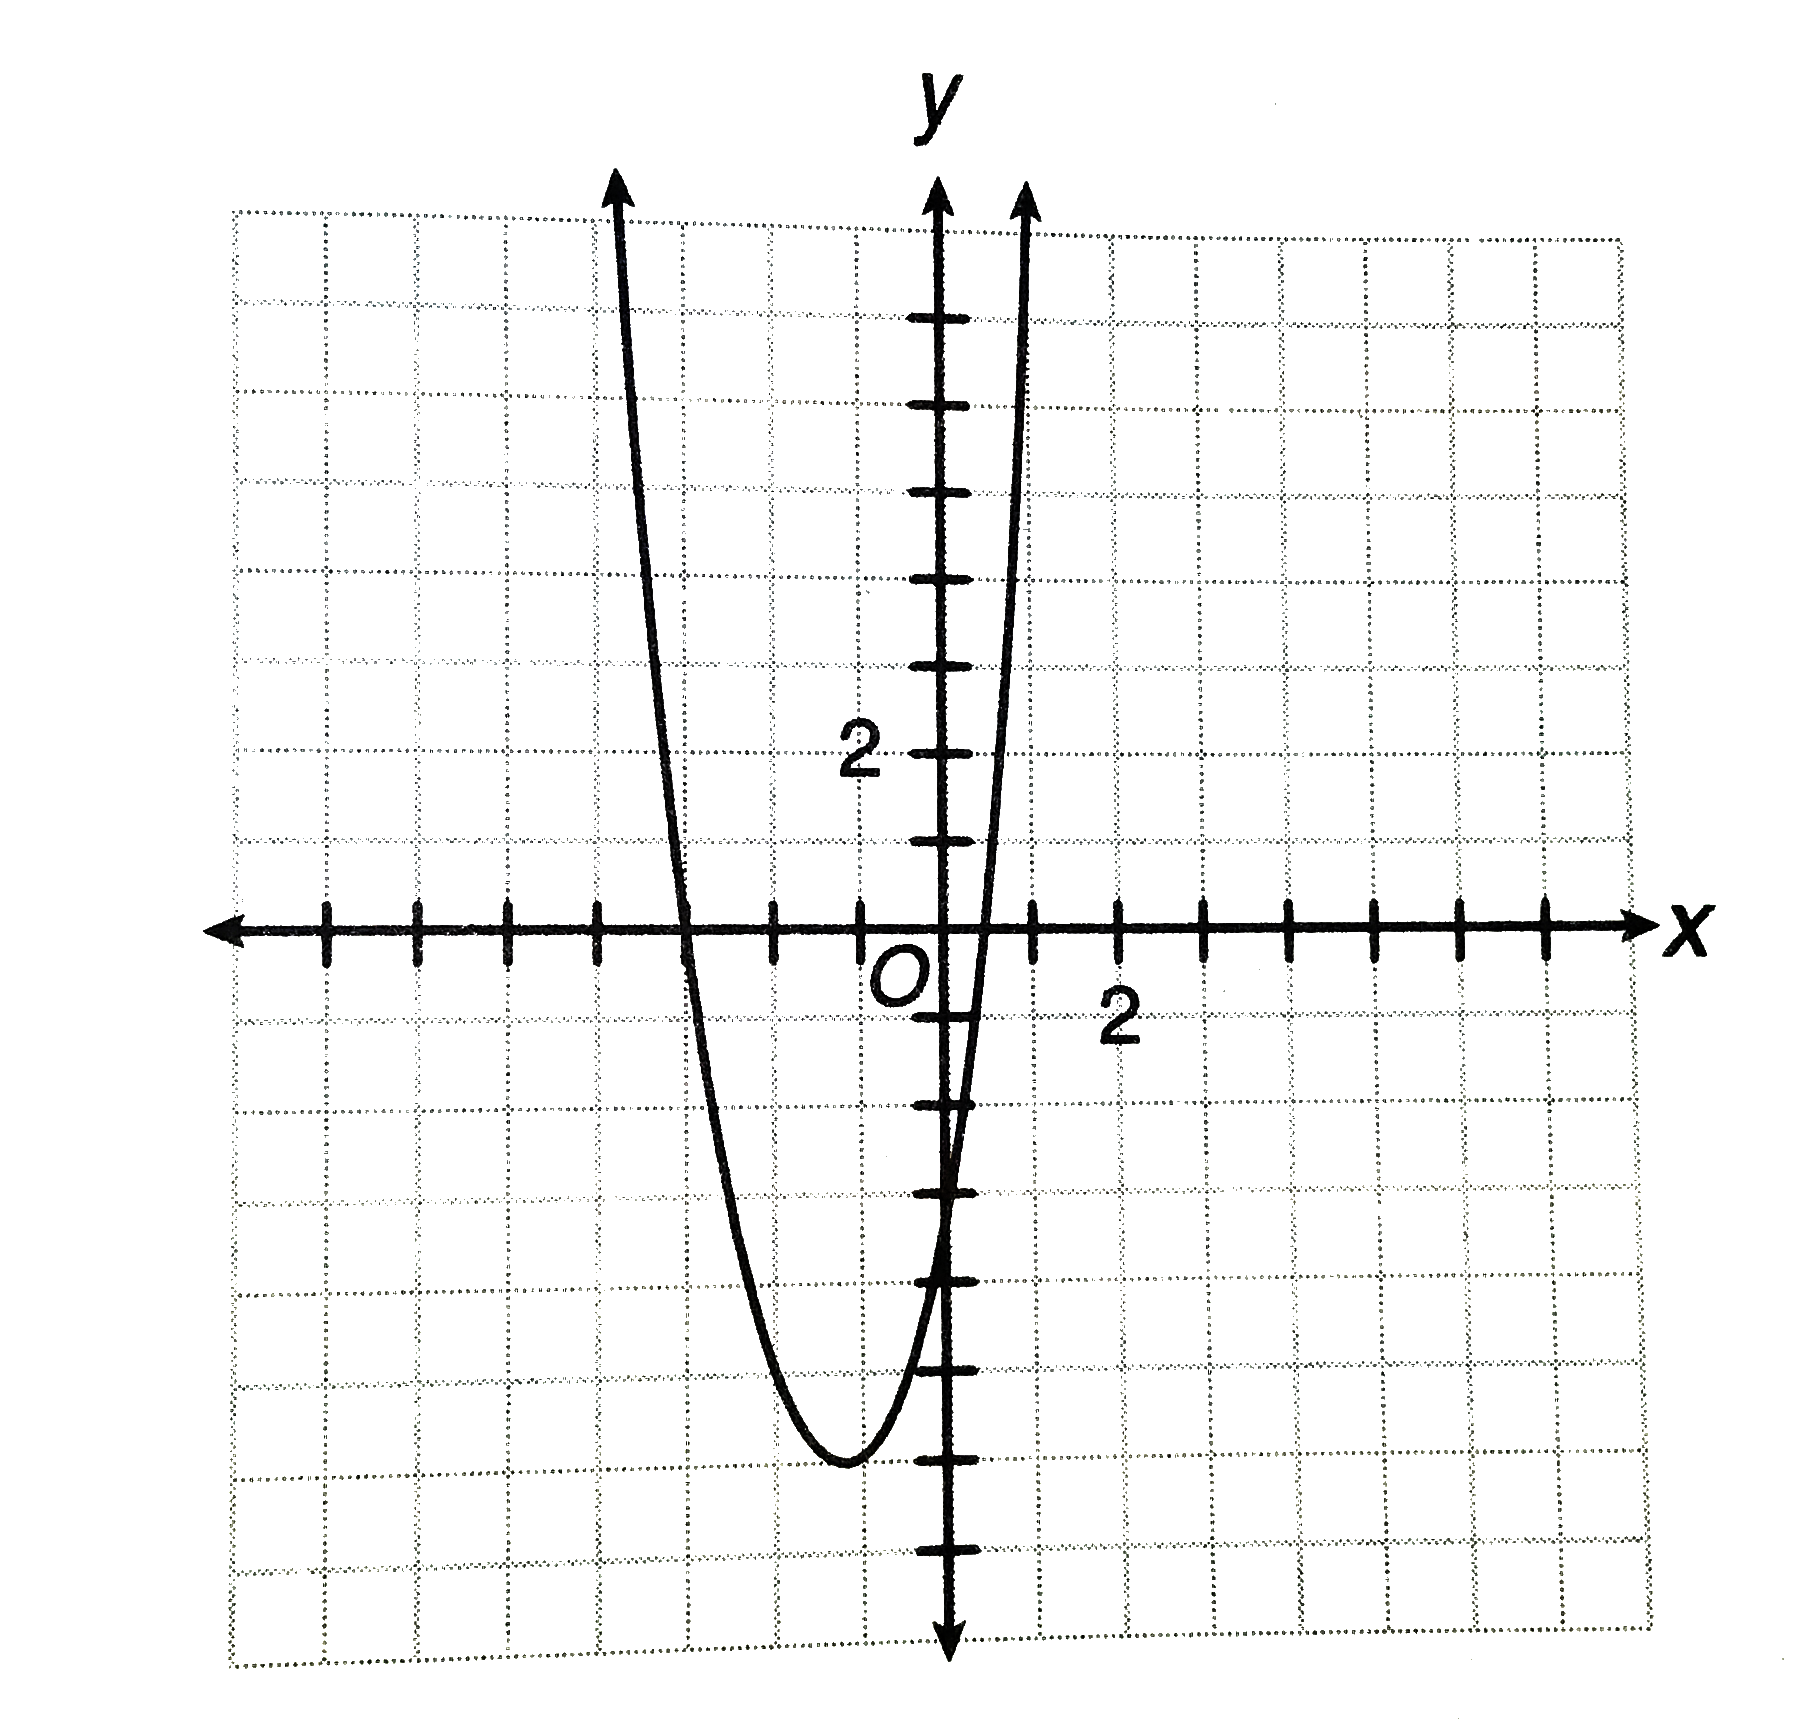
Each of the following quadratic equations represents the graph shown above. Which equation reveals the exact values of the x-intercepts of the graph?
A
B
C
D
Video Solution
Text Solution
The correct Answer is:A
|
Answer
Step by step video & image solution for Each of the following quadratic equations represents the graph shown above. Which equation reveals the exact values of the x-intercepts of the graph? by Maths experts to help you in doubts & scoring excellent marks in Class 10 exams.
Updated on:21/07/2023Topper's Solved these Questions
Similar Questions
Knowledge Check
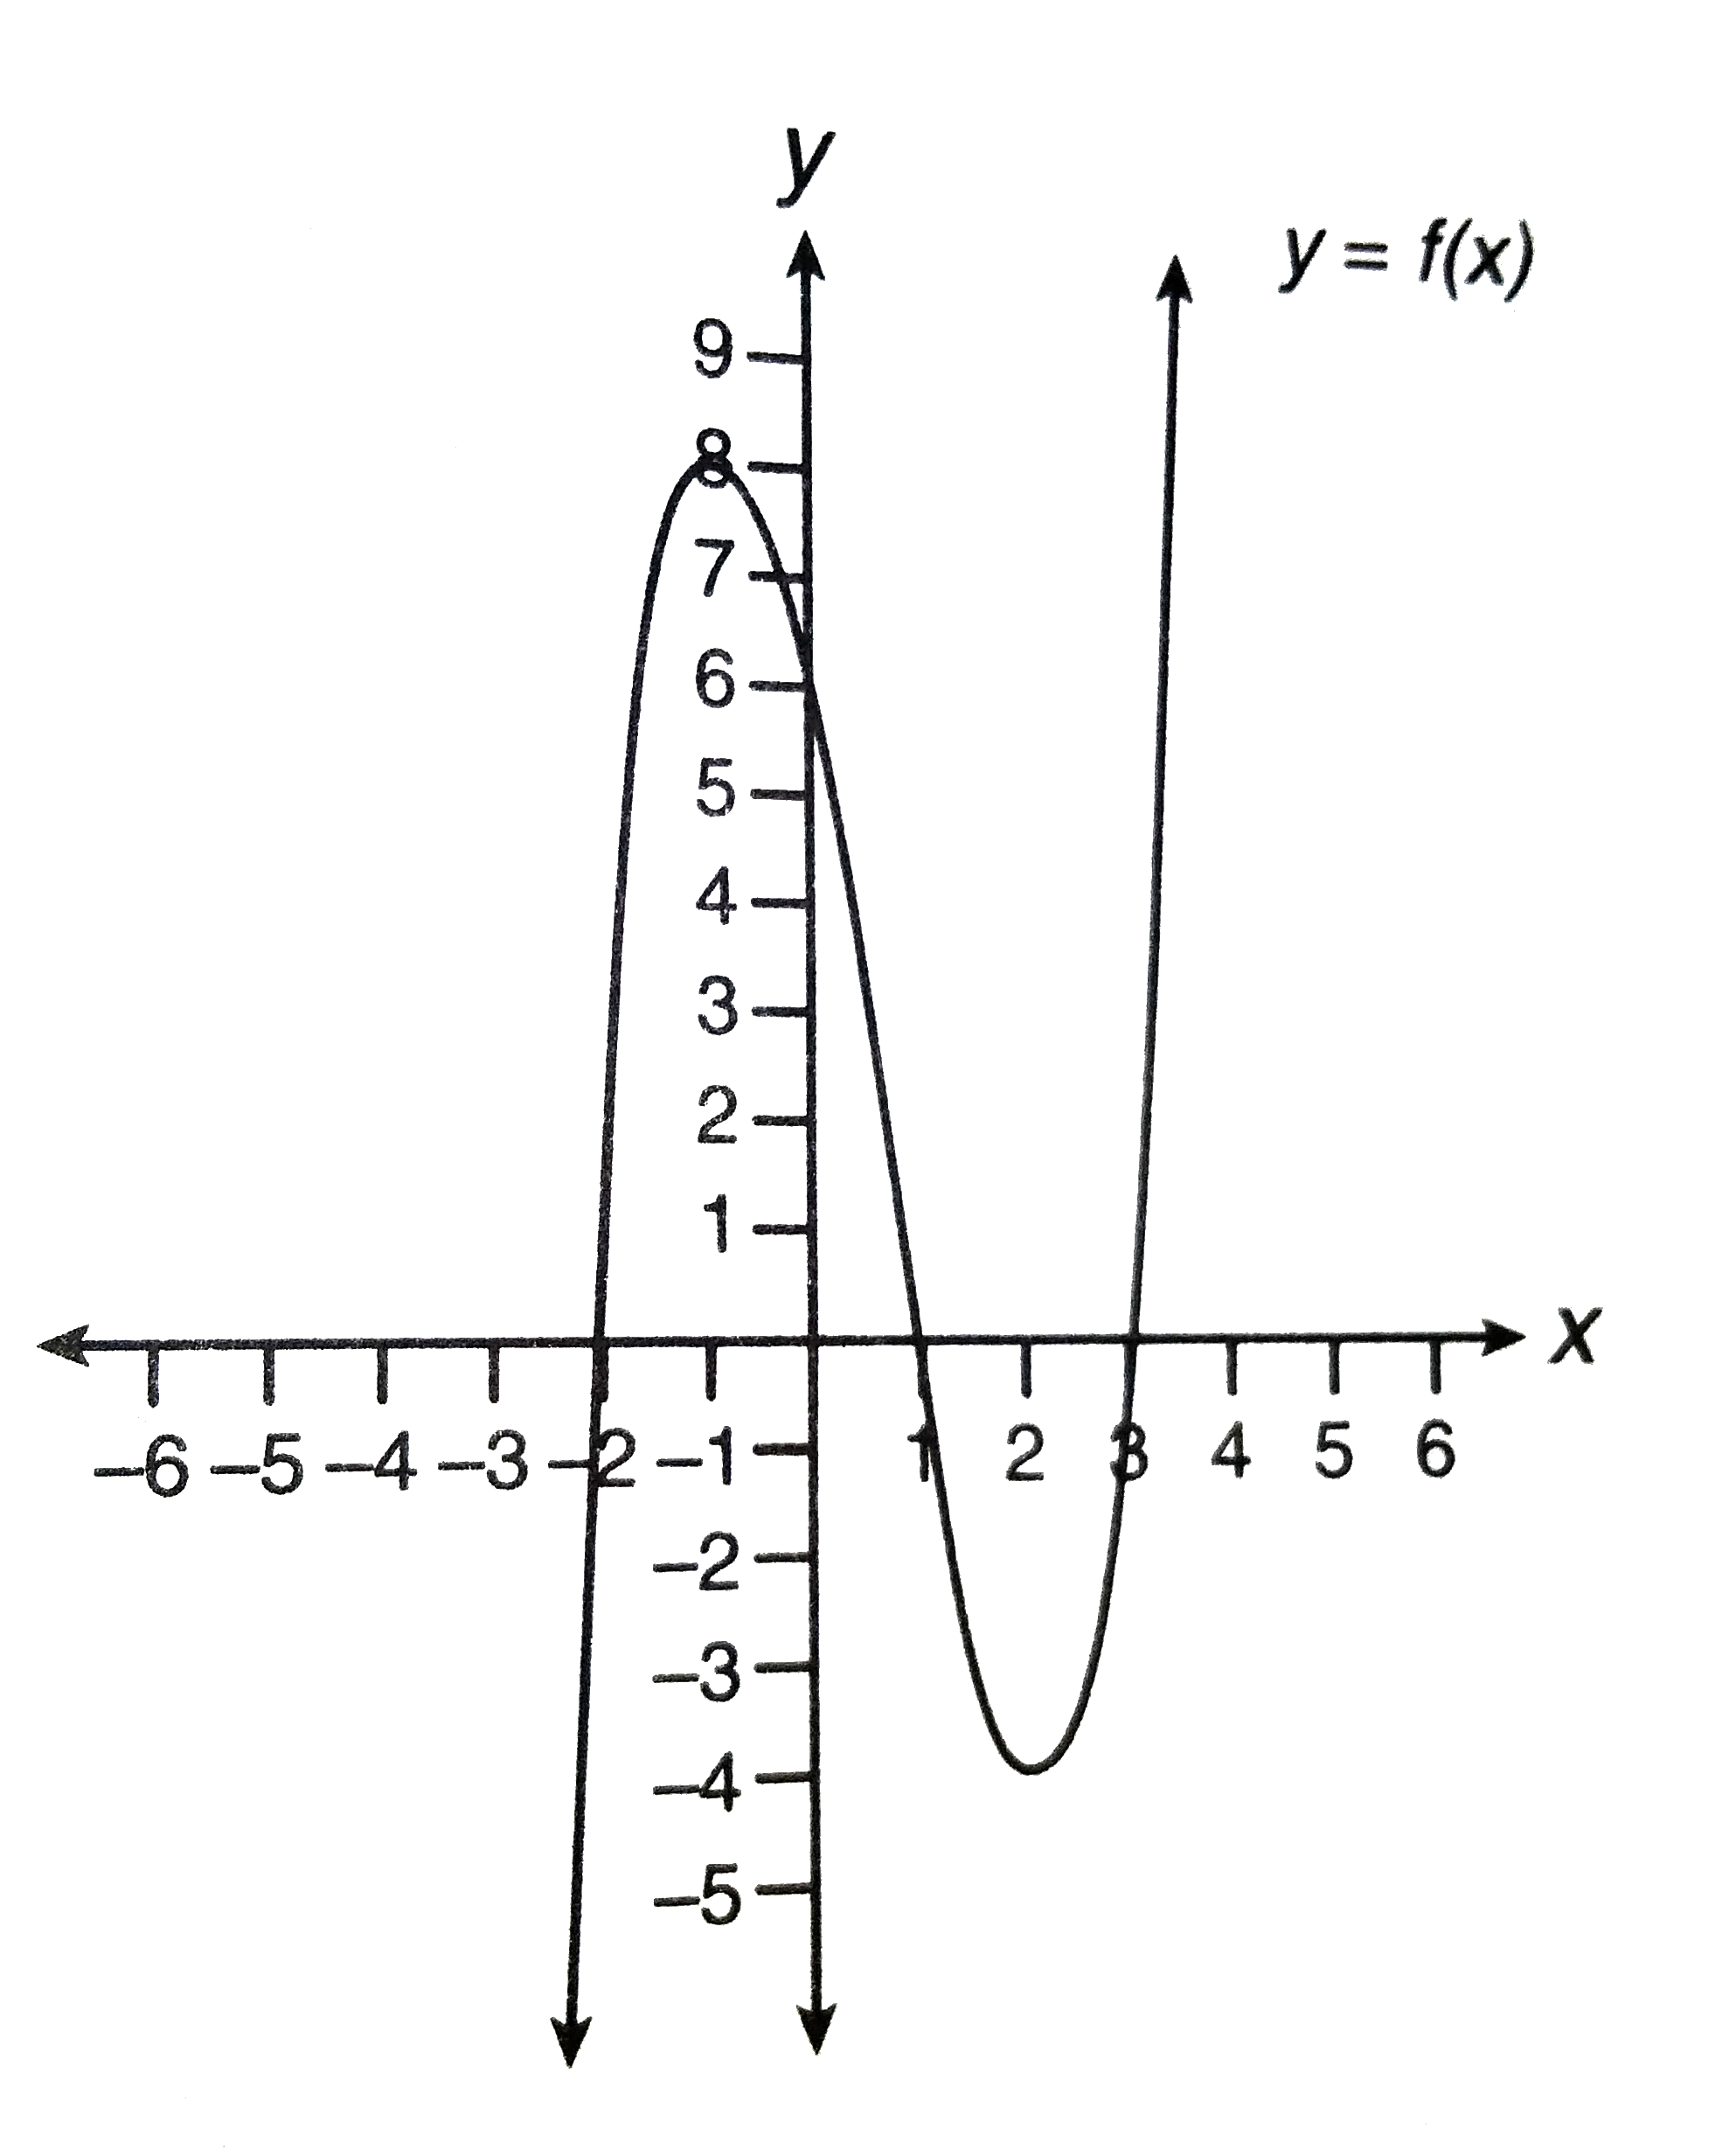
Which function could represents the graph above?Af(x)=(x−6)(x2−4x+3)Bf(x)=(x−3)(x2+x−2)Cf(x)=(x−1)(x2−5x−6)Df(x)=(x+2)(x2−4x−12)Which of the following inequalities represents the graph shown below on the real number line ?
 A0<x<5B0<x≤4C−2<x≤4D1≤x≤4
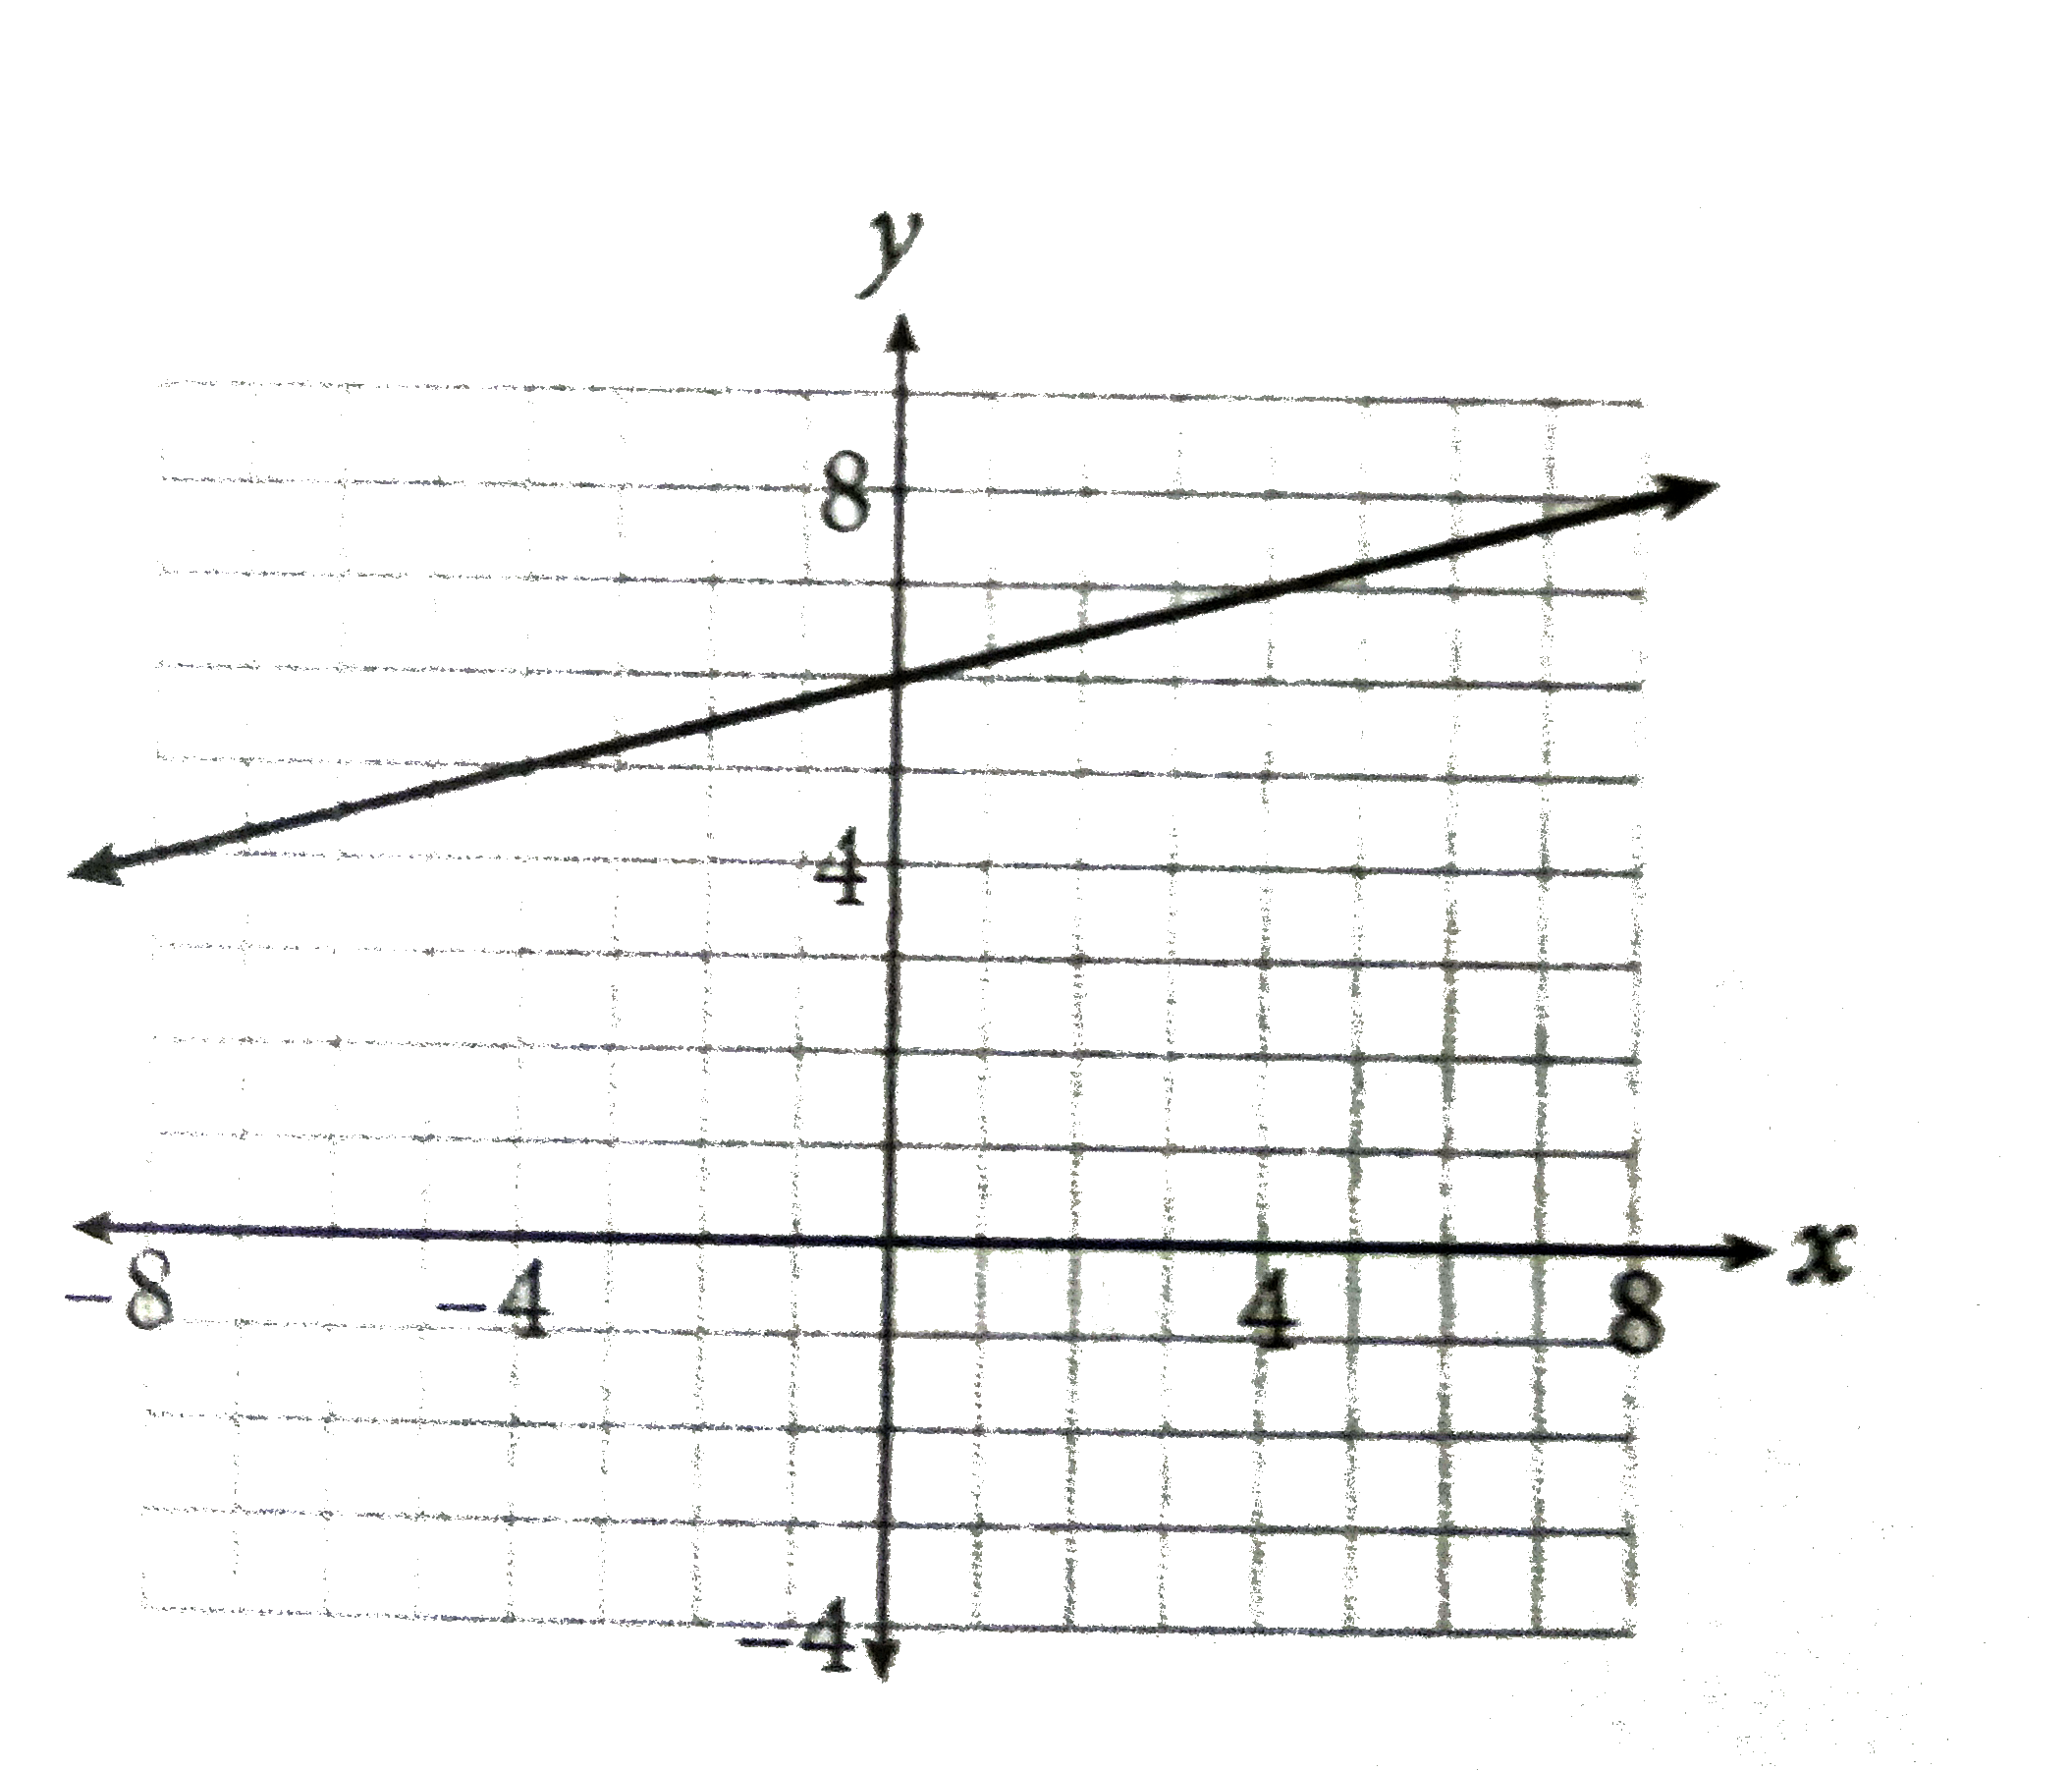
Which of the following could be the equation of the graph above?Ay=(x−3)(2x+1)By=(x+3)(2x−1)Cy=−(x−3)(1+2x)Dy=12(x+3)(x−1)
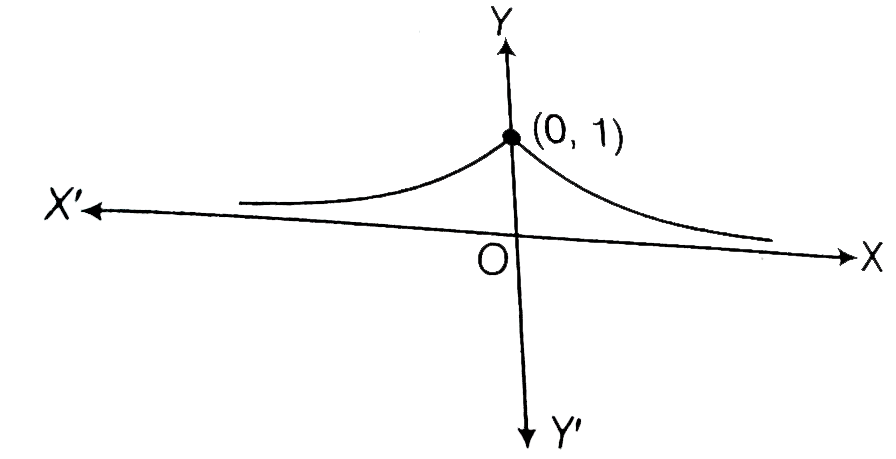
Which of the following equations represents the line shown in the graph?
View SolutionWhich one of the following function best represents the graphs as shown below?
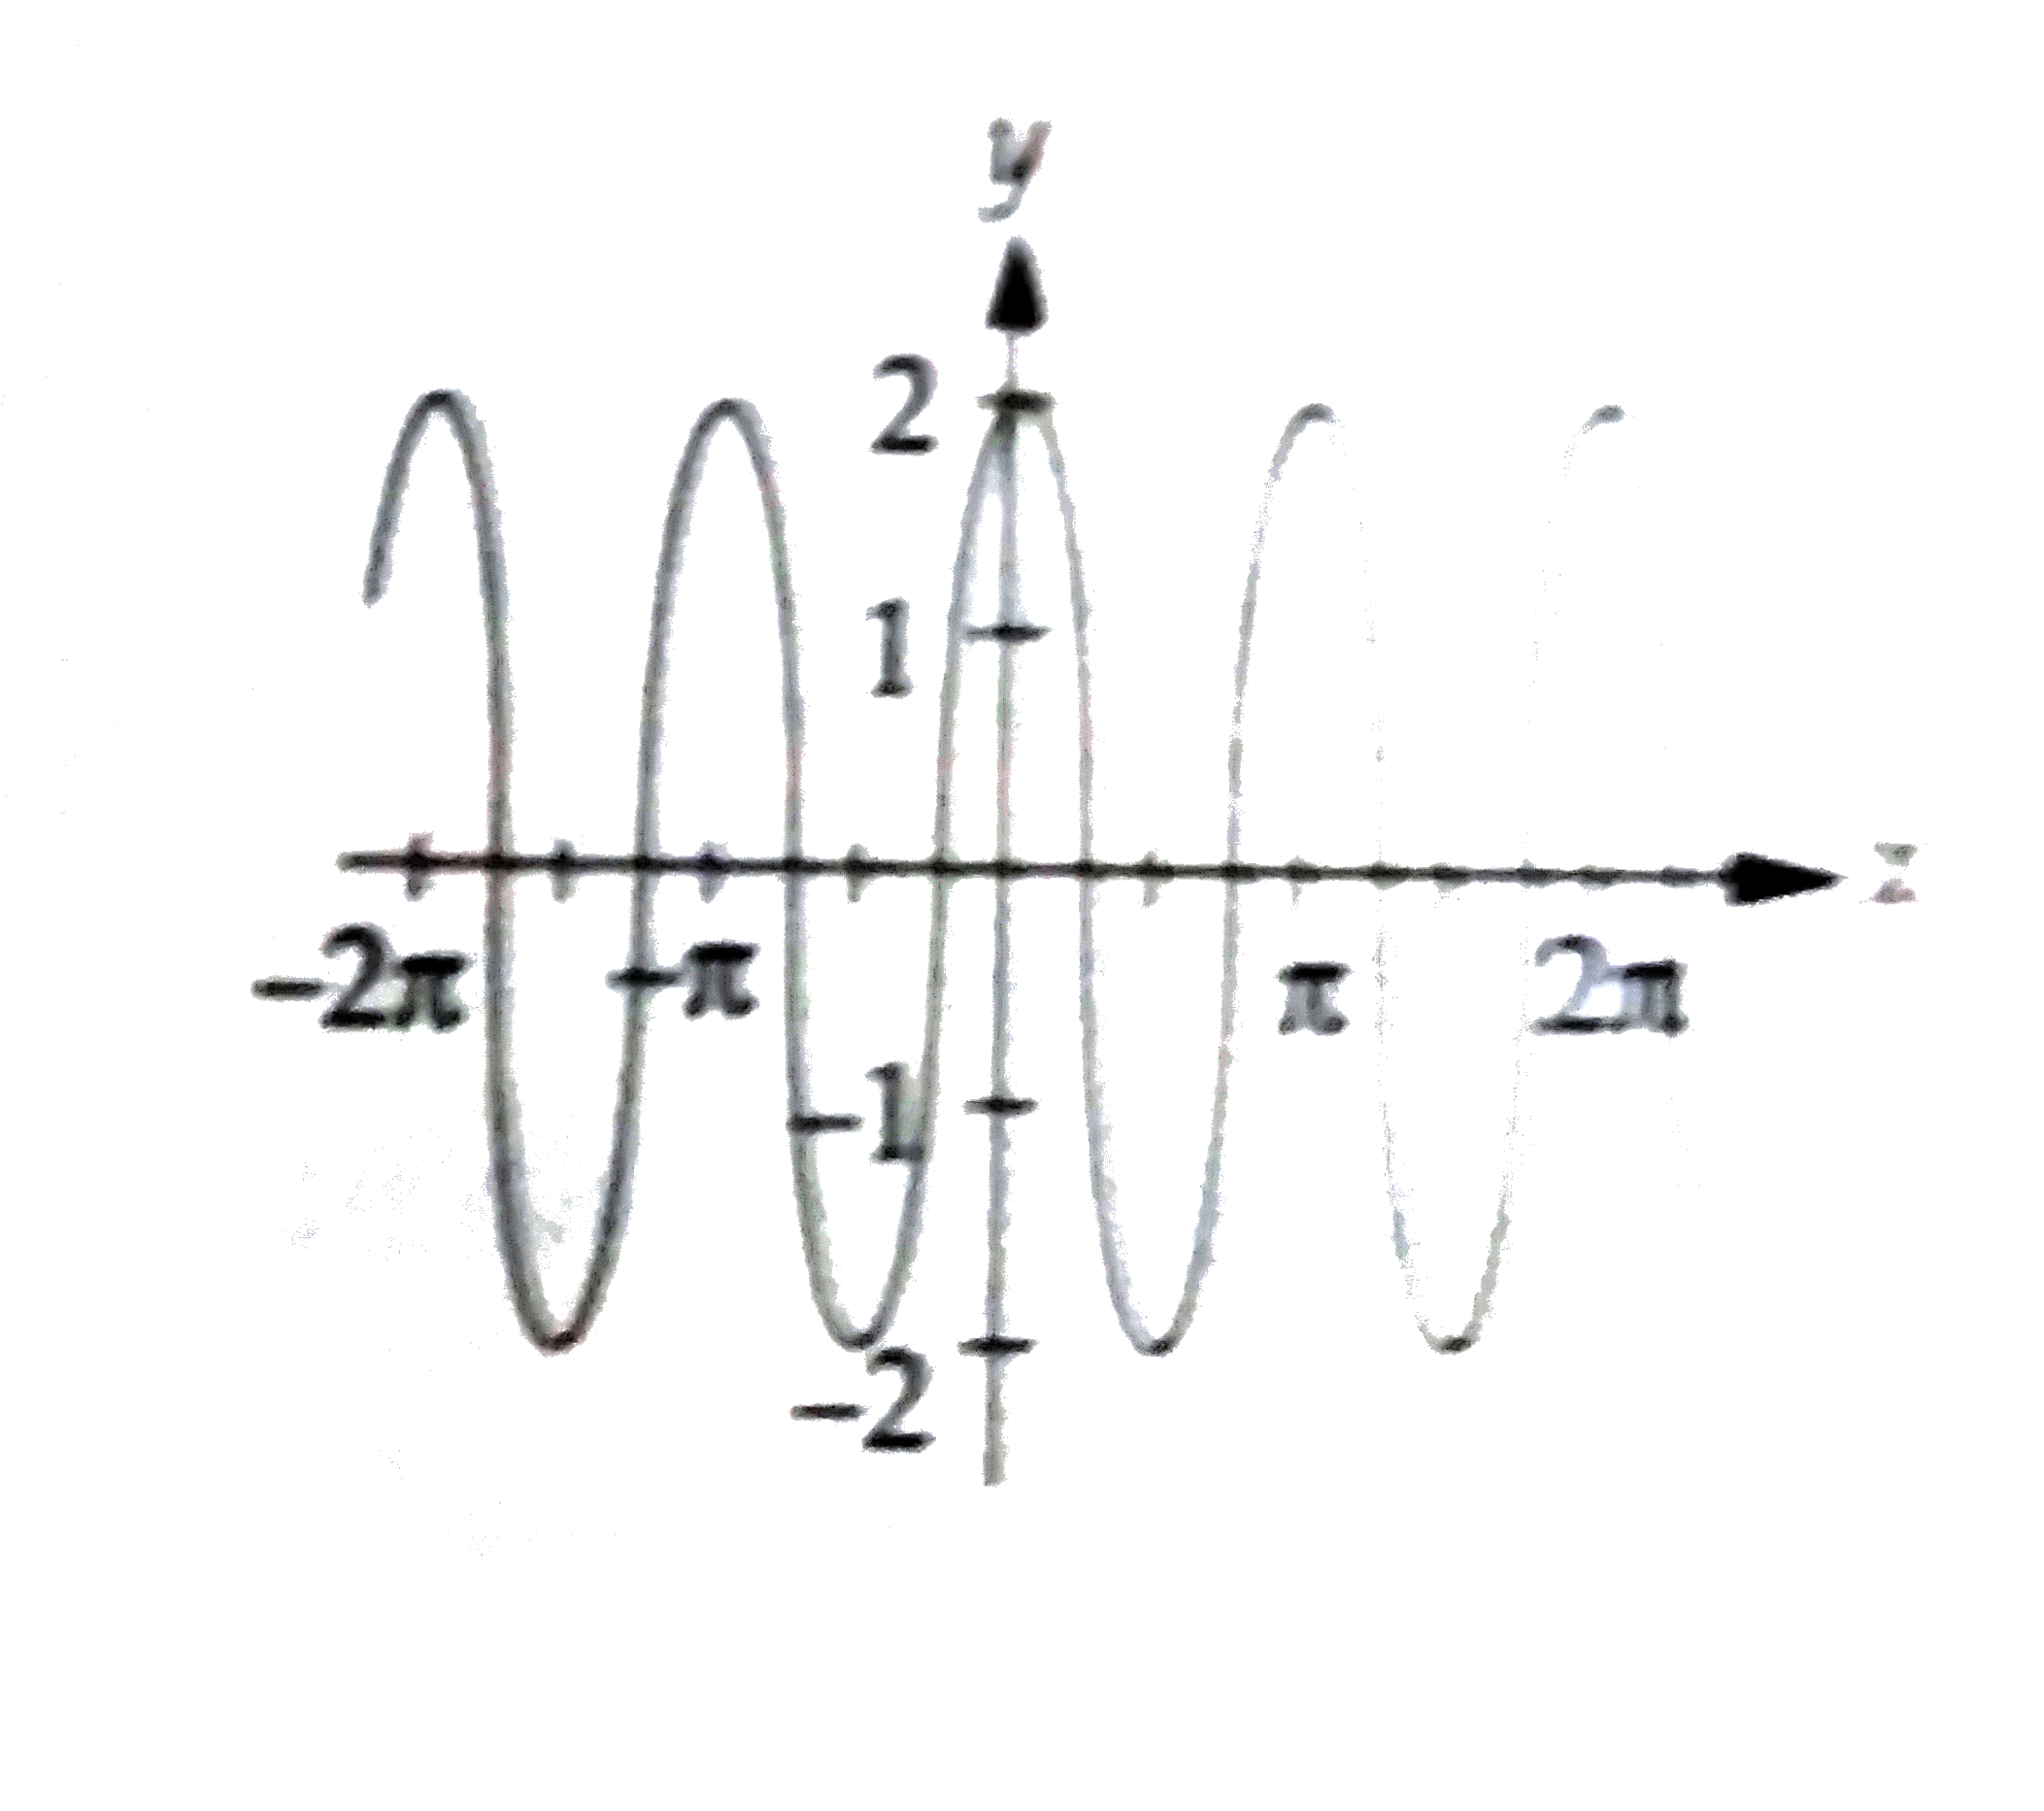
View SolutionWhich of the following is an equation of the graph shown in Figure
View Solution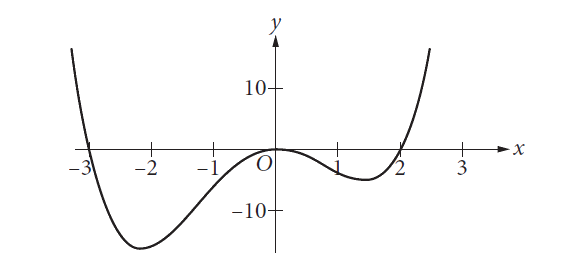
Which of the following could be the equation of the graph above?
View SolutionWhich of the following equation is best representation of given graph's?
View Solution

