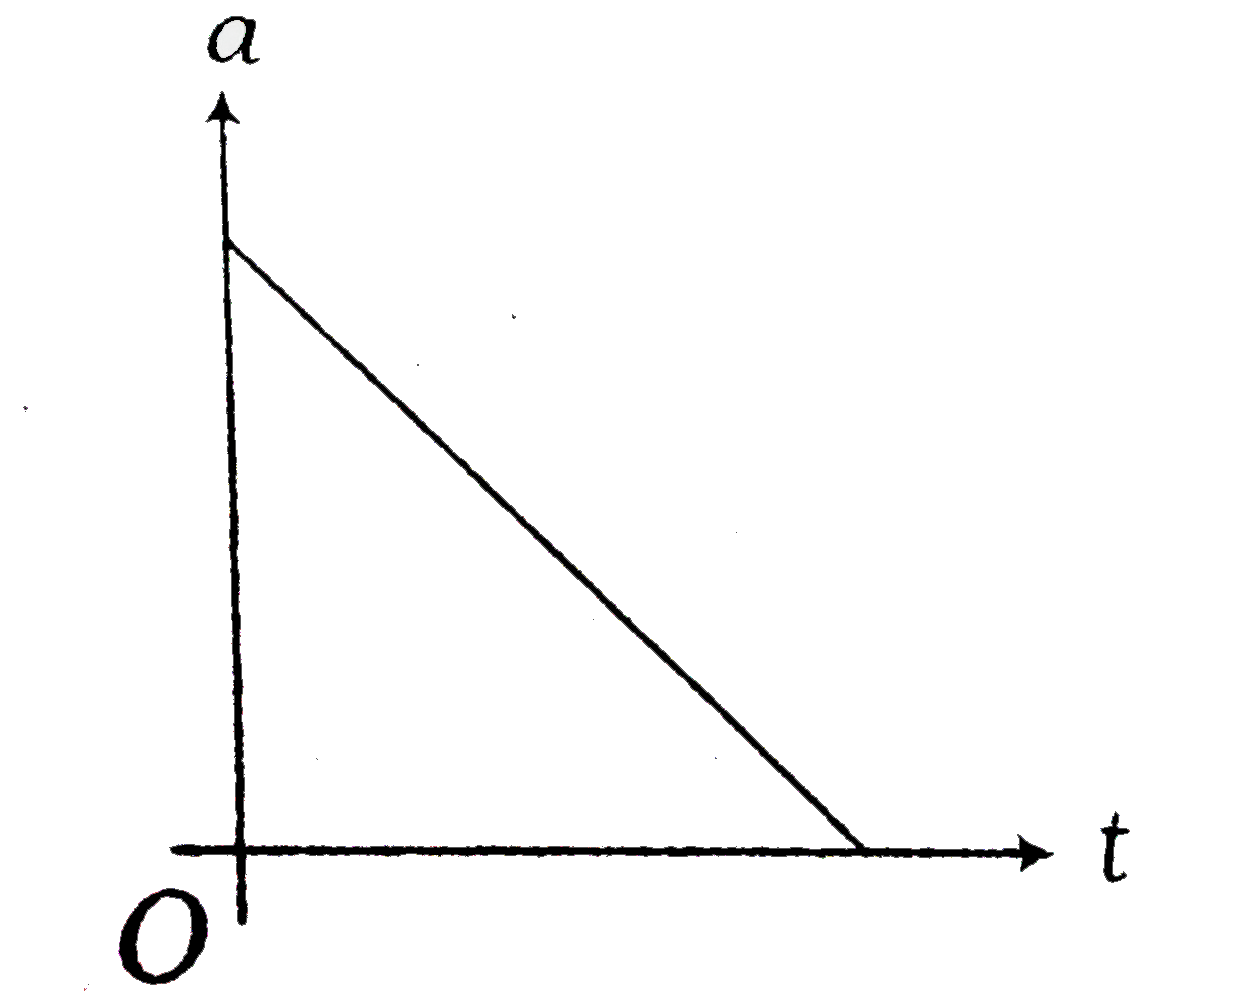
Figure shows acceleration versus time graph of a particle starting from rest and moving along a straight line. Which of the following staement (s) is/are correct ?
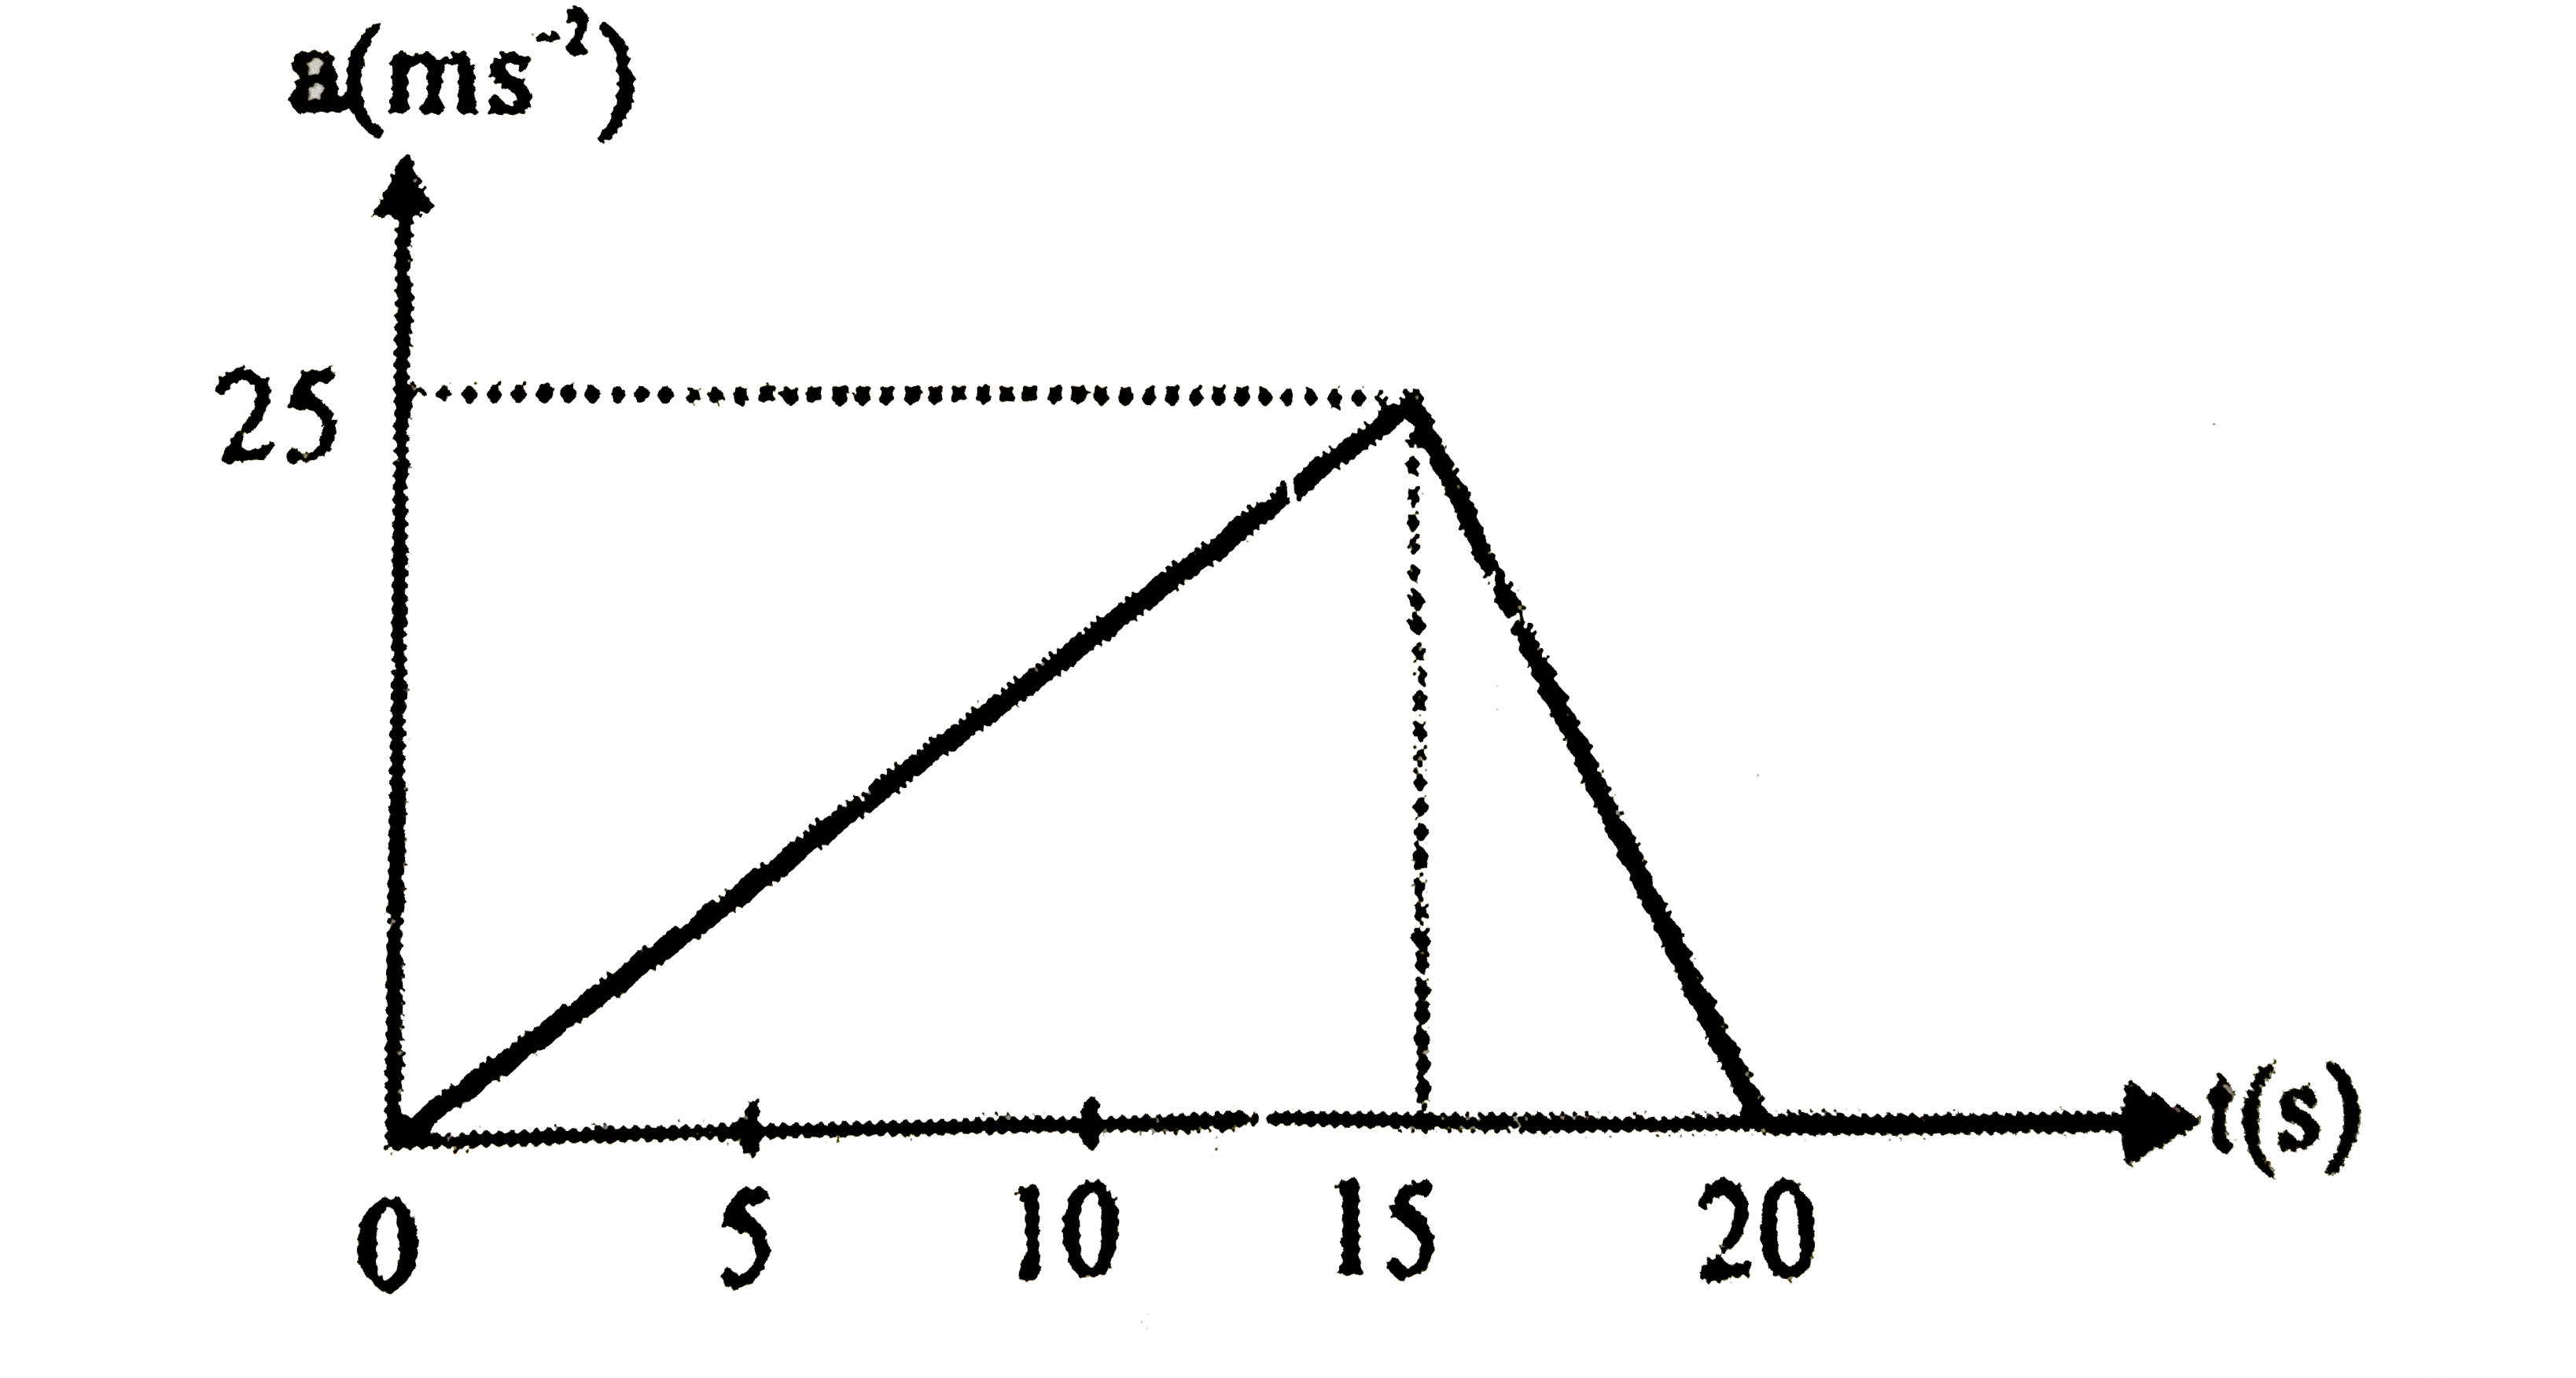
The maximum velocity attained by the particle is 250ms−1
The particle stops nowhere.
The particle eventually moves with constant speed.
The body gets retarded during the time interval 15s<1≤20s.
Step by step video & image solution for Figure shows acceleration versus time graph of a particle starting from rest and moving along a straight line. Which of the following staement (s) is/are correct ? by Maths experts to help you in doubts & scoring excellent marks in Class 12 exams.
Updated on:21/07/2023Topper's Solved these Questions
Similar Questions
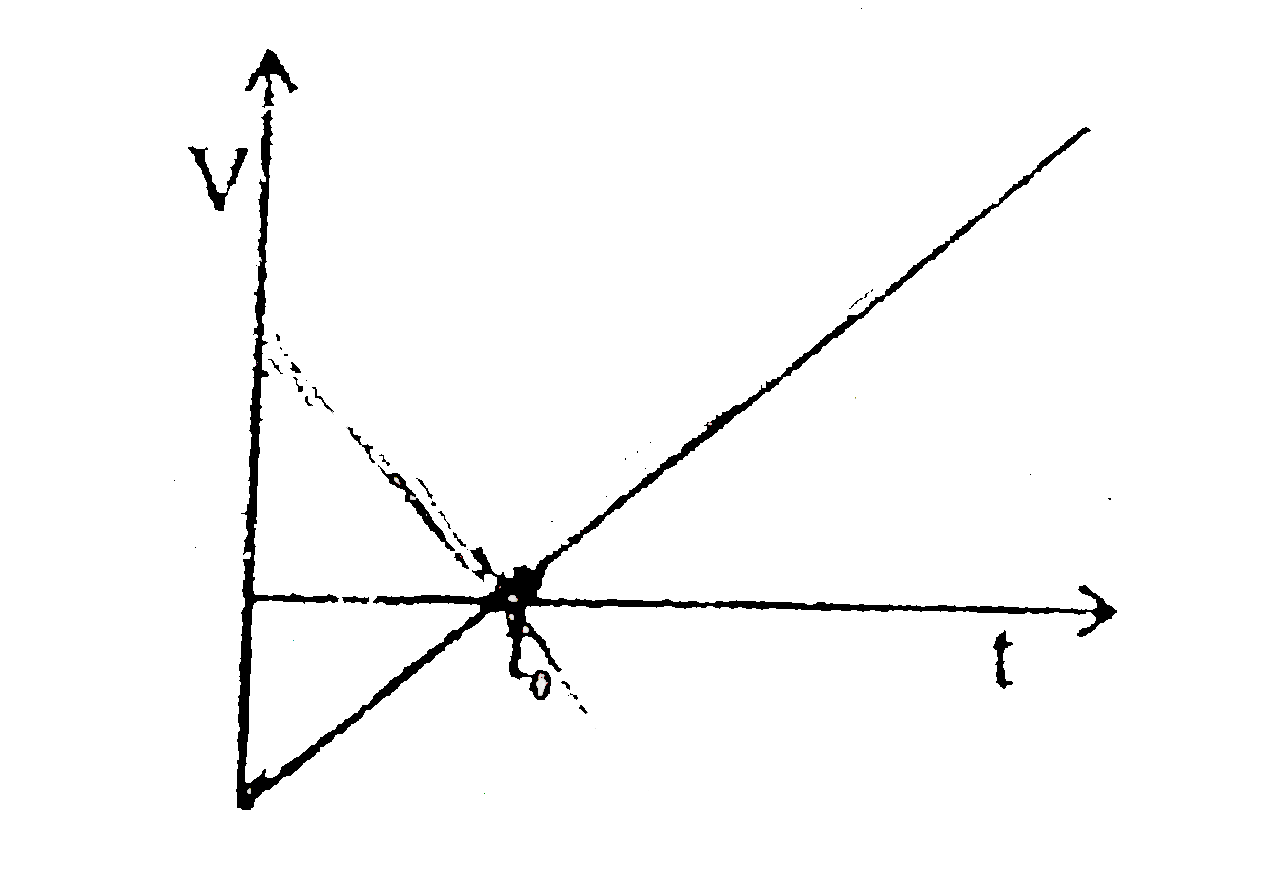
Figure shows velocity time graph of a particle moving in straight line. Which of the following statement(s) is / are CORRECT:−
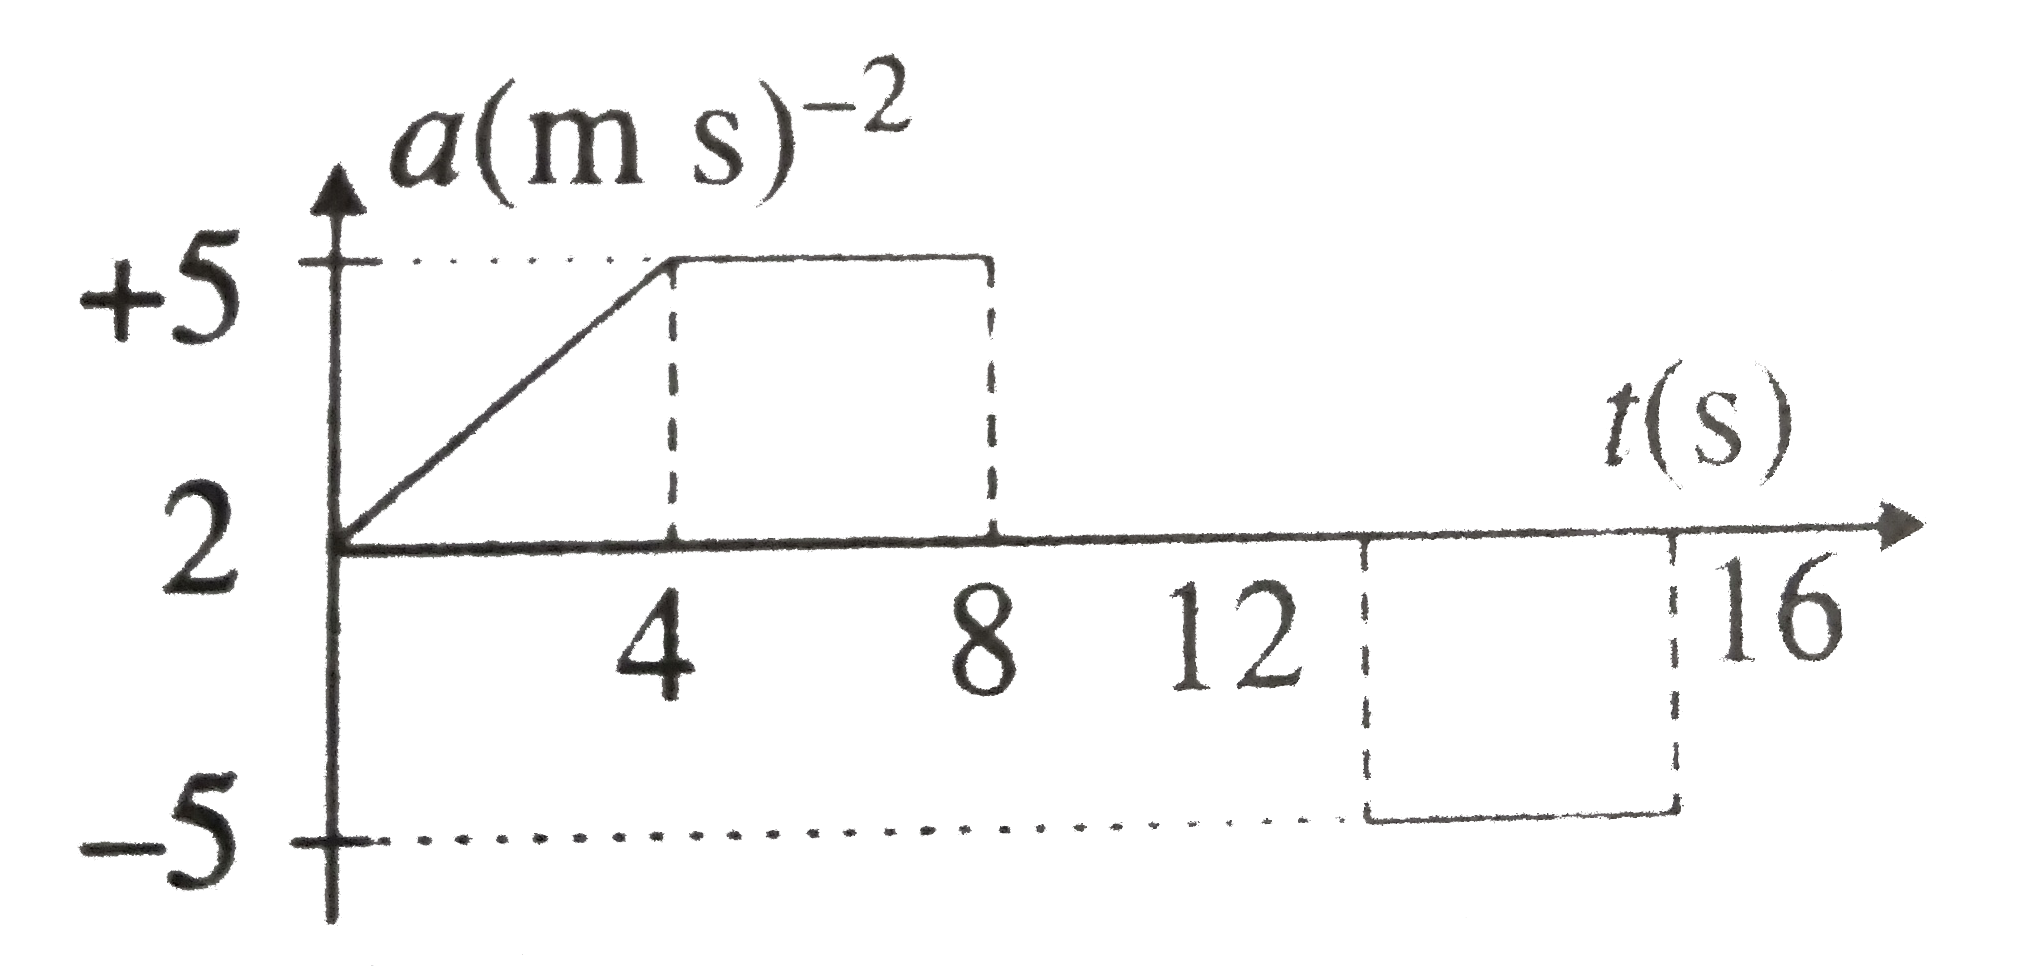
View SolutionThe acceleration of a particle starting from rest and travelling along a straight line is shown in figure. The maximum speed of the particle is
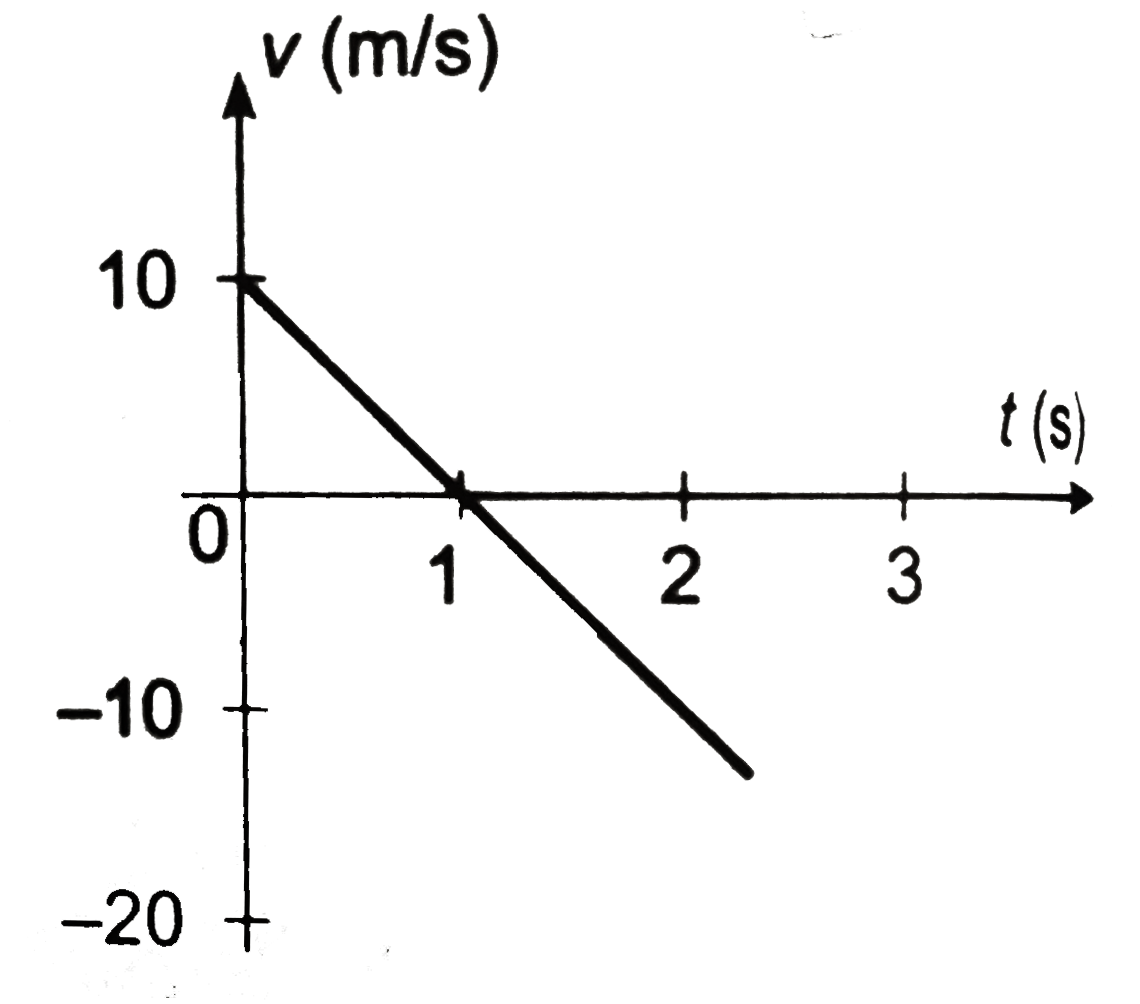
View SolutionThe figure shows velocity-time graph of a particle moving along a straight line. Identify the correct statement.
View SolutionA graph of acceleration versus time of a particle starting from rest at t=0 is as shown in figure. The speed of the particle at t=14s is
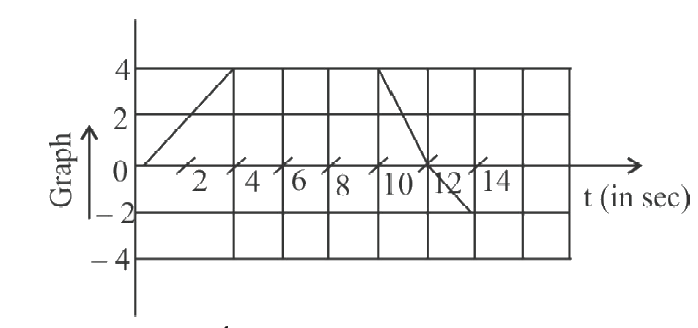
View SolutionFigure shows the acceleration-time graph of a particle moving along a straight line. After what time the particle acquires its initial velocity?
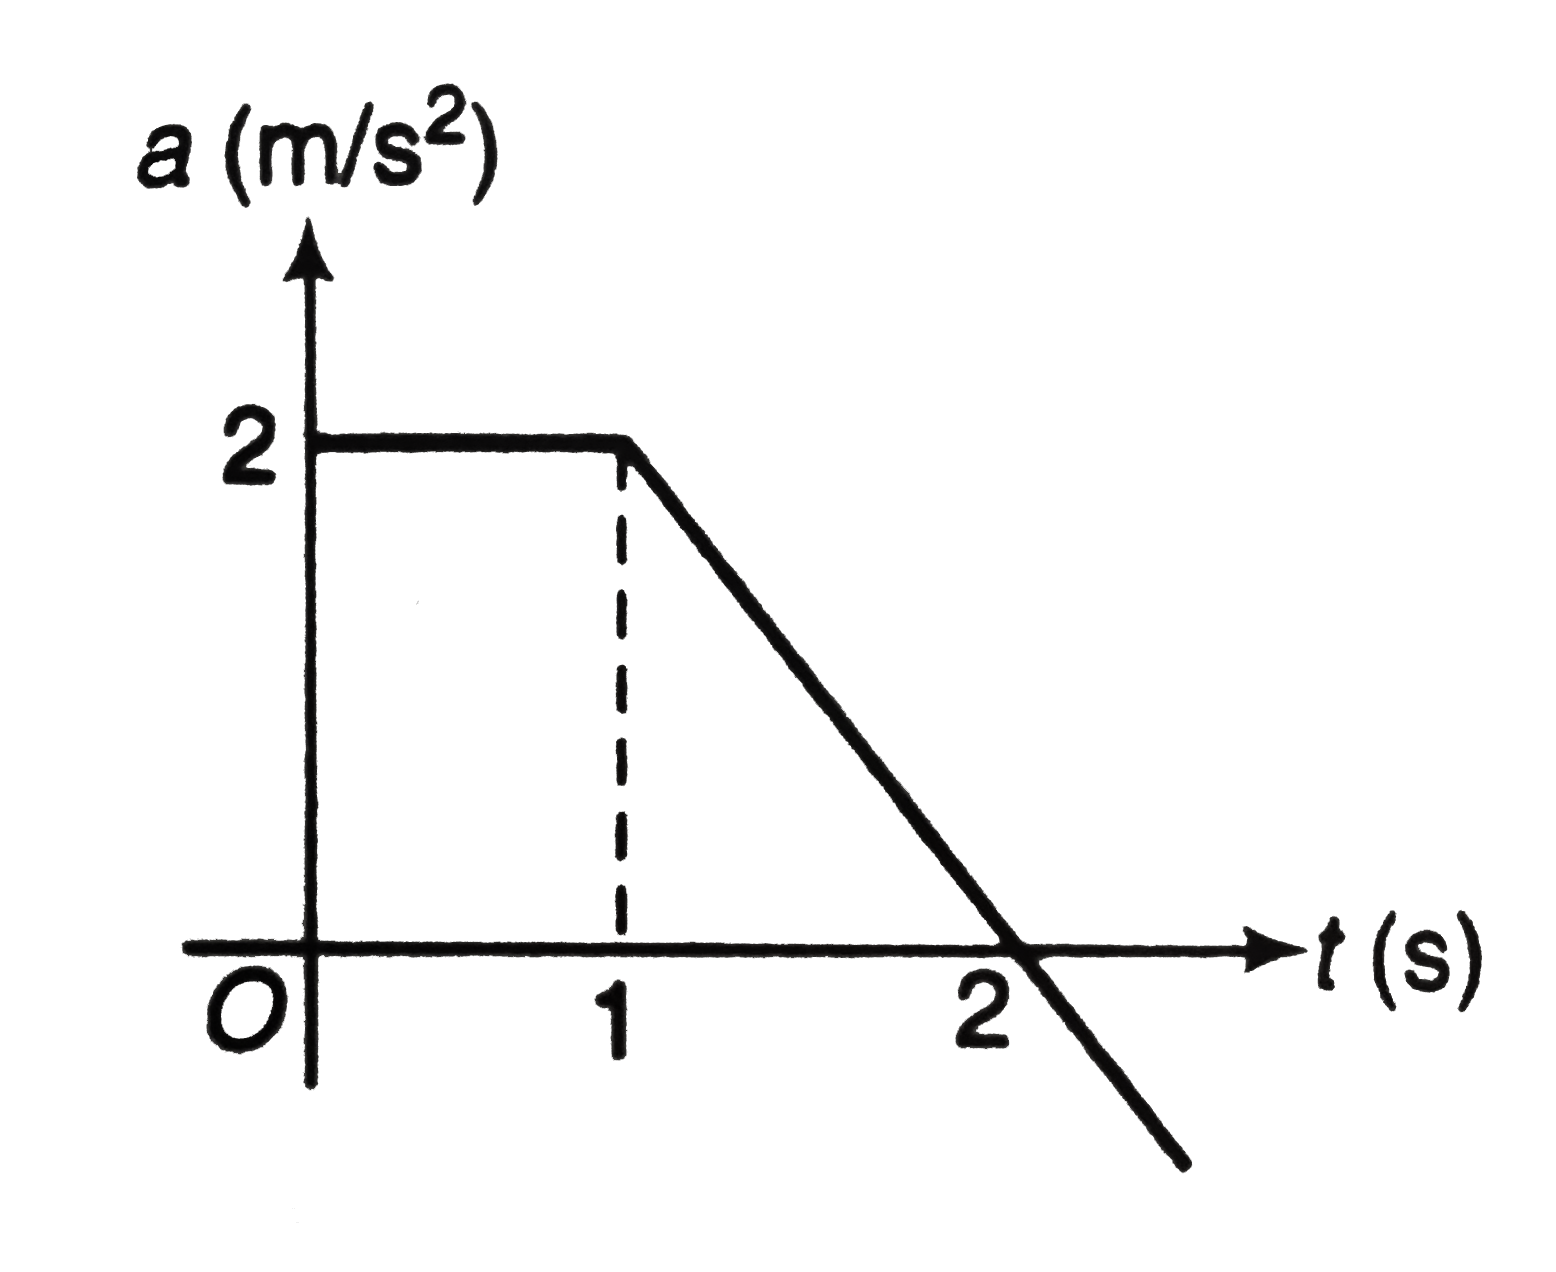
View SolutionThe acceleration versus time graph of a particle moving in a straight line is show in. The velocity-time graph of the particle would be
 .
.
View SolutionA particle starting from rest moves along a straight line with constant acceleration for this velocity displacement graph will have the form-
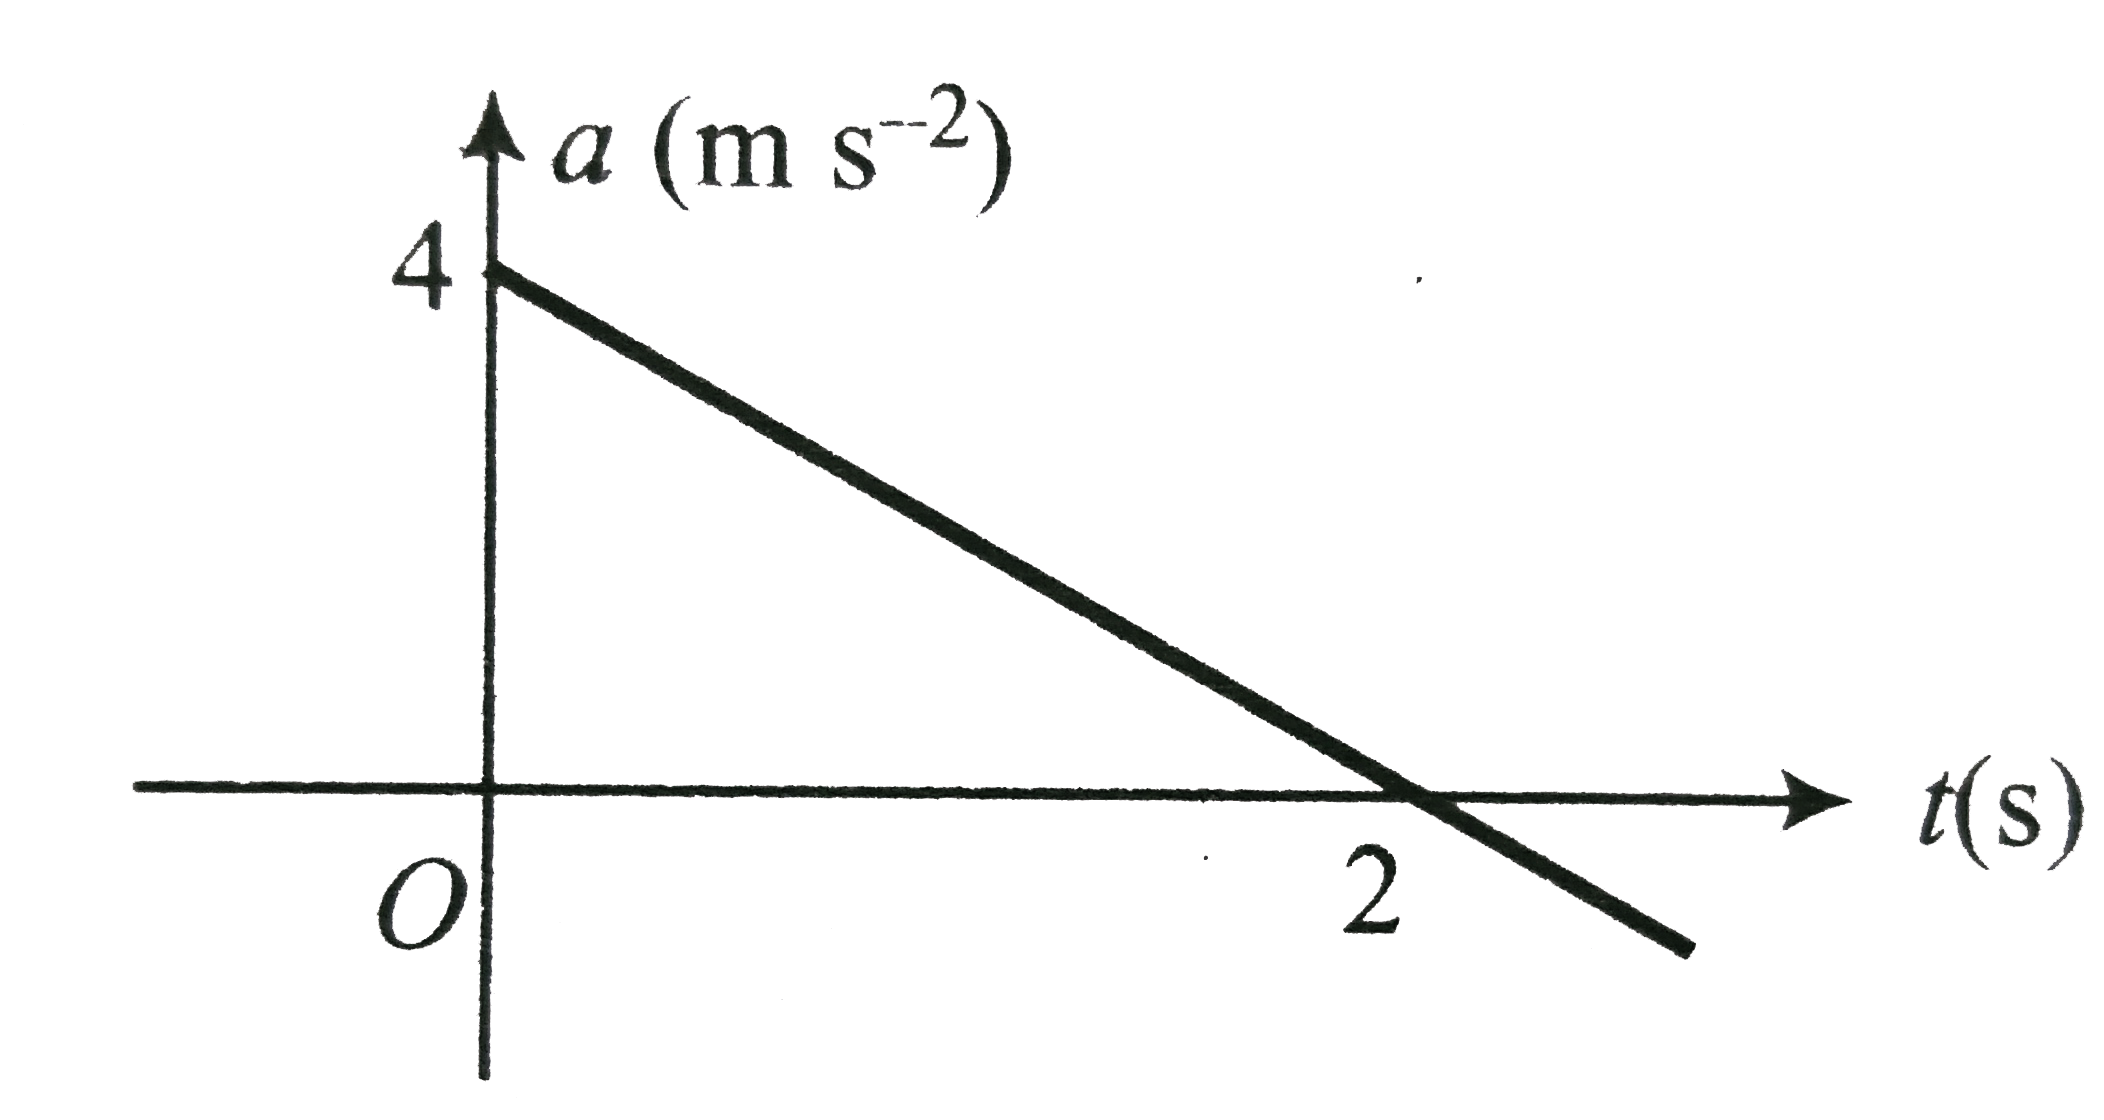
View SolutionThe acceleration versus time graph of a particle moving along a straight line is shown in the figure. Draw the respective velocity-time graph Given v=0 at t=0.
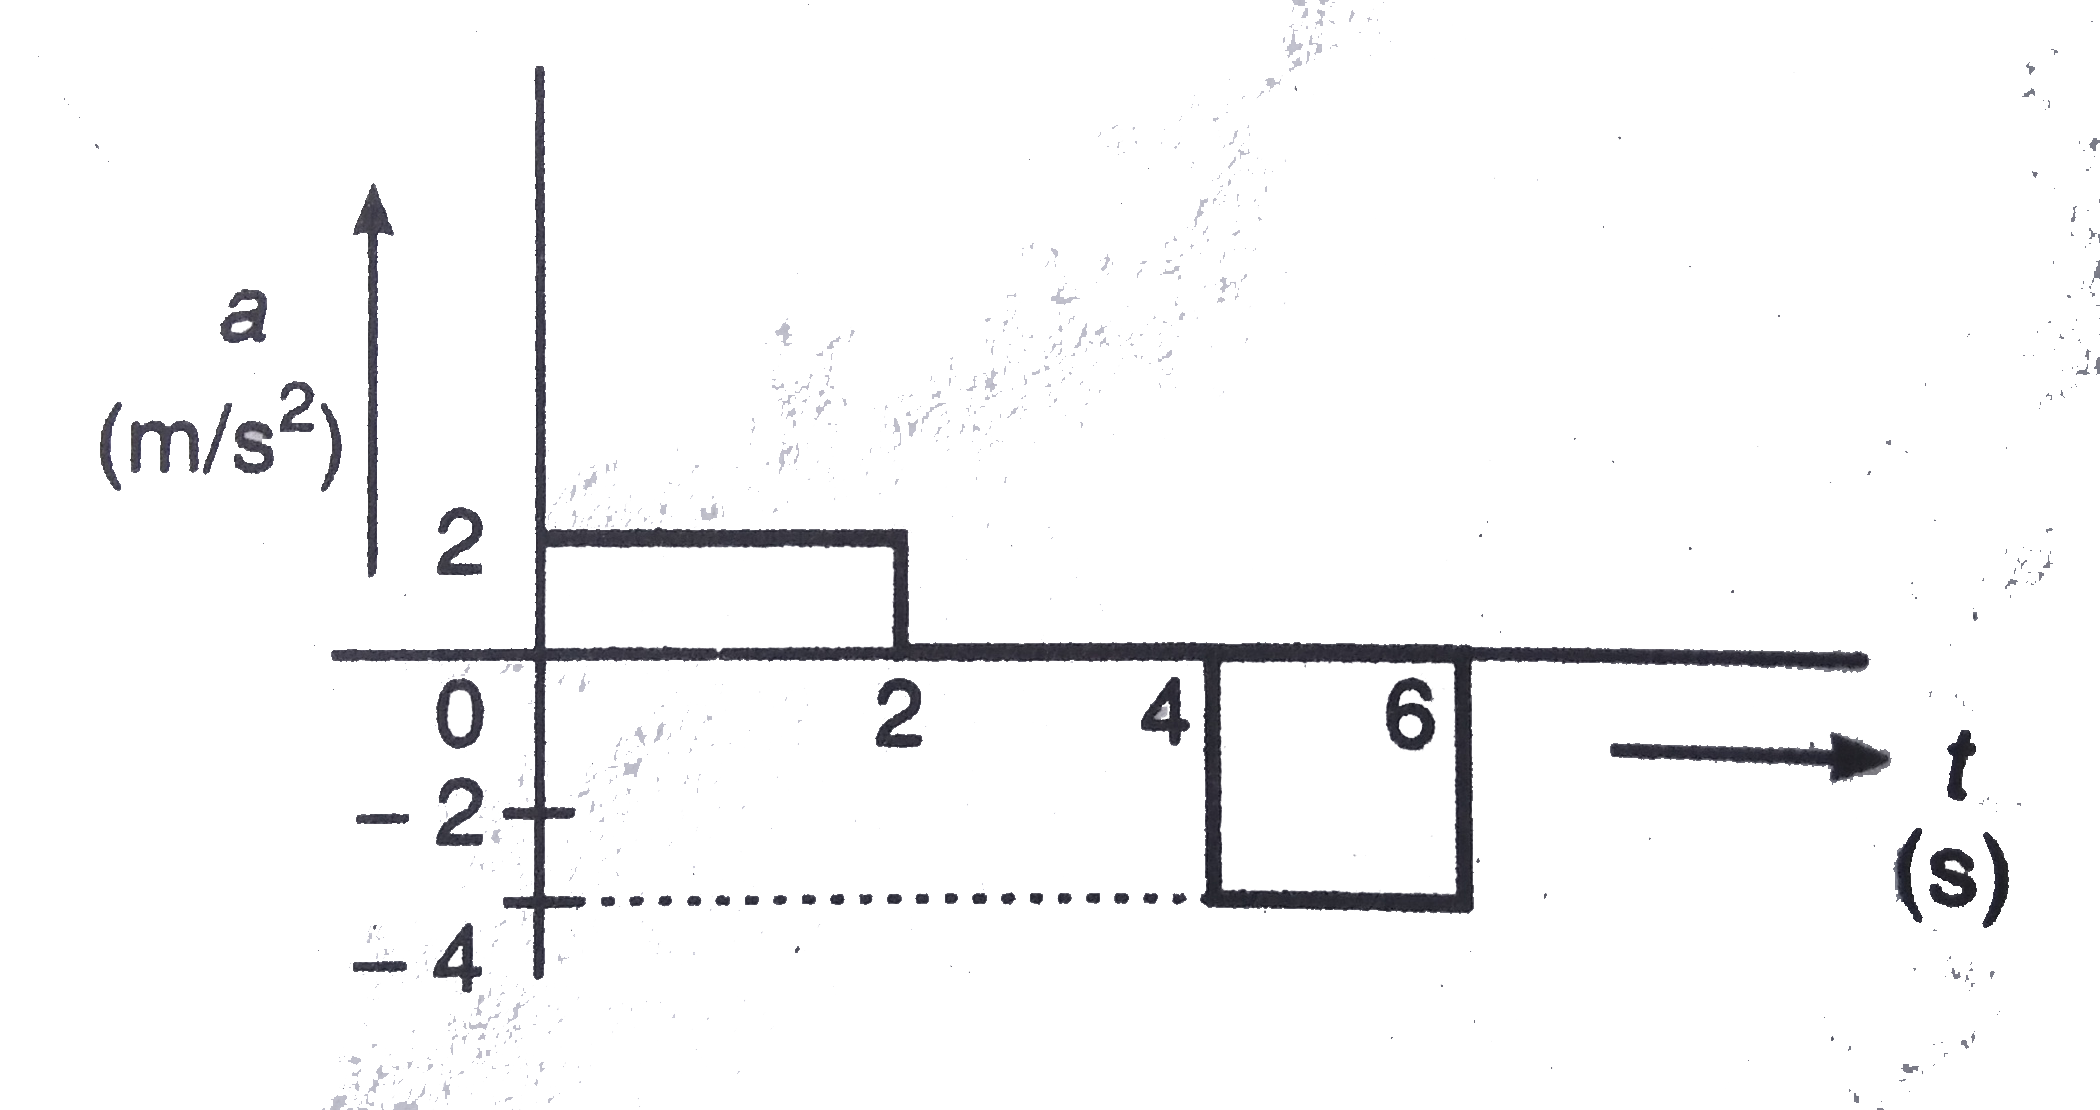
View SolutionThe acceleration (a)-time(t) graph for a particle moving along a straight from rest is shown in figure. Which of the following graph is the best representation of its velocity (v) with time (t) ?
View SolutionThe acceleration (a)-time(t) graph for a particle moving along a straight from rest is shown in figur. Which of the following graph is the best representation of its velocity (v) with time (t) ?

View Solution
