Following table gives the distribution of students of sections A and B of a class according to the marks obtained by them.
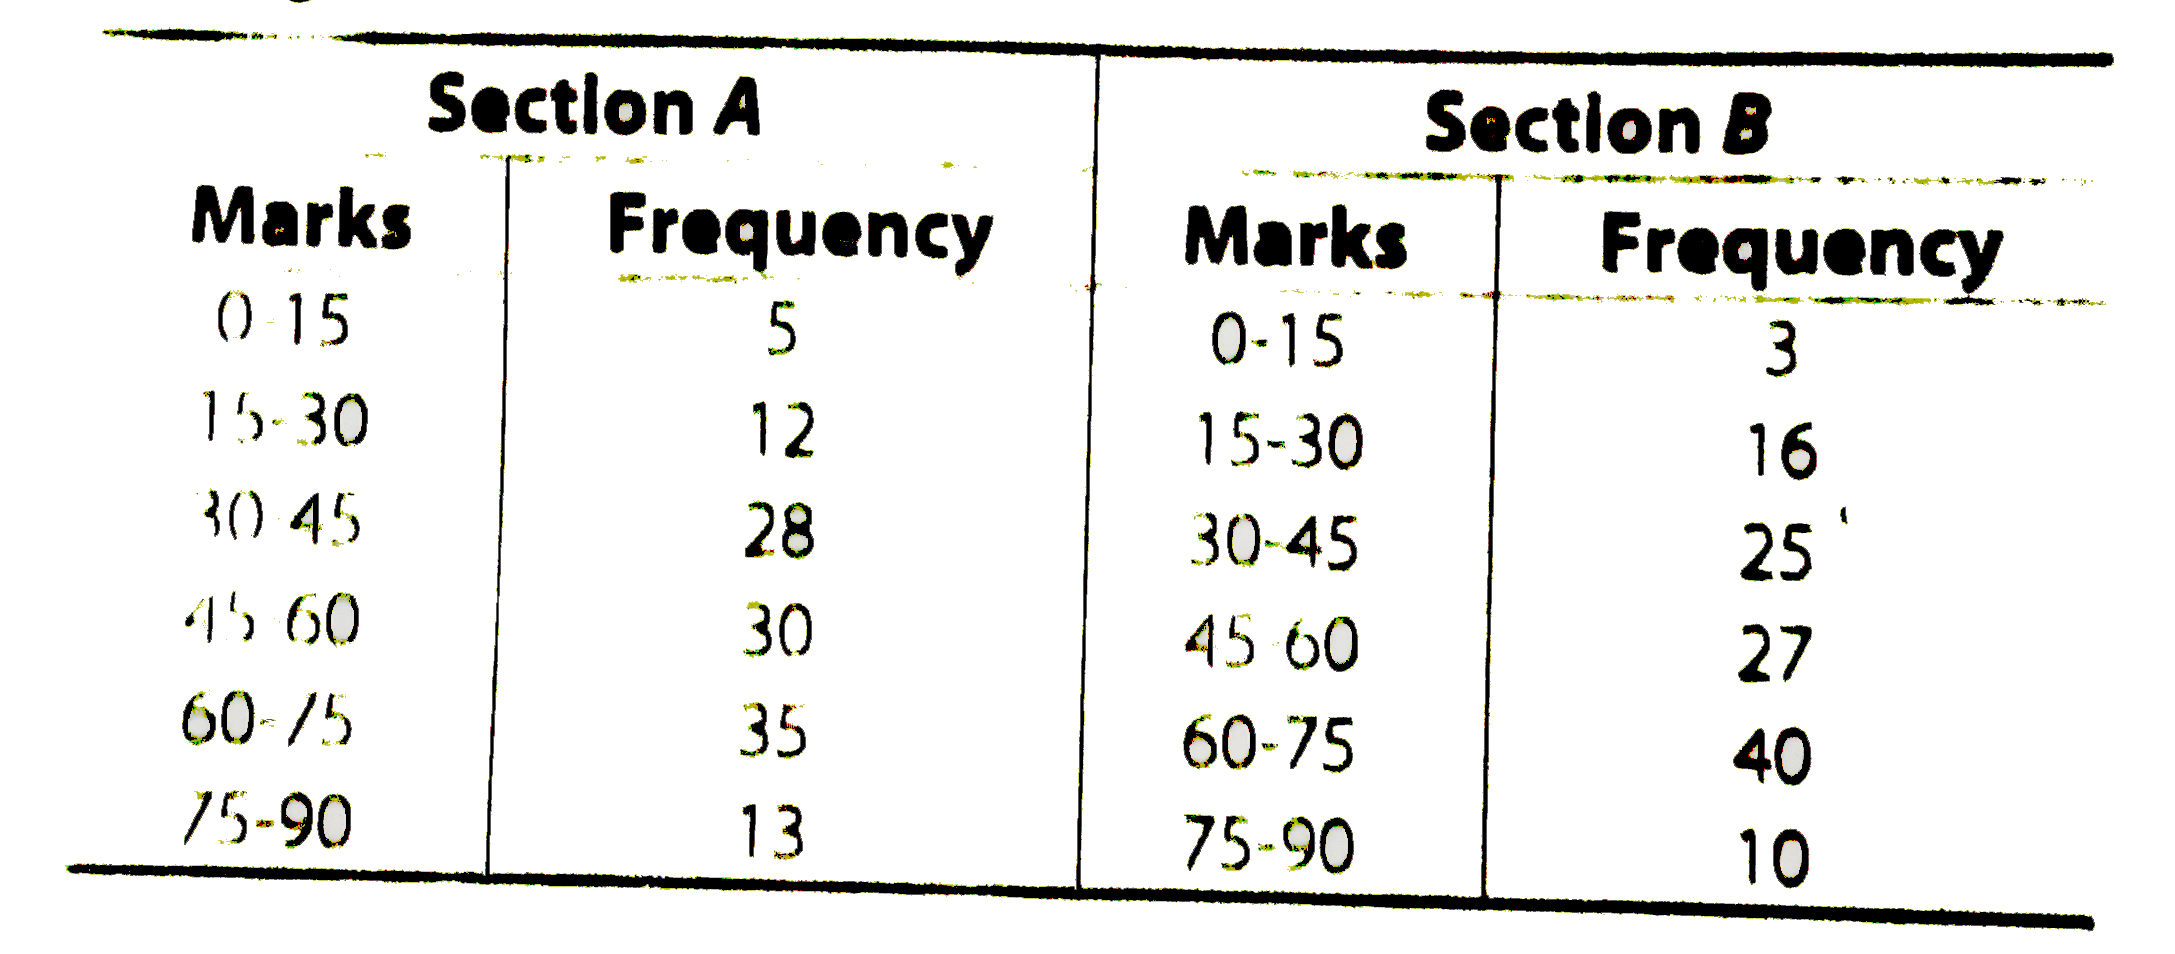
Represent the marks of the students of both the sections on the same graph by two frequency polygons. What do you observe?
Firstly, we find the mid marks of the given sections A and B by using the formula
Class mark =Lower limit + Upper limit2
So, the new table for section A and section B is shown below.
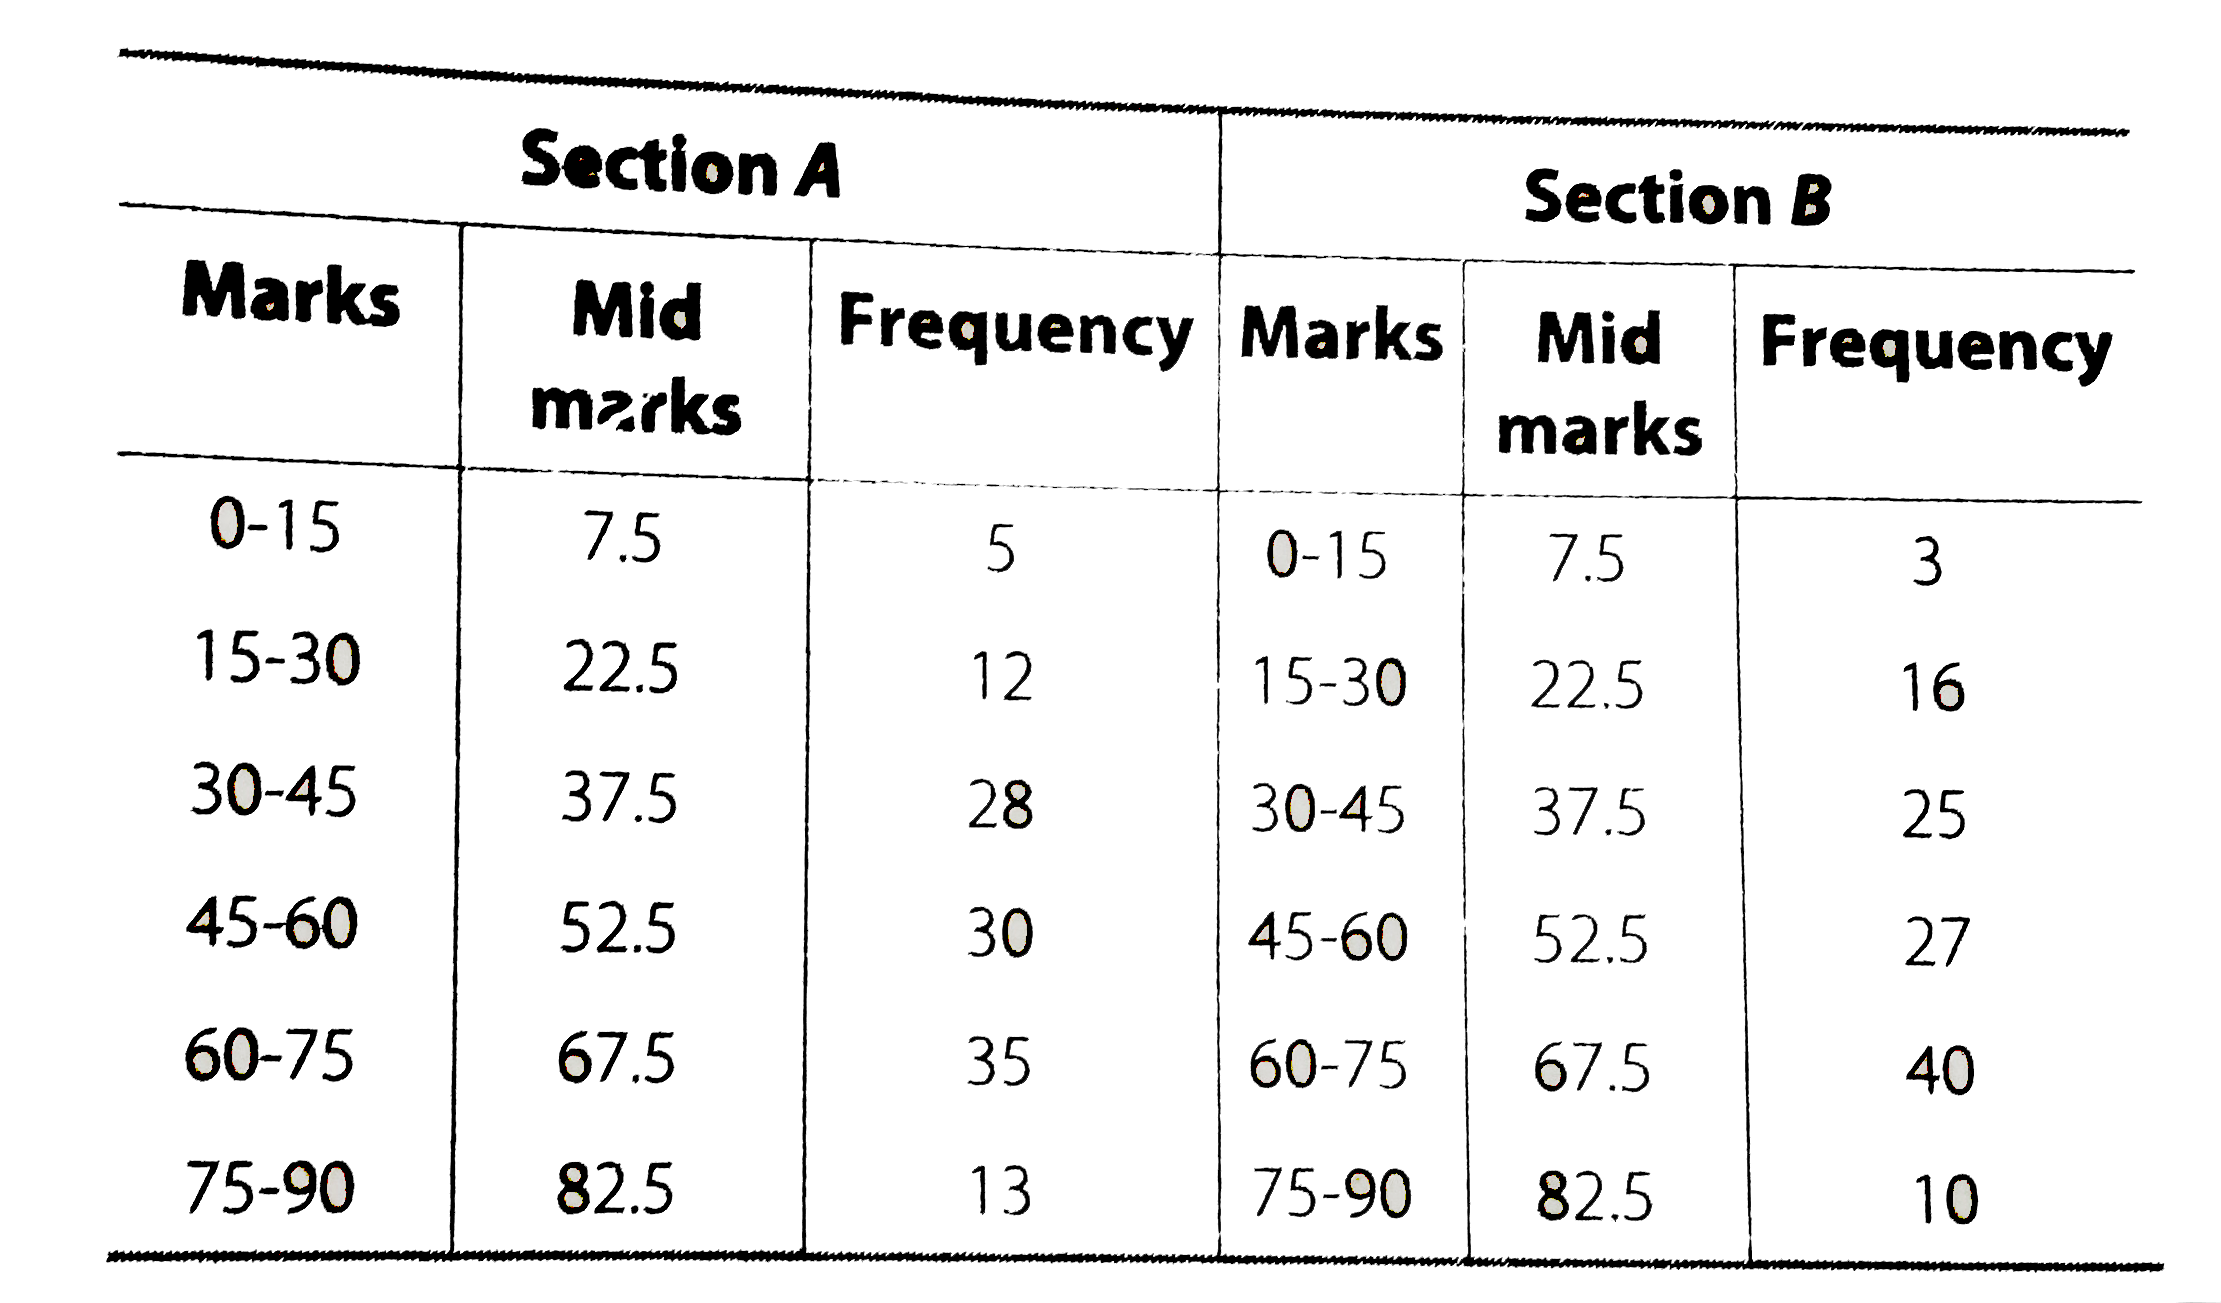
We can draw a frequency polygon by plotting the class marks along the horizontal axis and the frequency along the vertical axis.
Now, plotting all the points A(7,5,5), B(22.5,12), C(37.5,28), D(52.5, 30), E(67.5, 35), F(82.5, 13) for section A.
Also, plotting all the pints H(7.5,3), I(22.5,16), J(37.5,25), K(52.5,27), L(67.5, 40) and M(82.5, 10) for section B.
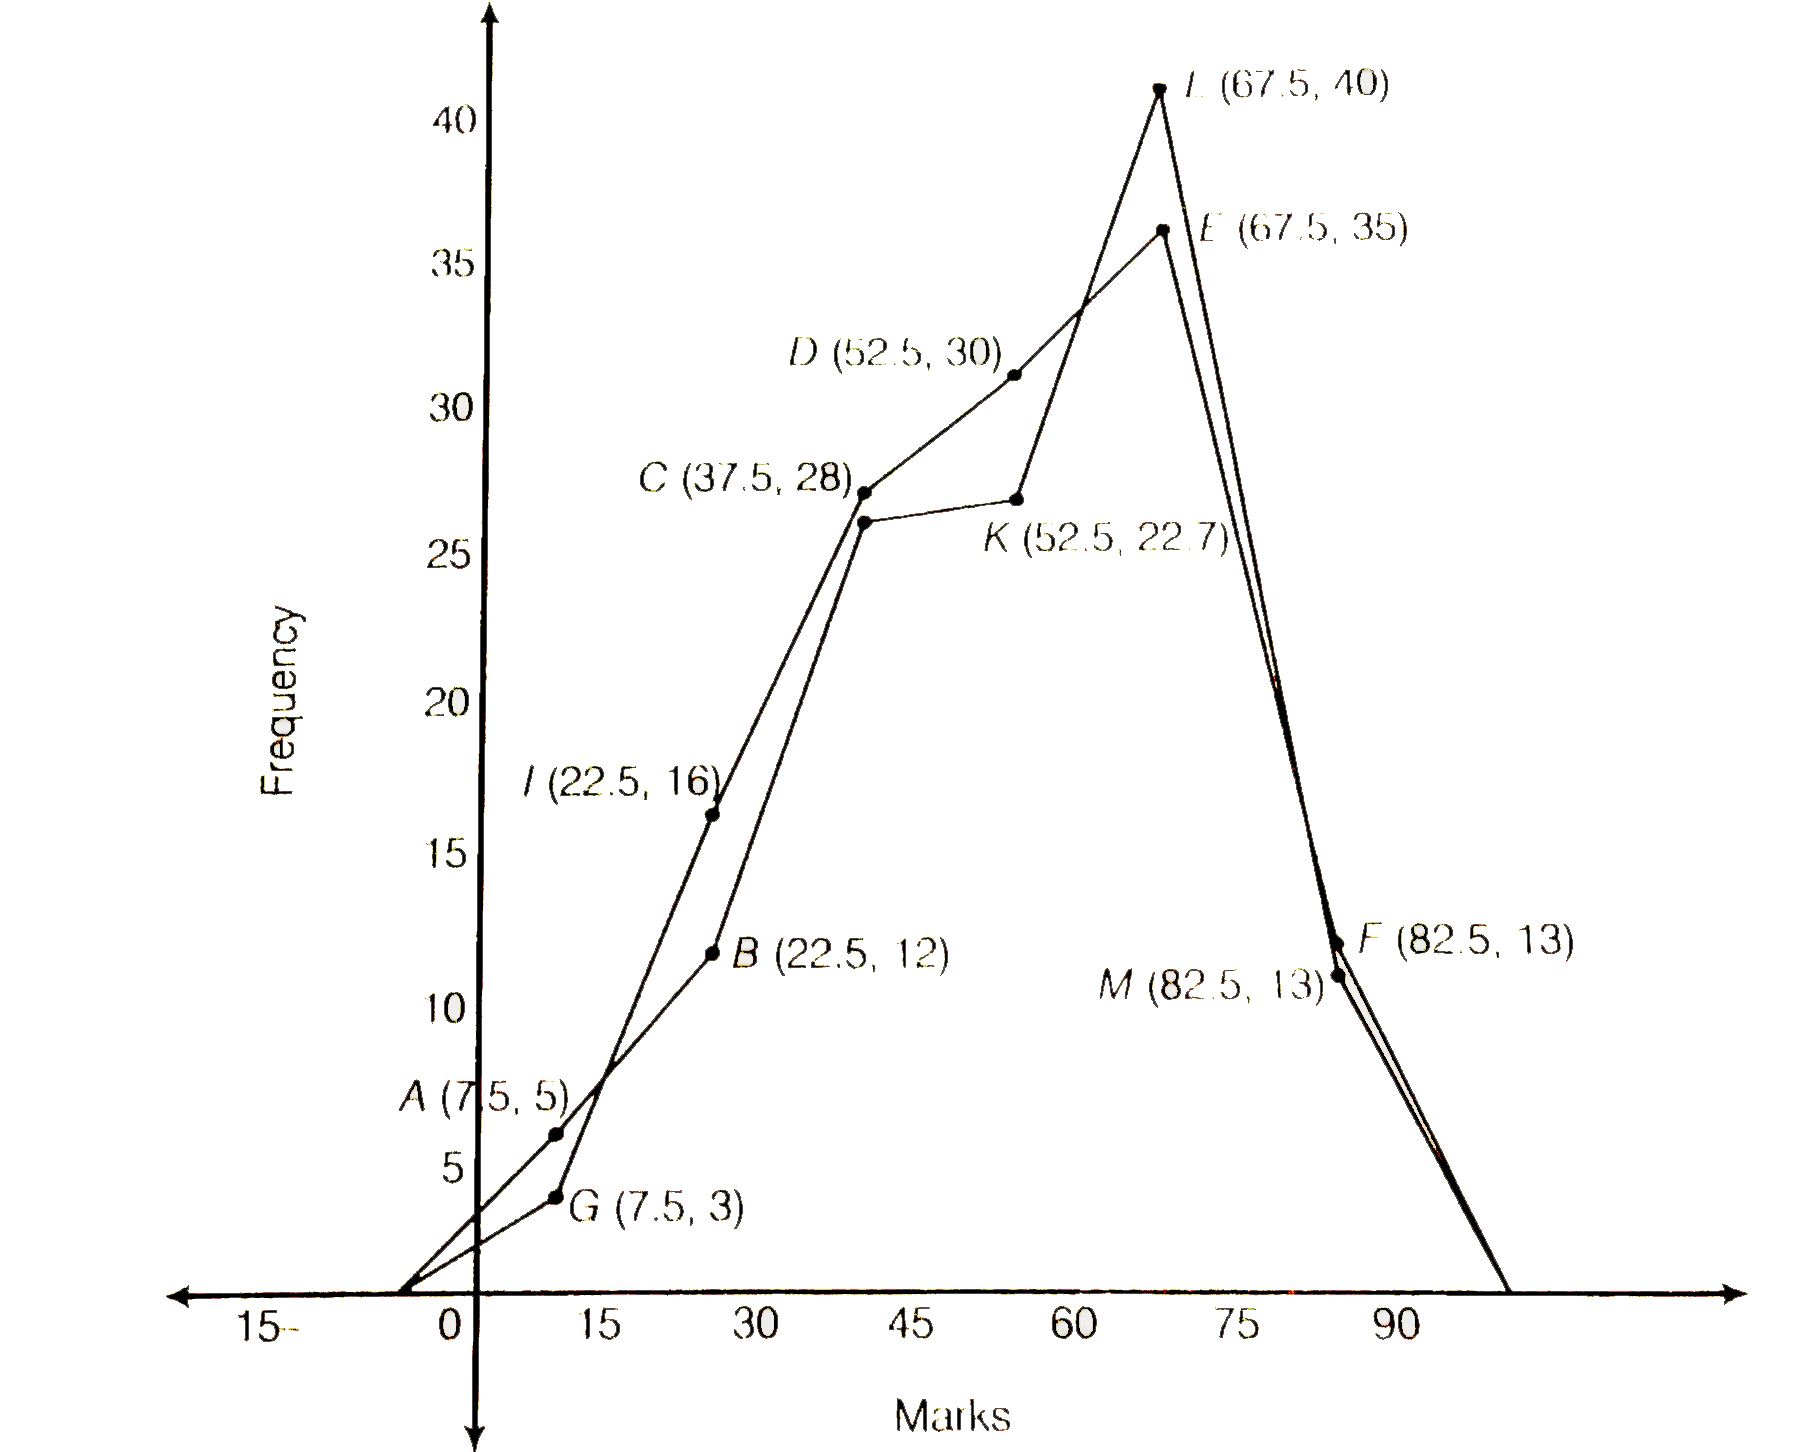
It is clear from the graph that maximum marks 67.5 score by 40 students in section B.
Topper's Solved these Questions
- STATISTICS AND PROBABILITYBOOK - NCERT EXEMPLARCHAPTER - STATISTICS AND PROBABILITYEXERCISE - LONG ANSWER TYPE QUESTIONS
5 Videos
- QUADRILATERALS BOOK - NCERT EXEMPLARCHAPTER - QUADRILATERALS EXERCISE - Quadrilaterals
56 Videos
- TRIANGLESBOOK - NCERT EXEMPLARCHAPTER - TRIANGLESEXERCISE - Triangles
55 Videos
Similar Questions
The following table gives the distribution of students of two sections according to the marks obtained by them. Represent the marks of the students of botht the sections on the same graph by two frequency polygon. From the two polygons compare the performance of the two sections.
View SolutionThe following table gives the distribution of students of two sections according to the marks obtained by them

Represent the marks of the students of both the sections on the same graph by two frquency polygons. From the two polygons compare the performance of the two sections.
View Solution
Knowledge Check
The table shows the marks obtained by 25 students in a class test. Find the mean of the marks obtained
 A7.72B7.65C7.4D7
The following table represent marks obtained by 100 students in a test.

Find mean marks of the students.
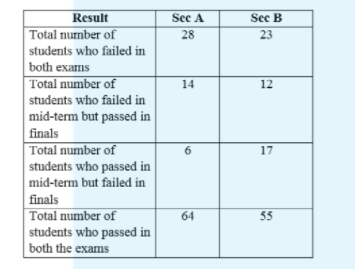
View SolutionThe below table gives the details of the number of students in Class 10, section A and B who had taken mid-term and final exam. What is the total number of students in both, section A and B?
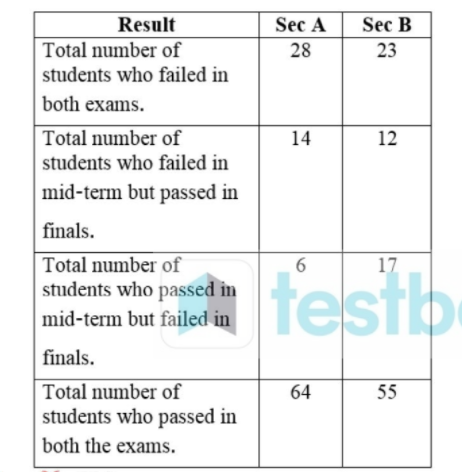
View SolutionThe following table gives the details of the number of students in Class 10 section A and B who had taken mid-term and final exam. The percentage of students in section A is _________ (round to one decimal).
View SolutionThe frequency distribution of marks obtained by students in a class test is given below .
Draw frequency polygon and ogive.

View SolutionThe following table shows frequency distribution of marks of 100 students of 10th class which they obtianed in a practice examination. Find the median of the marks.

View SolutionIf the average marks of 30 students of section A is 55 and the average marks of 30 students of section B is 60 ,then find the combined average of both the sections.
View SolutionIf the average marks of 30 students of section A is 55 and the average marks of 30 students of section B is 60 ,then find the combined average of both the sections.
View Solution
