For an experiement in Botany, two different plants, plant A and plant B were grown under similar laboratory conditions. Their heigths were measured at the end of each week for 3 weeks. The results are shown by the following graph.
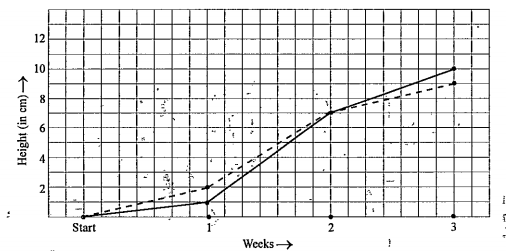
How high was Plant A after (i) 2 weeks (ii) 3 weeks?Solution in Assamese
Step by step video & image solution for For an experiement in Botany, two different plants, plant A and plant B were grown under similar laboratory conditions. Their heigths were measured at the end of each week for 3 weeks. The results are shown by the following graph. How high was Plant A after (i) 2 weeks (ii) 3 weeks? by Maths experts to help you in doubts & scoring excellent marks in Class 8 exams.
Topper's Solved these Questions
Similar Questions
Find the common factors of the given terms.
12x,3604:38View SolutionSolve the following equations.
x−2=707:11View SolutionFor an experiment in Botany, two different plants, plant A and plant B were grown under similar laboratory conditions. Their heights were measured at the end of each week for 3 weeks. The results are shown by the following graph.(a) How high was Plant A after (i) 2 weeks (ii) 3 weeks?(b) How high was Plant B after (i) 2 weeks (ii) 3 weeks?(c) How much did Plant A grow during the 3rd week?(d) How much did Plant B grow from the end of the 2nd week to the end of the 3rd week?(e) During which week did Plant A grow most?(f) During which week did Plant B grow least?(g) Were the two plants of the same height during any week shown here? Specify.
06:58View SolutionFor an experiment in botany, two different plants, plant A and B, were grown under similar laboratory conditions. Their heights were measured at the end of each week for three weeks. The results are shown by the line graph given below :
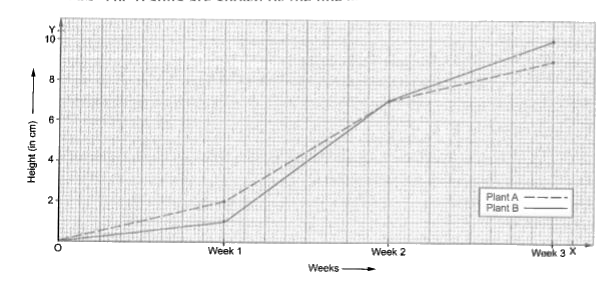
Study the above line graph carefully and answer the questions given below:
(i) How high was plant A after (a)2 weeks (b)3 weeks ?
(ii) How high was plant B after (a)2 weeks (b)3 weeks?
(iii) How much did plant A grow during the 3rd week?
(iv) How much did plant B grow from the end of the 2nd week to the end of the 3rd week ?
(v) During which week did plant A grow most ?
(vi) During which week did plant B grow least ?
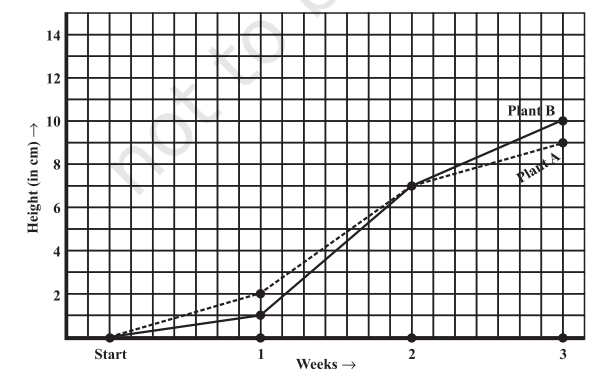
(vii) Were the two plants of the same height during any week shown here ? Specify.02:42View SolutionFor an experiment in Botany, two different plants, plant A and plant B were grown under similar laboratory conditions. Their heights were measured at the end of each week for 3 weeks. The results are shown by the following graph.(a) How high was Plant A after (i) 2 weeks (ii) 3 weeks?(b) How high was Plant B after (i) 2 weeks (ii) 3 weeks?(c) How much did Plant A grow during the 3rd week?(d) How much did Plant B grow from the end of the 2nd week to the end of the 3rd week?(e) During which week did Plant A grow most?(f) During which week did Plant B grow least?(g) Were the two plants of the same height during any week shown here? Specify.
 03:26View Solution
For an experiment in Botany, two different plants, plant A and plant B were grown under similar laboratory conditions. Their heigths were measured at the end of each week for 3 weeks. The results are shown by the following graph.
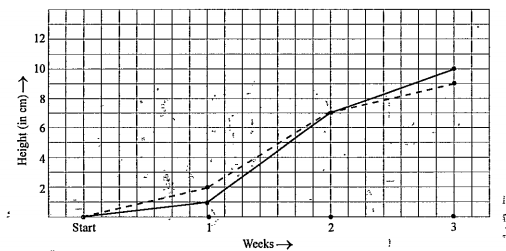
How much did Plant A grow during the 3rd week?05:06View SolutionFor an experiement in Botany, two different plants, plant A and plant B were grown under similar laboratory conditions. Their heigths were measured at the end of each week for 3 weeks. The results are shown by the following graph.
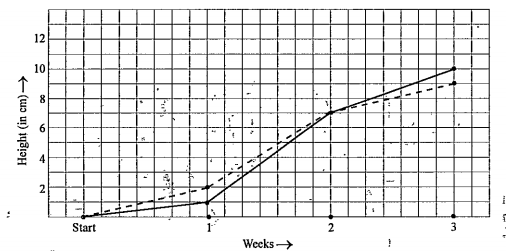
How much did Plant B grow from the end of the 2nd week to the end of the 3rd week?04:47View SolutionFor an experiment in Botany, two different plants, plant A and plant B were grown under similar laboratory conditions. Their heigths were measured at the end of each week for 3 weeks. The results are shown by the following graph.
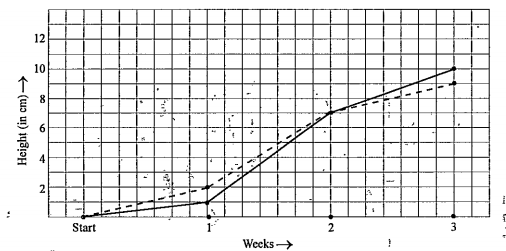
During which week did Plant A grow most?03:00View SolutionFor an experiement in Botany, two different plants, plant A and plant B were grown under similar laboratory conditions. Their heigths were measured at the end of each week for 3 weeks. The results are shown by the following graph.
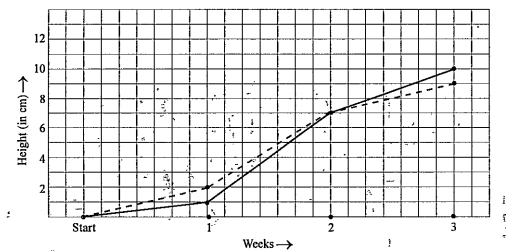
During which week did Plant B grow least?01:39View SolutionFor an experiment in Botany, two different plants, plant A and plant B were grown under similar laboratory conditions. Their heigths were measured at the end of each week for 3 weeks. The results are shown by the following graph.
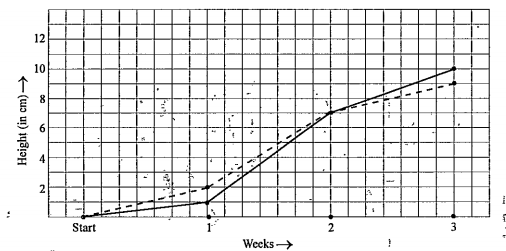
Were two Plants of the same height during any week shown here? Specify.01:59View SolutionFor an experiment in Botany, two different plants, plant A and plant B were grown under similar laboratory conditions. Their heights were measured at the end of each week for 3 weeks. The results are shown by the following graph.
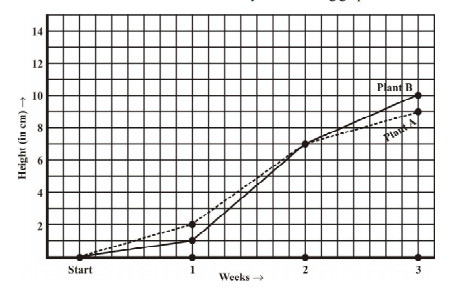 Were the two plants of the same height during any week shown here? Specify03:45View Solution
वनस्पति विज्ञान के एक प्रयोग में समान प्रयोशाला परिस्थितियों में दो पौधे A तथा B उगाए गए। तीन सप्ताहों तक उनकी ऊँचाइयों को हर सप्ताह के अन्त में मापा गया। परिणामों को निम्न आलेख में दर्शाया गया है:
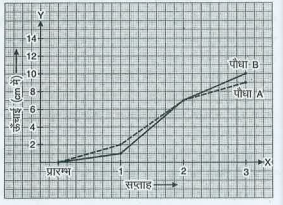 3 सप्ताह बाद पौधे B की ऊँचाई कितनी थी?03:01View Solution
वनस्पति विज्ञान के एक प्रयोग में समान प्रयोशाला परिस्थितियों में दो पौधे A तथा B उगाए गए। तीन सप्ताहों तक उनकी ऊँचाइयों को हर सप्ताह के अन्त में मापा गया। परिणामों को निम्न आलेख में दर्शाया गया है:
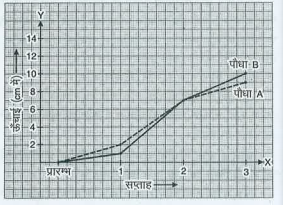
दूसरे सप्ताह के अन्त से तीसरे सप्ताह के अन्त तक पौधे B की ऊँचाई कितनी बढ़ी?03:57View SolutionFor an experiment in Botany,two different plants, plant A nad plant B were grown under similar laboratory conditions.Their heights were measured at the end of each week for 3 weeks.The results are shown by the following graph.
During which week did Plant A grow most?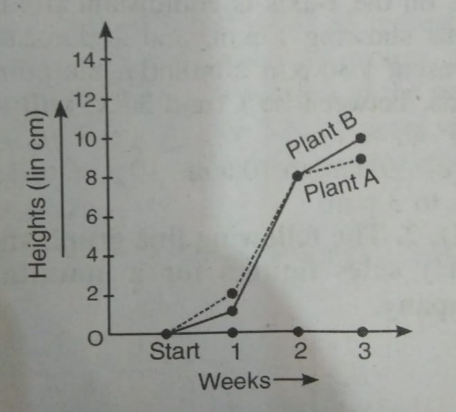 03:01View Solution
For an experiment in Botany,two different plants, plant A nad plant B were grown under similar laboratory conditions.Their heights were measured at the end of each week for 3 weeks.The results are shown by the following graph.
Were the two plants of the same height during any week shown here ?Specify.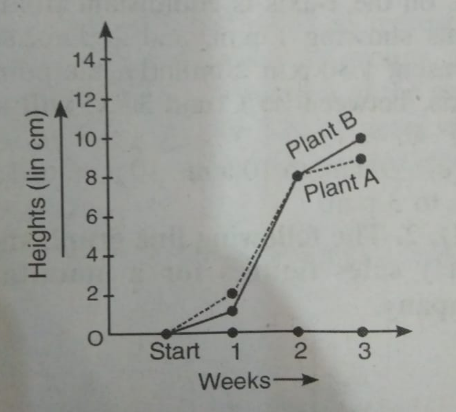 02:35View Solution
For an experiment in Botany,two different plants, plant A nad plant B were grown under similar laboratory conditions.Their heights were measured at the end of each week for 3 weeks.The results are shown by the following graph.
During which week did Plant A grow most? 03:01View Solution

