If P=[2005200420042005], then find X such that PX=XP=P.
The correct Answer is:[1001]
Step by step video, text & image solution for If P={:[(2005,2004),(2004,2005)]:}, then find X such that PX=XP=P. by Maths experts to help you in doubts & scoring excellent marks in Class 9 exams.
Updated on:21/07/2023Topper's Solved these Questions
- MATRICESBOOK - PEARSON IIT JEE FOUNDATIONCHAPTER - MATRICESEXERCISE - CONCEPT APPLICATION LEVEL 1
30 Videos
- MATRICESBOOK - PEARSON IIT JEE FOUNDATIONCHAPTER - MATRICESEXERCISE - LEVEL 2
20 Videos
- MATRICESBOOK - PEARSON IIT JEE FOUNDATIONCHAPTER - MATRICESEXERCISE - SHORT ANSWER TYPE QUESTIONS
9 Videos
- LOGARITHMSBOOK - PEARSON IIT JEE FOUNDATIONCHAPTER - LOGARITHMSEXERCISE - Level 3 MCQ
15 Videos
- NUMBER SYSTEMSBOOK - PEARSON IIT JEE FOUNDATIONCHAPTER - NUMBER SYSTEMSEXERCISE - Level 3
15 Videos
Similar Questions
The following table shows the amount of rice grown by a farmer in different years: Years:, 2000, 2001, 2002, 2003, 2004, 2005, 2006 Rice grown (in quintals):, 200, 180, 240, 260, 250, 200, 270 Plot a graph to illustrate this information.
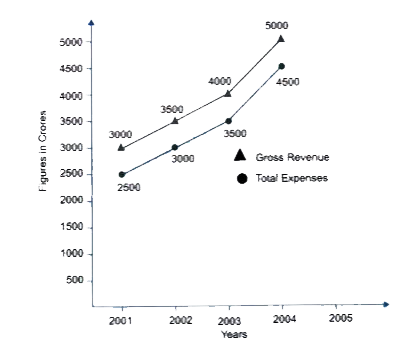
View SolutionThe Line graph given below represents Railway Finance from 2001-2002 to 2004-2005 (Northern Zone). It breaks down the gross revenue collected as well as the total expenses incurred during these years. Summarise and write an analytic paragraph highlighting the general trend and necessary details. Compare wherever relevant.

View Solution
Knowledge Check
Given the sequence of numbers x1,x2,x3,x4,….,x2005, x1x1+1=x2x2+3=x3x3+5=...=x2005x2005+4009, the nature of the sequence is
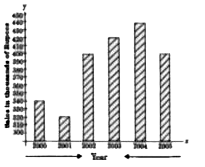
AA.P.BG.P.CH.P.DNone of theseThe following bar diagram analys the sale of a company from 2000 to 2005, Examine the diagram and answer the questions.

The sales in 2004 are what percentage of those in 2002?A40%B4%C110%D1.1%
The following table shows the sales of a commodity during the years 2000 to 2006. Years:, 2000, 2001, 2002, 2003, 2004, 2005, 2006 Sales (in lakhs of Rs.), 1.5, 1.8, 2.4, 3.2, 5.4, 7.8, 8.6 Draw a graph of this information.
View SolutionIf P=⎡⎢⎣√32120−12√32⎤⎥⎦,A=[1101]andQ=PAPT,thenPTQ2005P is: (A) [1200501] (B) [1200520051] (C) [1020051] (D) [1001]
View SolutionThe following table shows the number of patients discharged from a hospital with HIV diagnosis in different years: Years:, 2002, 2003, 2004, 2005, 2006 No. of Patients:, 150, 170, 195, 225, 230 Represent this information by a graph.
View SolutionThe cost of living index in the year 2006, taking 2004 as the base year, on certain commodities is 162.75. If the total expenditure in 2004 was Rs. 12,500, then find the total cost for the same commodities in the year 2006.
View SolutionUse the tables below to draw linear graphs. (a) The number of days a hill side city received snow in different years. Years 2003,2004,2005and2006 and Days 8,10,5,and12 (b) Population (in thousands) of men and women in a village in different years.
View SolutionIf (1+px)n=1+8x+24x2+..., then find p−np+n
View Solution
