In a frequency distribution, the mid values of a class is and width of the class is . The lower limit of the class is
6.5
7.5
8.5
12
The correct Answer is:B
To find the lower limit of the class given the mid value and the width of the class, we can follow these steps:
1. Identify the given values:
- Mid value (M) = 10
- Width of the class (W) = 6
2. Use the formula for the lower limit:
The formula to find the lower limit (L) of the class is:
L=M−W2
3. Substitute the values into the formula:
L=10−62
4. Calculate the width divided by 2:
62=3
5. Subtract this value from the mid value:
L=10−3=7
6. Conclusion:
The lower limit of the class is 7.
- Mid value (M) = 10
- Width of the class (W) = 6
The formula to find the lower limit (L) of the class is:
L=M−W2
L=10−62
62=3
L=10−3=7
The lower limit of the class is 7.
Topper's Solved these Questions
- BOOK - NCERT EXEMPLAR ENGLISHCHAPTER - STATISTICS AND PROBABILITYEXERCISE - VERY SHORT ANSWER TYPES QUESTIONS10videos
STATISTICS AND PROBABILITY
- BOOK - NCERT EXEMPLAR ENGLISHCHAPTER - STATISTICS AND PROBABILITYEXERCISE - SHORT ANSWER TYPE QUESTIONS20videos
STATISTICS AND PROBABILITY
- BOOK - NCERT EXEMPLAR ENGLISHCHAPTER - QUADRILATERALS EXERCISE - LONG ANSWER TYPE QUESTIONS18videos
QUADRILATERALS
- BOOK - NCERT EXEMPLAR ENGLISHCHAPTER - TRIANGLESEXERCISE - LONG ANSWER TYPE QUESTIONS21videos
TRIANGLES
Similar Questions
In a frequency distribution, the mid-value of a class is 15 and the class intervals is 4. The lower limit of the class is 10 (b) 12 (c) 13 (d) 14
View SolutionThe width of each of five continuous classes in a frequency distribution is 5 and the lower class limit of the lowest class is 10. The upper class limit of the highest class is
View SolutionFor the following distribution

the modal class isView SolutionLet l be the lower class limit of a class-interval in a frequency distribution and m be the mid-point of the class. Then, the upper class limit of the class is (a) m+l+m2 (b) l+m+12 (c) 2m−l (d) (m−2l)
View SolutionThe table given below shows a frequency distribution table, find
(a) Upper limit of third class (b) Lower limit of fifth class
(c) Class size (d) Class mark of third class
 View Solution
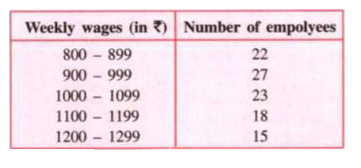
The table , given below , shows the frequency distributions of the weekly wages of the employee of a company:

Find :
(i) the lower limit of the fourth class.
(ii) the upper limit of the fifth class.
(iii) the class boundaries of the second class.
(iv) the class mark of the first class.
(v) the class size of the third class.
(vi) cumulative frequency of the fourth class.View SolutionThe following are weights (in kg) of 50 children taken at the time of birth:

Make an inclusive form grouped frequency distribution table with 0.3 kg as the width of ' each class.
Also, find the true class limits of each class.View SolutionFrom a frequency distribution, c = 3, l = 65 . 5 f = 42, m = 23, N = 102 then median is (l = lower limit of the median class, m= cumulative frequency of the class preceeding the median class, N = total frequency, f = frequency of the median class, c = width of the median class)
View SolutionThe width of each of nine classes in a frequency distribution is 2.5 and the lower class boundary of the lowest class 10.6. Then the upper class boundary of the highest class is (a) 35.6 (b) 33.1 (c) 30.6 (d) 28.1
View SolutionConsider the data

The frequency of the upper limit of the median class and the lower limit of the modal class isView Solution

