In a village six fruit merchants sold the following number of fruit baskets in a particular season : Observe this pictograph and answer the following questions : (a) Which merchant sold the maximum number of baskets? (b) How many fruit baskets were sold by Anwar? (c) The merchants who have sold 600 or more number of baskets are planning to buy a godown for the next season. Can you name them?
To solve the problem based on the given pictograph, we will follow these steps:
Step 1: Understand the Pictograph
The pictograph shows the number of fruit baskets sold by six merchants. Each symbol (basket) represents 100 fruit baskets.
Step 2: Calculate the Number of Baskets Sold by Each Merchant
1. Rahim: 4 symbols → 4 x 100 = 400 baskets
2. Lakhanpal: 5 symbols and 1/2 symbol → 5 x 100 + 50 = 550 baskets
3. Anwar: 7 symbols → 7 x 100 = 700 baskets
4. Martin: 9 symbols and 1/2 symbol → 9 x 100 + 50 = 950 baskets
5. Ranjit Singh: 8 symbols → 8 x 100 = 800 baskets
6. Joseph: 4 symbols and 1/2 symbol → 4 x 100 + 50 = 450 baskets
Step 3: Answer the Questions
(a) Which merchant sold the maximum number of baskets?
- From our calculations, Martin sold the maximum number of baskets (950).
(b) How many fruit baskets were sold by Anwar?
- Anwar sold 700 baskets.
(c) Which merchants sold 600 or more baskets?
- The merchants who sold more than 600 baskets are:
- Anwar (700 baskets)
- Martin (950 baskets)
- Ranjit Singh (800 baskets)
Summary of Answers
- (a) Martin sold the maximum number of baskets.
- (b) Anwar sold 700 baskets.
- (c) The merchants who sold 600 or more baskets are Anwar, Martin, and Ranjit Singh.
---
The pictograph shows the number of fruit baskets sold by six merchants. Each symbol (basket) represents 100 fruit baskets.
1. Rahim: 4 symbols → 4 x 100 = 400 baskets
2. Lakhanpal: 5 symbols and 1/2 symbol → 5 x 100 + 50 = 550 baskets
3. Anwar: 7 symbols → 7 x 100 = 700 baskets
4. Martin: 9 symbols and 1/2 symbol → 9 x 100 + 50 = 950 baskets
5. Ranjit Singh: 8 symbols → 8 x 100 = 800 baskets
6. Joseph: 4 symbols and 1/2 symbol → 4 x 100 + 50 = 450 baskets
(a) Which merchant sold the maximum number of baskets?
- From our calculations, Martin sold the maximum number of baskets (950).
- Anwar sold 700 baskets.
- The merchants who sold more than 600 baskets are:
- Anwar (700 baskets)
- Martin (950 baskets)
- Ranjit Singh (800 baskets)
- (a) Martin sold the maximum number of baskets.
- (b) Anwar sold 700 baskets.
- (c) The merchants who sold 600 or more baskets are Anwar, Martin, and Ranjit Singh.
Topper's Solved these Questions
Similar Questions
In a village six fruit merchants sold the following number of fruit baskets in a particularseason :Observe this pictograph and answer the following questions :(a) Which merchant sold the maximum number of baskets?(b) How many fruit baskets were sold by Anwar?(c) The merchants who have sold 600 or more number of baskets are planning to buya godown for the next season. Can you name them?
View SolutionFollowing pictograph shows the number of tractors in five villages. Observe the pictograph and answer the following questions. (i) Which village has the minimum number of tractors? (ii) Which village has the maximum number of tractors? (iii) How many more tractors village C has as compared to village B. (iv) What is the total number of tractors in all the five villages?
View Solution
Knowledge Check
- Question 1 - Select One
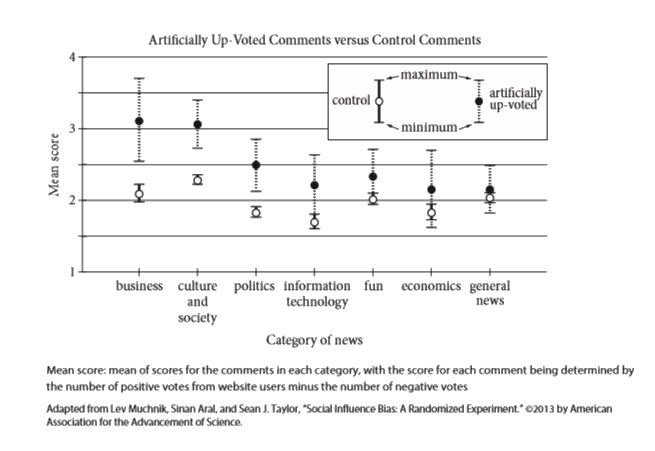
The 'wisdom of crowds" has become a mantra of the Internet age. Need to choose a new vacuum cleaner? Check out the reviews on online merchant Line Amazon. But a new study suggests that such online s scores don't always reveal the best choice. A massive controlled experiment of Web users finds that such ratings are highly susceptible to irrational "herd behavior' —and that the herd can be manipulated. Sometimes the crowd really is wiser than you. The to classic examples are guessing the weight of a bull or the number of gumballs in a jar. Your guess is probably going to be far from the mark, whereas the average of many people's choices is remarkably close to the true number. 15 But what happens when the goal is to judge something less tangible, such as the quality or worth of a product? According to one the, the wisdom of the crowd still holds—measuring ihe aggregate of people's opinions produces a stable, reliable 20 value, Skeptics, however, argue that people's opinions are easily swayed by those of others. So nudging a crowd early on by presenting contrary opinions—for example, exposing them to some very good or very bad attitudes—will steer the crowd in a 15 different direction. To test which hypothesis is true, you would need to manipulate huge numbers of people, exposing them to false information and determining how it affects their opinions. A team led b-y Sinan Aral, a network scientist at 30 the Massachusetts institute .of Technology in Cambridge, did exactly t lee Aral has been secretly . working with a popular website that aggregates news stories. The website allows users to make comments about news stories and vote each other's comments 55 up or down. The vote tallies ale visible as a number next to each comment , and the position of the comments is chronological. (Stories on the site get an average of about ten comments and about three votes per comment.)It’s a follow-up to his experiment using people’sratings of movies to measure how much individual people influence each other online (answer:alot).This time,he wanted to know how much the crowd influences the individual,and whether it can be controlled from outside.
For five months,every comment submitted by a user randomly received an“up”vote(positive),a “down”vote(negative),or as a control,no vote at all The team then observes! how users rated those comments. The users generated more than so 100,000 comments that were viewed more than 10 million times and rated more than 300,000 times by other users.
At least when it comes to comments on news sites, the crowd is more herdlike than wise. 55 Comments that received fake positive votes from the researchers were 32% more Likely to receive more positive votes compared with a control, the team reports. And those comments were no more likely than the control to be down-voted by the next viewer 60 to see them. By the end of the study, positively manipulated comments got an overall boost of about 25%. However, the same did not hold true for negative manipulation. The ratings of comments that got a fake down vote were usually negated by an up vote by the next user to see them. "Our experiment does not reveal the psychology behind people's decisions," Aral says, "but an intuitive explanation is that people are more skeptical of negative social influence. They're more 70 willing to go along with positive opinions from other people." - • -Duncan Watts, a network scientist at Microsoft Research in New York City, agrees with that conclusion. But] one question is whether the 75 positive 'herding] bias is specific to this site" or true in general, Watts says. lie points out that the category of the news items in the experiment had a strong effect on how much people could be manipulated. "I would have thought that 'business' is so pretty similar to 'economics,' yet they find a much stronger effect (almost 50% stronger) for the former • than the latter. What explains this difference? If we're going to apply these findings in the real world, we'll need to know the answers.Will companies be able to boost their products by manipulating online ratings on a massive scale? “That is easier said than done,”Wattssays.If people detect—or learn—that comments on a website are being manipulated,the herd may spook and leave entirely.

Over the course of the passage, the main focus shifts from a discussion of an experiment and its results toAan explanation of the practical applications of the resultsBa consideration of the questions prompted by the resultsCananalysis of the defects undermining the results.Da conversation with a scientist who disputes the results - Question 2 - Select One
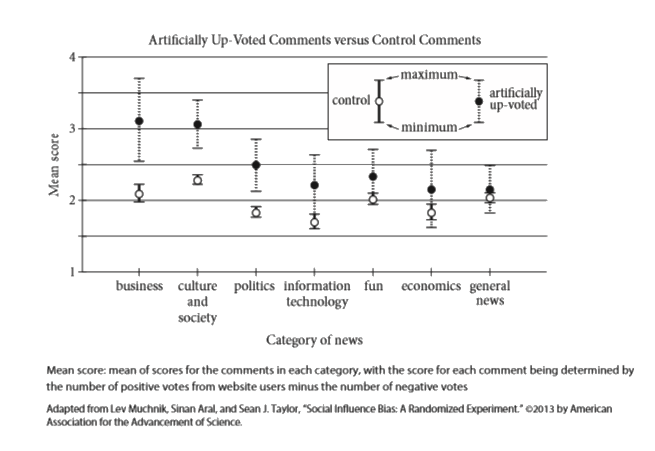
The 'wisdom of crowds" has become a mantra of the Internet age. Need to choose a new vacuum cleaner? Check out the reviews on online merchant Line Amazon. But a new study suggests that such online s scores don't always reveal the best choice. A massive controlled experiment of Web users finds that such ratings are highly susceptible to irrational "herd behavior' —and that the herd can be manipulated. Sometimes the crowd really is wiser than you. The to classic examples are guessing the weight of a bull or the number of gumballs in a jar. Your guess is probably going to be far from the mark, whereas the average of many people's choices is remarkably close to the true number. 15 But what happens when the goal is to judge something less tangible, such as the quality or worth of a product? According to one the, the wisdom of the crowd still holds—measuring ihe aggregate of people's opinions produces a stable, reliable 20 value, Skeptics, however, argue that people's opinions are easily swayed by those of others. So nudging a crowd early on by presenting contrary opinions—for example, exposing them to some very good or very bad attitudes—will steer the crowd in a 15 different direction. To test which hypothesis is true, you would need to manipulate huge numbers of people, exposing them to false information and determining how it affects their opinions. A team led b-y Sinan Aral, a network scientist at 30 the Massachusetts institute .of Technology in Cambridge, did exactly t lee Aral has been secretly . working with a popular website that aggregates news stories. The website allows users to make comments about news stories and vote each other's comments 55 up or down. The vote tallies ale visible as a number next to each comment , and the position of the comments is chronological. (Stories on the site get an average of about ten comments and about three votes per comment.)It’s a follow-up to his experiment using people’sratings of movies to measure how much individual people influence each other online (answer:alot).This time,he wanted to know how much the crowd influences the individual,and whether it can be controlled from outside.
For five months,every comment submitted by a user randomly received an“up”vote(positive),a “down”vote(negative),or as a control,no vote at all The team then observes! how users rated those comments. The users generated more than so 100,000 comments that were viewed more than 10 million times and rated more than 300,000 times by other users.
At least when it comes to comments on news sites, the crowd is more herdlike than wise. 55 Comments that received fake positive votes from the researchers were 32% more Likely to receive more positive votes compared with a control, the team reports. And those comments were no more likely than the control to be down-voted by the next viewer 60 to see them. By the end of the study, positively manipulated comments got an overall boost of about 25%. However, the same did not hold true for negative manipulation. The ratings of comments that got a fake down vote were usually negated by an up vote by the next user to see them. "Our experiment does not reveal the psychology behind people's decisions," Aral says, "but an intuitive explanation is that people are more skeptical of negative social influence. They're more 70 willing to go along with positive opinions from other people." - • -Duncan Watts, a network scientist at Microsoft Research in New York City, agrees with that conclusion. But] one question is whether the 75 positive 'herding] bias is specific to this site" or true in general, Watts says. lie points out that the category of the news items in the experiment had a strong effect on how much people could be manipulated. "I would have thought that 'business' is so pretty similar to 'economics,' yet they find a much stronger effect (almost 50% stronger) for the former • than the latter. What explains this difference? If we're going to apply these findings in the real world, we'll need to know the answers.Will companies be able to boost their products by manipulating online ratings on a massive scale? “That is easier said than done,”Wattssays.If people detect—or learn—that comments on a website are being manipulated,the herd may spook and leave entirely.

As used in line 85,"boost"most nearly meansAincreaseBaccelerateCpromoteDprotect - Question 3 - Select One
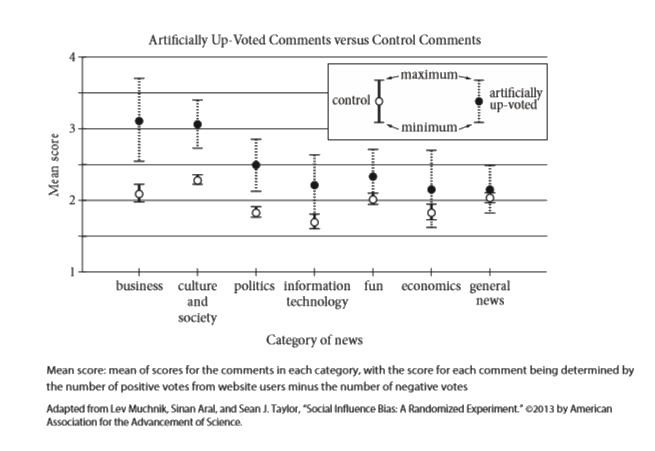
The 'wisdom of crowds" has become a mantra of the Internet age. Need to choose a new vacuum cleaner? Check out the reviews on online merchant Line Amazon. But a new study suggests that such online s scores don't always reveal the best choice. A massive controlled experiment of Web users finds that such ratings are highly susceptible to irrational "herd behavior' —and that the herd can be manipulated. Sometimes the crowd really is wiser than you. The to classic examples are guessing the weight of a bull or the number of gumballs in a jar. Your guess is probably going to be far from the mark, whereas the average of many people's choices is remarkably close to the true number. 15 But what happens when the goal is to judge something less tangible, such as the quality or worth of a product? According to one the, the wisdom of the crowd still holds—measuring ihe aggregate of people's opinions produces a stable, reliable 20 value, Skeptics, however, argue that people's opinions are easily swayed by those of others. So nudging a crowd early on by presenting contrary opinions—for example, exposing them to some very good or very bad attitudes—will steer the crowd in a 15 different direction. To test which hypothesis is true, you would need to manipulate huge numbers of people, exposing them to false information and determining how it affects their opinions. A team led b-y Sinan Aral, a network scientist at 30 the Massachusetts institute .of Technology in Cambridge, did exactly t lee Aral has been secretly . working with a popular website that aggregates news stories. The website allows users to make comments about news stories and vote each other's comments 55 up or down. The vote tallies ale visible as a number next to each comment , and the position of the comments is chronological. (Stories on the site get an average of about ten comments and about three votes per comment.)It’s a follow-up to his experiment using people’sratings of movies to measure how much individual people influence each other online (answer:alot).This time,he wanted to know how much the crowd influences the individual,and whether it can be controlled from outside.
For five months,every comment submitted by a user randomly received an“up”vote(positive),a “down”vote(negative),or as a control,no vote at all The team then observes! how users rated those comments. The users generated more than so 100,000 comments that were viewed more than 10 million times and rated more than 300,000 times by other users.
At least when it comes to comments on news sites, the crowd is more herdlike than wise. 55 Comments that received fake positive votes from the researchers were 32% more Likely to receive more positive votes compared with a control, the team reports. And those comments were no more likely than the control to be down-voted by the next viewer 60 to see them. By the end of the study, positively manipulated comments got an overall boost of about 25%. However, the same did not hold true for negative manipulation. The ratings of comments that got a fake down vote were usually negated by an up vote by the next user to see them. "Our experiment does not reveal the psychology behind people's decisions," Aral says, "but an intuitive explanation is that people are more skeptical of negative social influence. They're more 70 willing to go along with positive opinions from other people." - • -Duncan Watts, a network scientist at Microsoft Research in New York City, agrees with that conclusion. But] one question is whether the 75 positive 'herding] bias is specific to this site" or true in general, Watts says. lie points out that the category of the news items in the experiment had a strong effect on how much people could be manipulated. "I would have thought that 'business' is so pretty similar to 'economics,' yet they find a much stronger effect (almost 50% stronger) for the former • than the latter. What explains this difference? If we're going to apply these findings in the real world, we'll need to know the answers.Will companies be able to boost their products by manipulating online ratings on a massive scale? “That is easier said than done,”Wattssays.If people detect—or learn—that comments on a website are being manipulated,the herd may spook and leave entirely.

Which action would best address a question watts raises about the study?AProviding fever fake positive commentsBUsing multiple websites to collect ratingsCRequiring users to register on the website before votingDInforming users that voting data are being analyzed
The number of girl students in each class of a co-educational middle school is depicted by the pictograph Observe this pictograph and answer the following questions :(a) Which class has the minimum number of girl students?(b) Is the number of girls in Class VI less than the number of girls in Class V?(c) How many girls are there in Class VII?
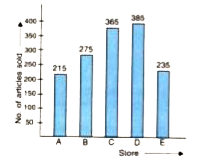
View SolutionThe given bar graph shows the number of identical articles sold by 5 different stores A, B, C, D and E during a particular month.

Study the bar graph and answer the following questions :
(i) Which store sold the largest number of articles ?
(ii) By what per cent is the sale of store D more than that of store B ?
(iii) Find the ratio of the total sale of the two highest selling stores to the total sale of the two least selling stores.
(iv) By how much must store E increase its sale to catch up with its nearest rival store ?View SolutionIn a particular section of Class IX, 40 students were asked about the months of their birth and the following graph was prepared for the data so obtained:Observe the bar graph given above and answer the following questions:(i) How many students were born in the month of November?(ii) In which month were the maximum number of students born?
View SolutionRead the bar graph shown in Figure and answer the following questions: What is the information given by the bar graph? How many tickets of Assam State Lottery were sold by the agent? Of which state, were the maximum number of tickets sold? State whether true or false. The maximum number of tickets sold is three times the minimum number of tickets sold. Of which state were the minimum number of tickets sold?
View SolutionTotal number of students of a school in different years is shown in the following table: Year, No. of Students 1996 1998 2000 2002 2004, 400 550 450 600 650 Represent the above data by a pictograph. Prepare a pictograph of students using one symbol an icon of a student to represent 100 students and answer the following questions: How many symbols represent total number of students in the year 2002? How many symbols represent total number of students in the year 1998? Prepare another pictograph of students using any other symbol each representing 50 students. Which pictograph do you find more informative?
View Solution

