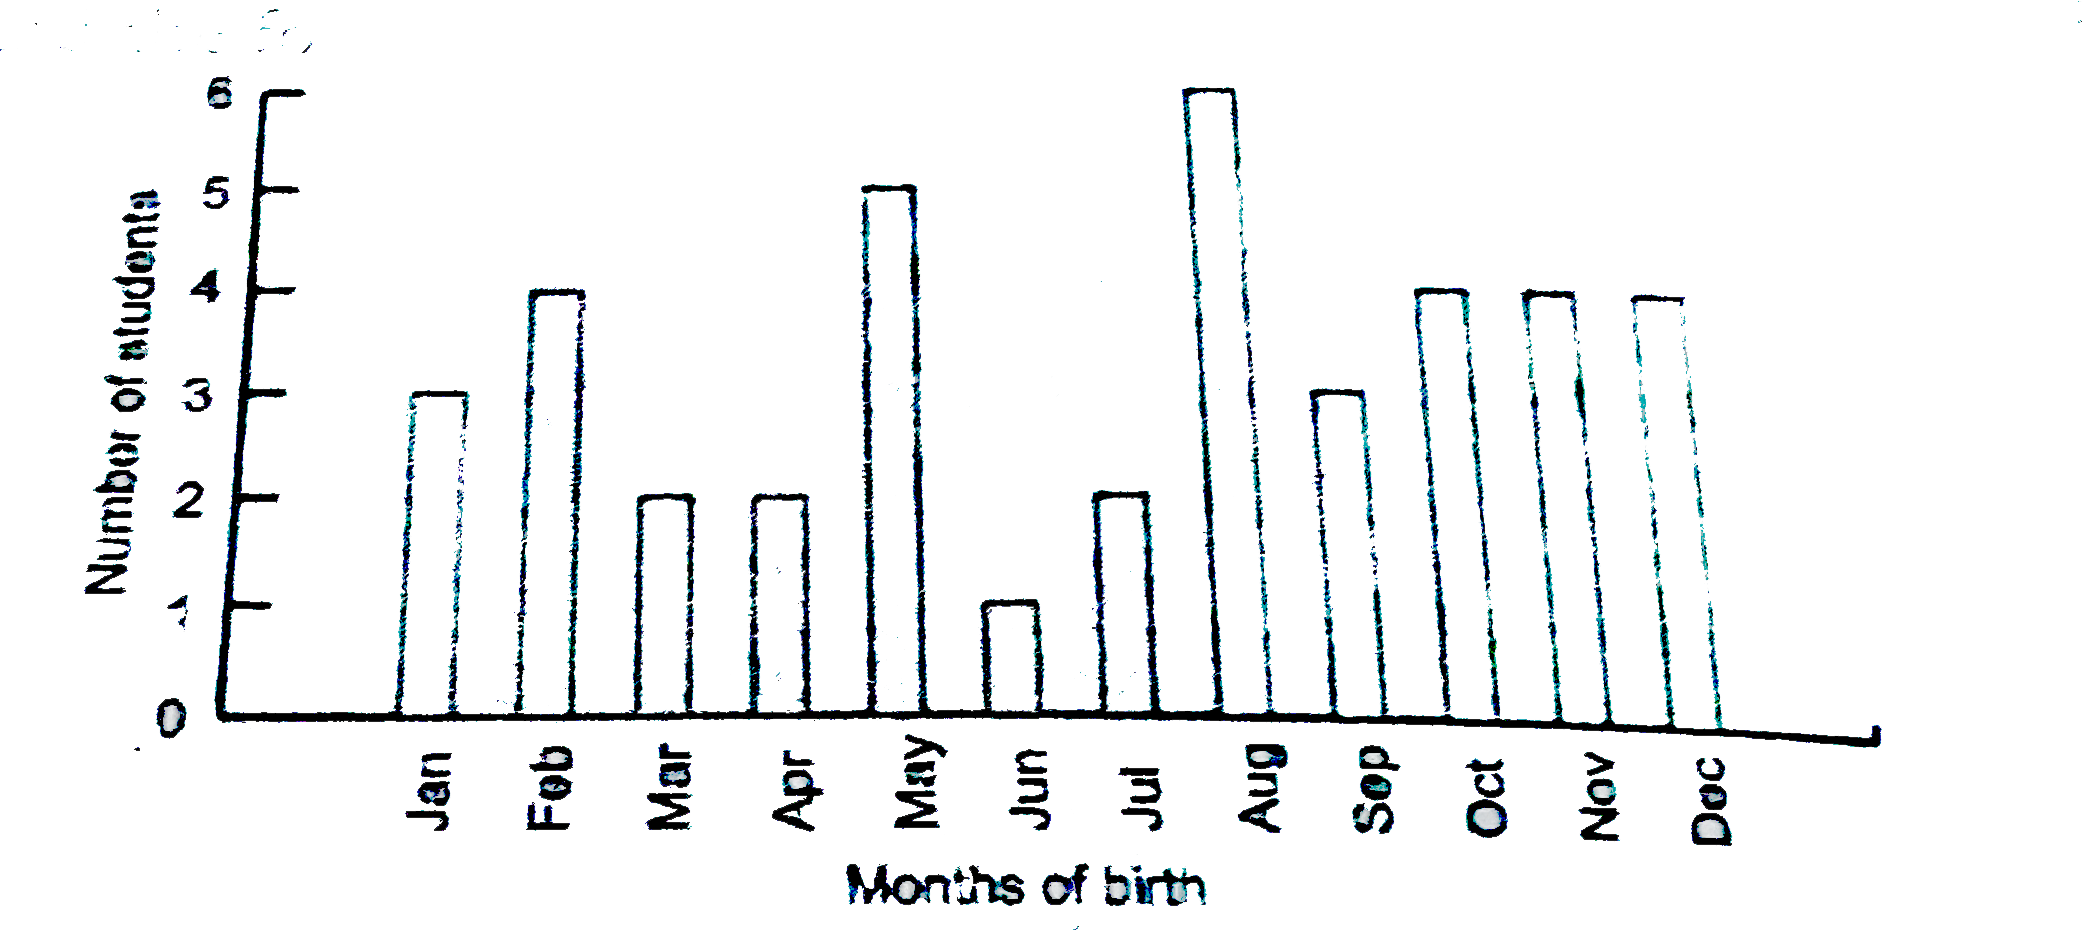
In a particular section of Class IX, 40 students were asked about the months of their birth and the following graph was prepared for the data so obtained:Observe the bar graph given above and answer the following questions:(i) How many students were born in the month of November?(ii) In which month were the maximum number of students born?
To solve the problem, we need to analyze the bar graph that represents the number of students born in each month. Here’s a step-by-step solution:
Step 1: Identify the number of students born in November
- From the bar graph, locate the bar corresponding to November on the x-axis.
- Read the height of the bar for November on the y-axis, which indicates the number of students born in that month.
Solution: There are 4 students born in the month of November.
Step 2: Determine the month with the maximum number of students born
- Examine all the bars on the graph to find the highest one.
- Compare the heights of the bars for each month to identify which month has the tallest bar.
Solution: The month with the maximum number of students born is August, with 6 students.
Summary of Answers:
(i) The number of students born in November is 4.
(ii) The month with the maximum number of students born is August (6 students).
---
- From the bar graph, locate the bar corresponding to November on the x-axis.
- Read the height of the bar for November on the y-axis, which indicates the number of students born in that month.
- Examine all the bars on the graph to find the highest one.
- Compare the heights of the bars for each month to identify which month has the tallest bar.
(i) The number of students born in November is 4.
(ii) The month with the maximum number of students born is August (6 students).
Topper's Solved these Questions
- STATISTICSBOOK - NCERT ENGLISHCHAPTER - STATISTICSEXERCISE - EXERCISE 14.3
9 Videos
- STATISTICSBOOK - NCERT ENGLISHCHAPTER - STATISTICSEXERCISE - EXERCISE 14.1
2 Videos
- STATISTICSBOOK - NCERT ENGLISHCHAPTER - STATISTICSEXERCISE - Exercise 14.2
9 Videos
- QUADRILATERALSBOOK - NCERT ENGLISHCHAPTER - QUADRILATERALSEXERCISE - Exercise 8.2
7 Videos
- SURFACE AREAS AND VOLUMESBOOK - NCERT ENGLISHCHAPTER - SURFACE AREAS AND VOLUMESEXERCISE - Exercise 13.9
3 Videos
Similar Questions
In a particular section of class IX, 40 students were asked about the month of their birth and the following graph was prepared for the data so obtained.

Find the probability that a student of the class was born in August.
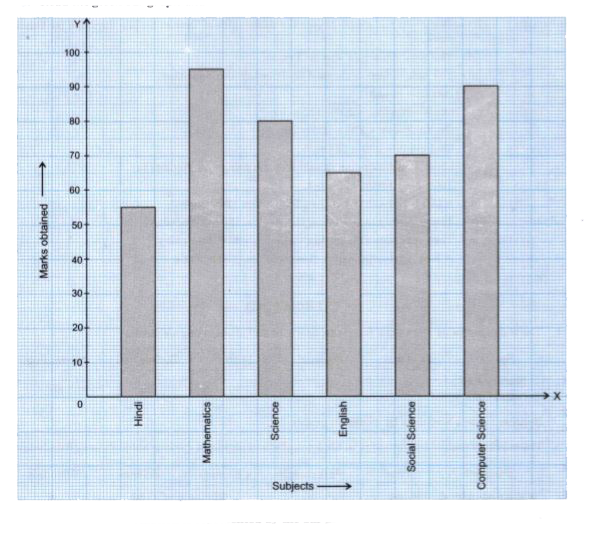
View SolutionRead the given bar graph and answer the question that follow :

How many marks were obtained in English?
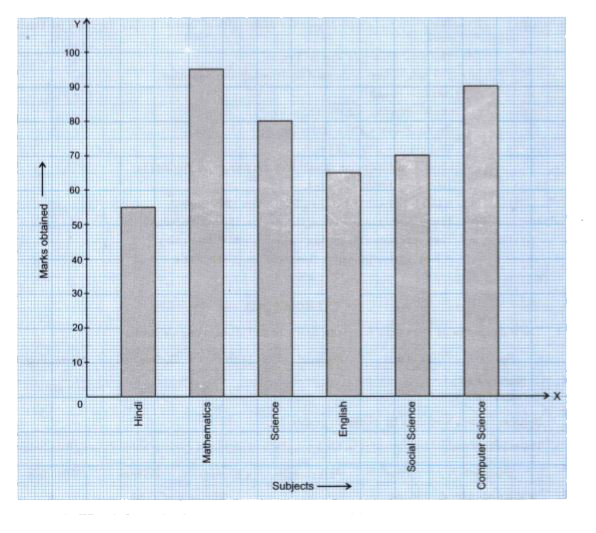
View SolutionRead the given bar graph and answer the question that follow :

In which subject least marks were obtained?
View SolutionRead the following bar graph shown in Figure and answer the following questions: What is the information given by the bar graph? In which month was the sale of the book maximum? In which month was the sale of the book minimum? What is the total sale of the book during these five months?
View SolutionRead the following bar graph shown in Figure and answer the following questions: What is the information given by the bar graph? In which month was the sale of the book maximum? In which month was the sale of the book minimum? What is the total sale of the book during these five months?
View SolutionLook at the bar graph given below.
Read it care fully and answer the following questions.
(i) What information does the bar graph give?
(ii) In which subject is the student very good?
(iii) In which subject is the poor? (iv) What is the average of his marks?
View SolutionThe following bar graph represents the data for different sizes of shoes worn by the students in a school. Read the graph and answer the following questions.
(i)What are the different numbers of the shoe-worn by the students?
(ii)What is the number of students wearing shoe No. 6?
(iii)Which shoe number is worn by the maximum number of students?
(iv)Which shoe number is worn by the minimum number of students?
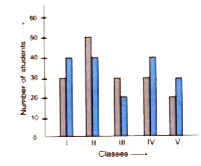
View SolutionExmine the given graph carefully.

In the graph show above represents the number of girls in a particular class and represents the number of boys in the same class.
Read and answer the following questions.
(i) Which class has the least number of students ?
(ii) Which class has maximum number of students ?
(iii) What is the ratio between the number of girls and the number of boys of class V.
View SolutionA survey was carried out in a certain school to find about different modes of transport used by students to travel to school each day. 30 students of class VI were interviewed and the data obtained was displayed in the form of a pictographs given below: Mode of Transport, Number of Students Scooter, Figure Public Bus, Figure School Bus, Figure Cycle, Figure Walking, Figure Look at the above pictograph and answer the following questions: Look at the above pictograph and answer the following questions: How many students are using cycle or walking as a mode of travel? Which is most popular mode of travel?
View SolutionDraw a histogram for the frequency table made for the data in Question 3, and answer the following questions.(i) Which group has the maximum number of workers?(ii) How many workers earn Rs 850 and more?(iii) How many workers earn less than Rs 850?
View Solution
