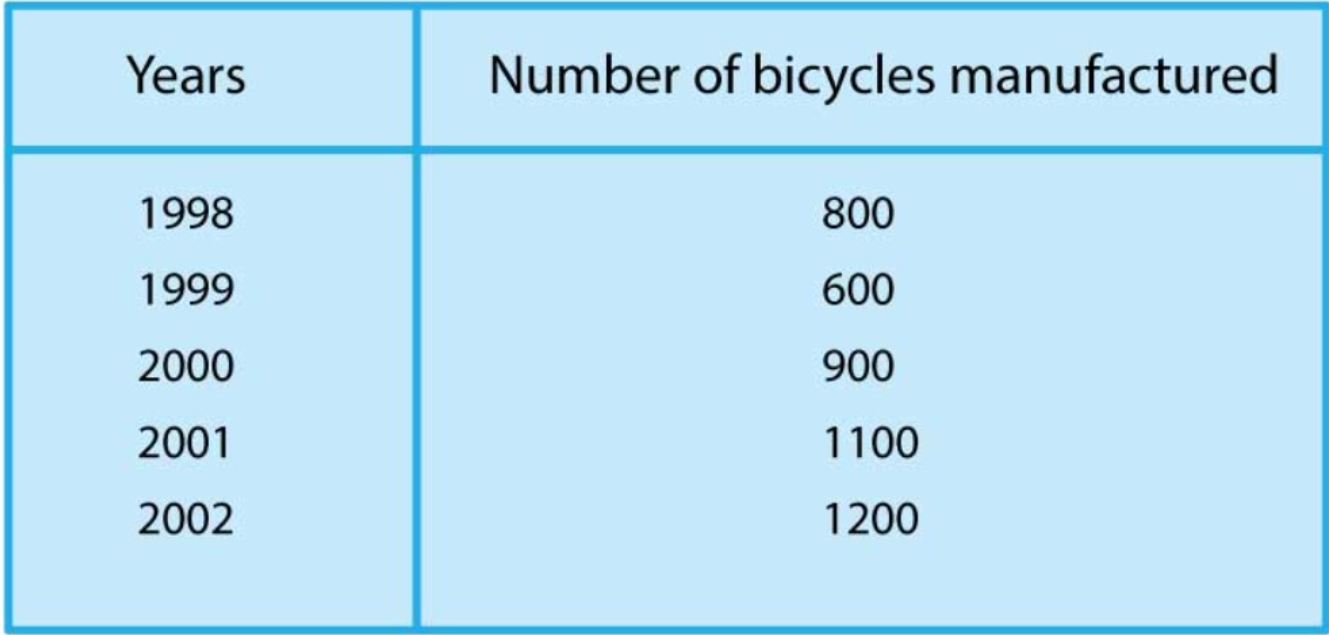
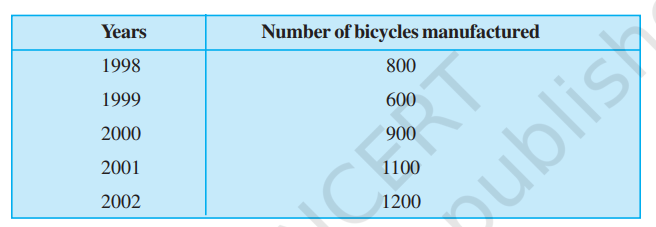
Following table shows the number of bicycles manufactured in a factory
during the years 1998 to 2002. Illustrate this data using a bar graph. Choose
a scale of your choice

Step by step video & image solution for Following table shows the number of bicycles manufactured in a factory during the years 1998 to 2002. Illustrate this data using a bar graph. Choose a scale of your choice by Maths experts to help you in doubts & scoring excellent marks in Class 6 exams.
Updated on:21/07/2023Topper's Solved these Questions
Similar Questions
Following pictograph shows the number of tractors in five villages. Observe the pictograph and answer the following questions. (i) Which village has the minimum number of tractors? (ii) Which village has the maximum number of tractors? (iii) How many more tractors village C has as compared to village B. (iv) What is the total number of tractors in all the five villages?
View SolutionGiven below are the ages of 25 students of class VIII in a school. Prepare a discrete frequency distribution. 15,16,16,14,17,17,16,15,15,16,16,17,15,16,16,14,16,15,14,15,16,16,15,14,15
View SolutionFollowing table shows the number of bicycles manufactured in a factory during the years 1998 to 2002. Illustrate this data using a bar graph. Choose a scale of your choice

View SolutionFrom the following data, using weighted average method, calculate the cost of living index for the year 2006, taking 2002 as the base year.
ltimg src="https://d10lpgp6xz60nq.cloudfront.net/physics_images/PS_MATH_IX_C18_E03_005_Q01.png" width="80%"gt
View SolutionWhich of the following are correct chain isomers of butane ? (i)
View SolutionDetermine the point of symmetry of a regular hexagon.
View SolutionDtermine the images of the following figure about the given line :
View SolutionMatch the following Column A to Column B

View SolutionMatch the following Column A to Column B

View SolutionMatch the following Column A to Column B

View SolutionThe inequation represented by the graph given below is :
View SolutionThe inequation that best describes the graph given below is _________
View SolutionThe inequation that best describes the following graph is _________
View SolutionFollowing table shows the number of bicycles manufactured in a factory during the years 1998 to 2002. Illustrate this data using a bar graph. Choose a scale of your choice
Year:1998,1999,2000,2001,2002
No. of Bicycle Manufactured : 800,600,900,1100,1200
View SolutionFollownig table shows the number of bicycles manufactured in a factory during the years 1998 to2002. Illustrate this data using a bar graph. Choose a scale of your choice. (a) In which In In which year were the maximum number of bicycles manufactured?
View Solution
