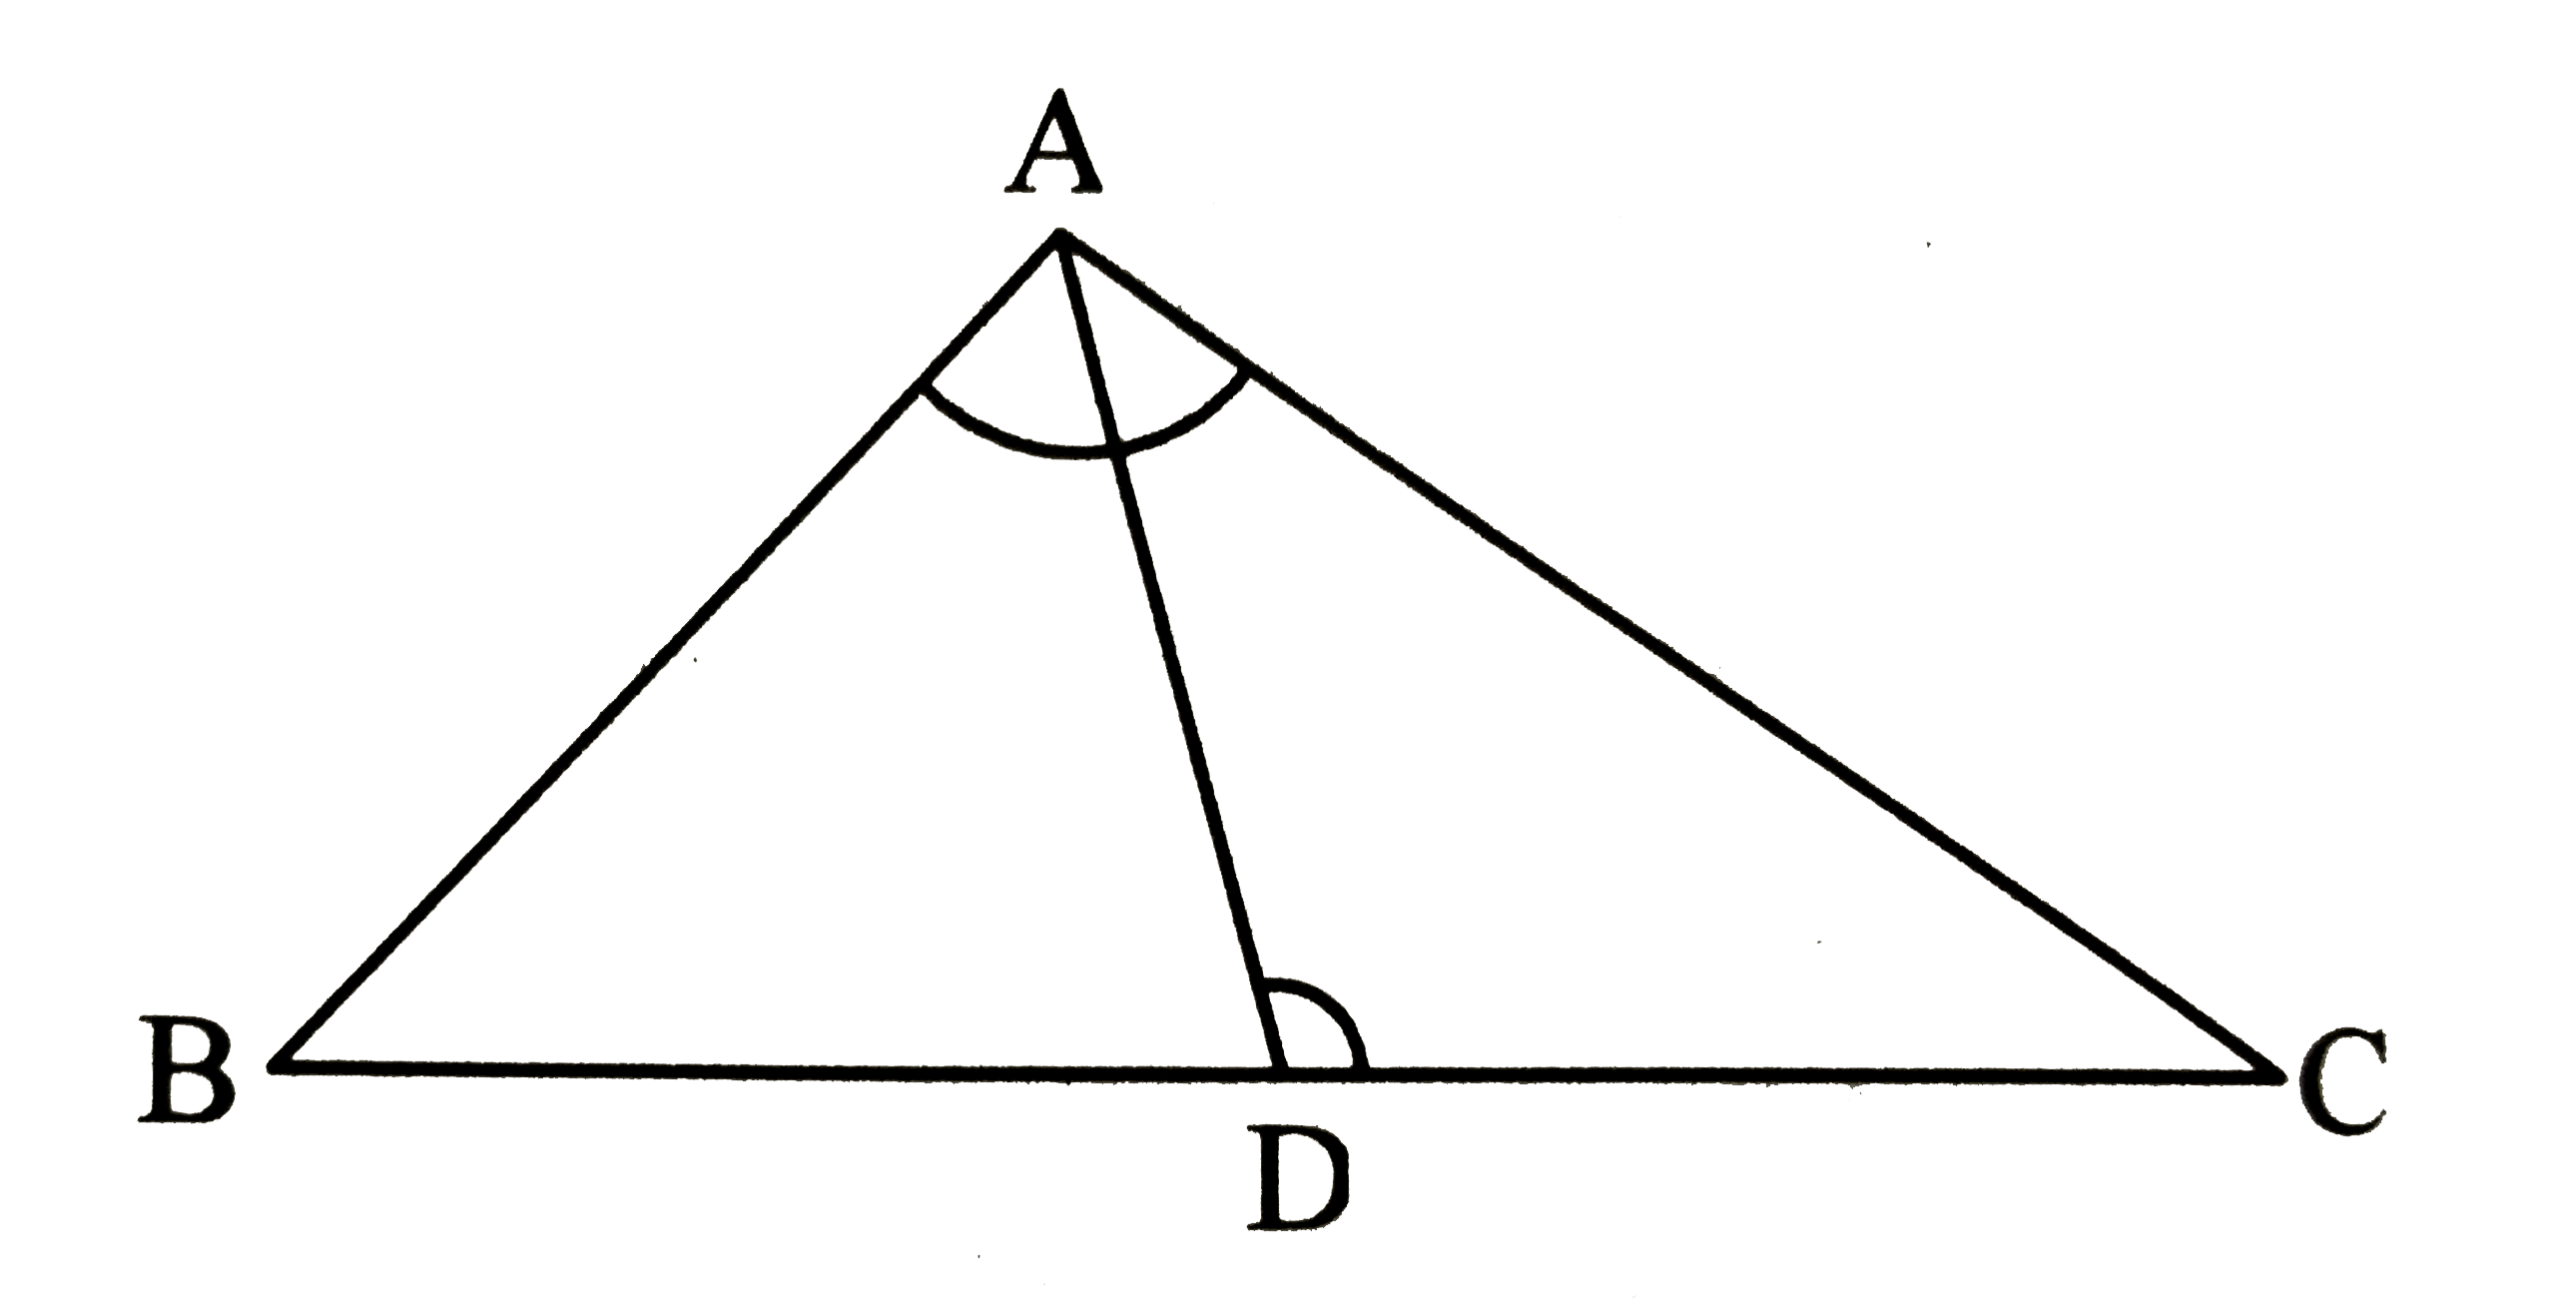
In the adjoining figure, in ΔABC, point D is on side BC such that, ∠BAC=∠ADC. Prove that, CA2=CB×CD.
 Solution in Marathi
Step by step video & image solution for In the adjoining figure, in DeltaABC, point D is on side BC such that, angleBAC = angleADC. Prove that, CA^2 = CB xx CD. by Maths experts to help you in doubts & scoring excellent marks in Class 10 exams.
Topper's Solved these Questions
- BOOK - BAL BHARTICHAPTER - SIMILARITY EXERCISE - PRACTICE SET 1.46videos
SIMILARITY
- BOOK - BAL BHARTICHAPTER - SIMILARITY EXERCISE - PROBLEM SET 112videos
SIMILARITY
- BOOK - BAL BHARTICHAPTER - SIMILARITY EXERCISE - PRACTICE SET 1.25videos
SIMILARITY
- BOOK - BAL BHARTICHAPTER - QUADRATIC EQUATIONSEXERCISE - Problem Set - 227videos
QUADRATIC EQUATIONS
- BOOK - BAL BHARTICHAPTER - TRIGONOMETRYEXERCISE - Problem set 618videos
TRIGONOMETRY
Similar Questions
Ratio of corresponding sides of two similar triangles is 3:5, then find ratio of their areas.
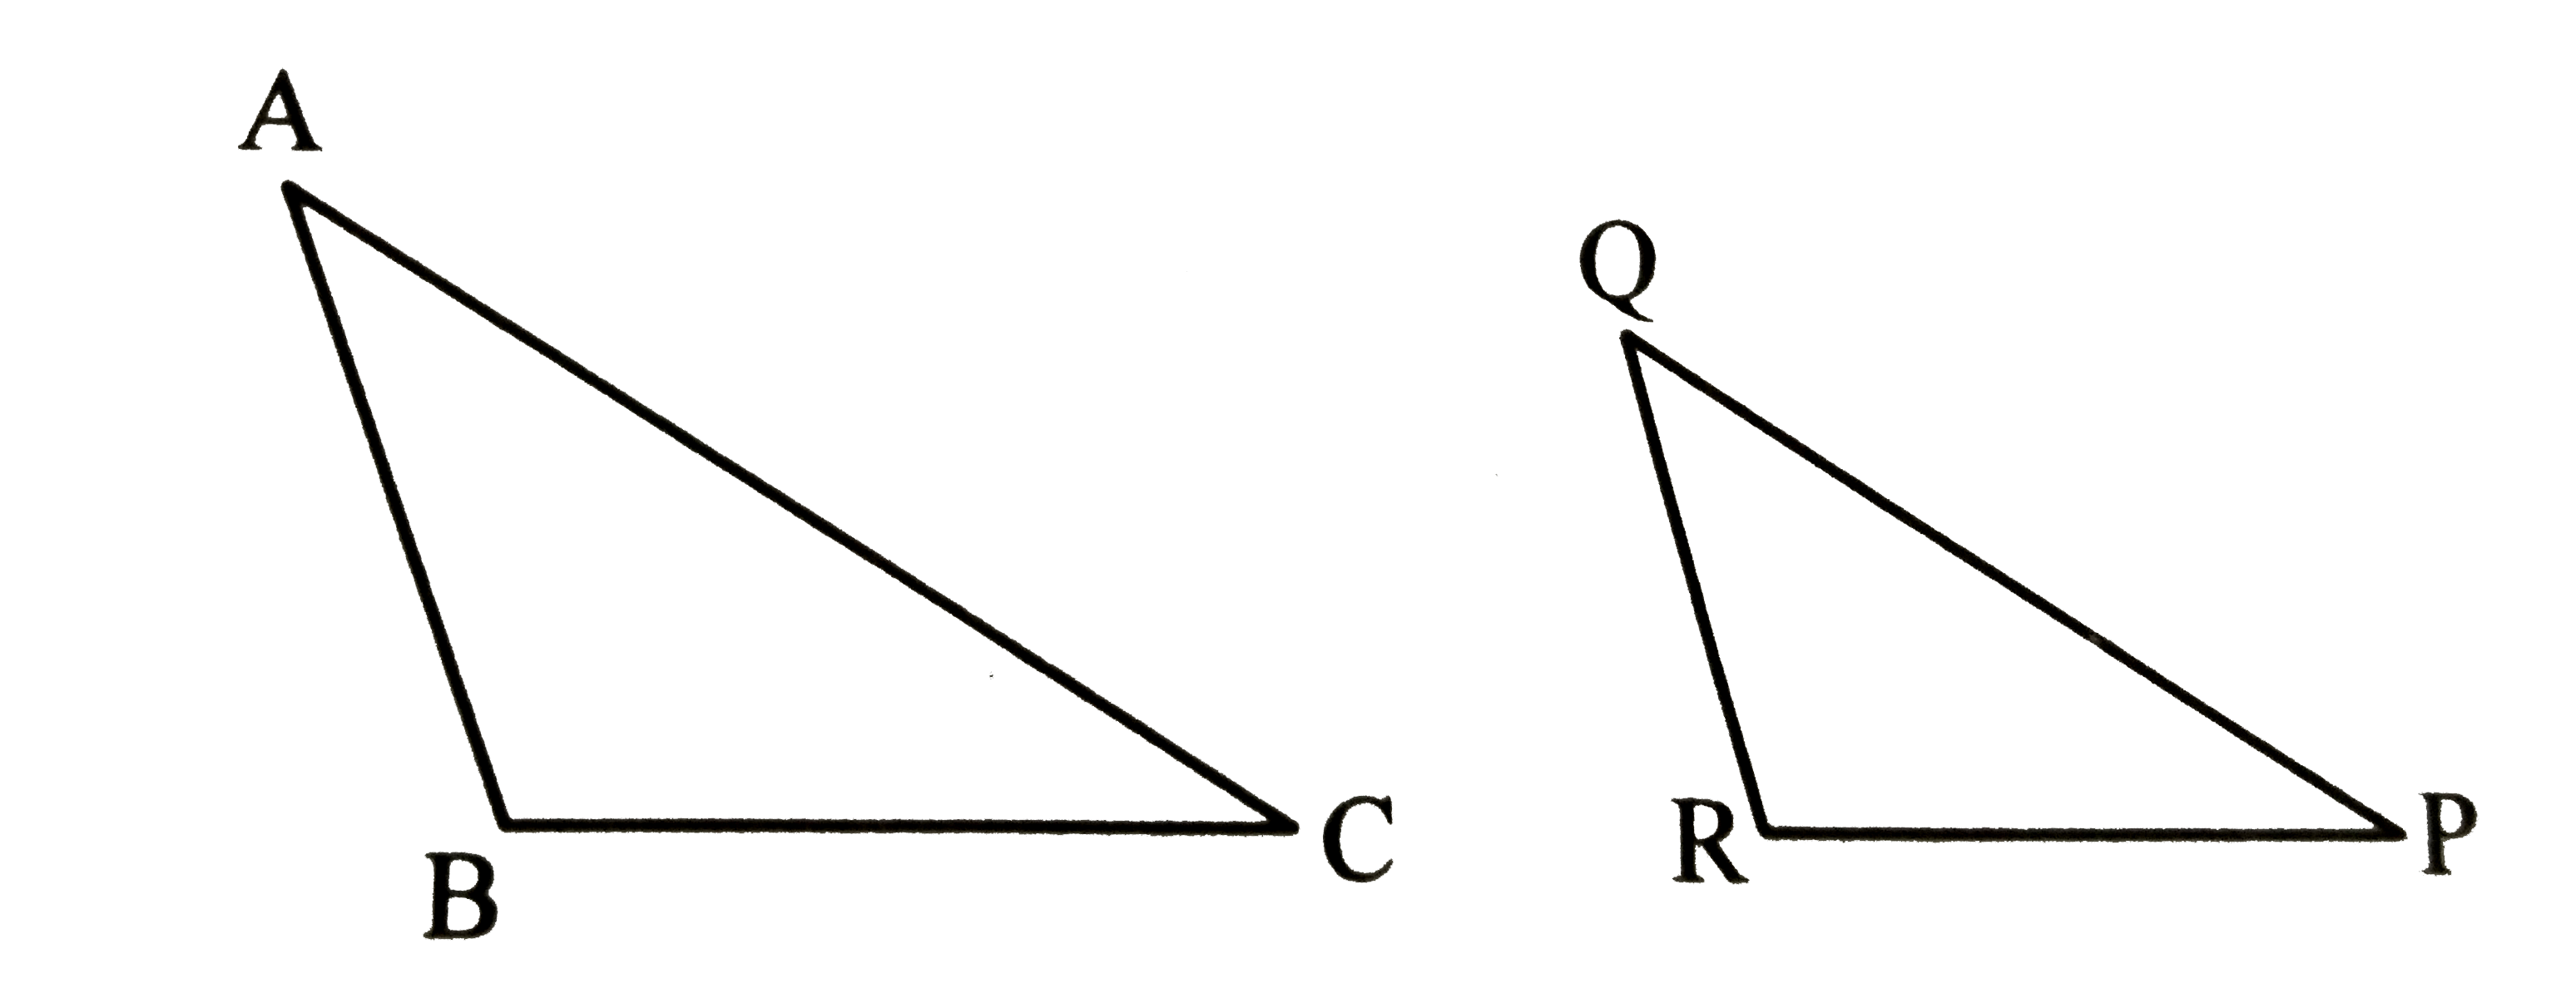
01:37View SolutionIn ΔABCandΔPQR, in a one to one correspondence.
ABQR=BCPR=CAPQ, then
 02:11View Solution
In ΔMNP, NQ is a biscetor of ∠N. If MN = 5, PN = 7, MQ = 2.5, then find QP.
01:31View SolutionWhich of the following equation is quadratic?
(i) x2+2x+11=0.02:45View SolutionIf sinθ = 11/61 find the values of cosθ using trigonometric identity.
02:17View SolutionHow many lines of symmetry does the above figure have ?
05:41View SolutionDetermine the point of symmetry of a regular hexagon.
02:21View SolutionDtermine the images of the following figure about the given line :
02:03View SolutionMatch the following Column A to Column B
 02:10View Solution
Match the following Column A to Column B
 02:17View Solution
Match the following Column A to Column B
 02:10View Solution
Find the area of the figure given below.
 04:23View Solution
The area of the shaded part in the figure given below is ______.
 01:19View Solution
The inequation represented by the graph given below is :
02:24View SolutionThe inequation that best describes the graph given below is _________
01:52View SolutionThe inequation that best describes the following graph is _________
03:10View Solution

