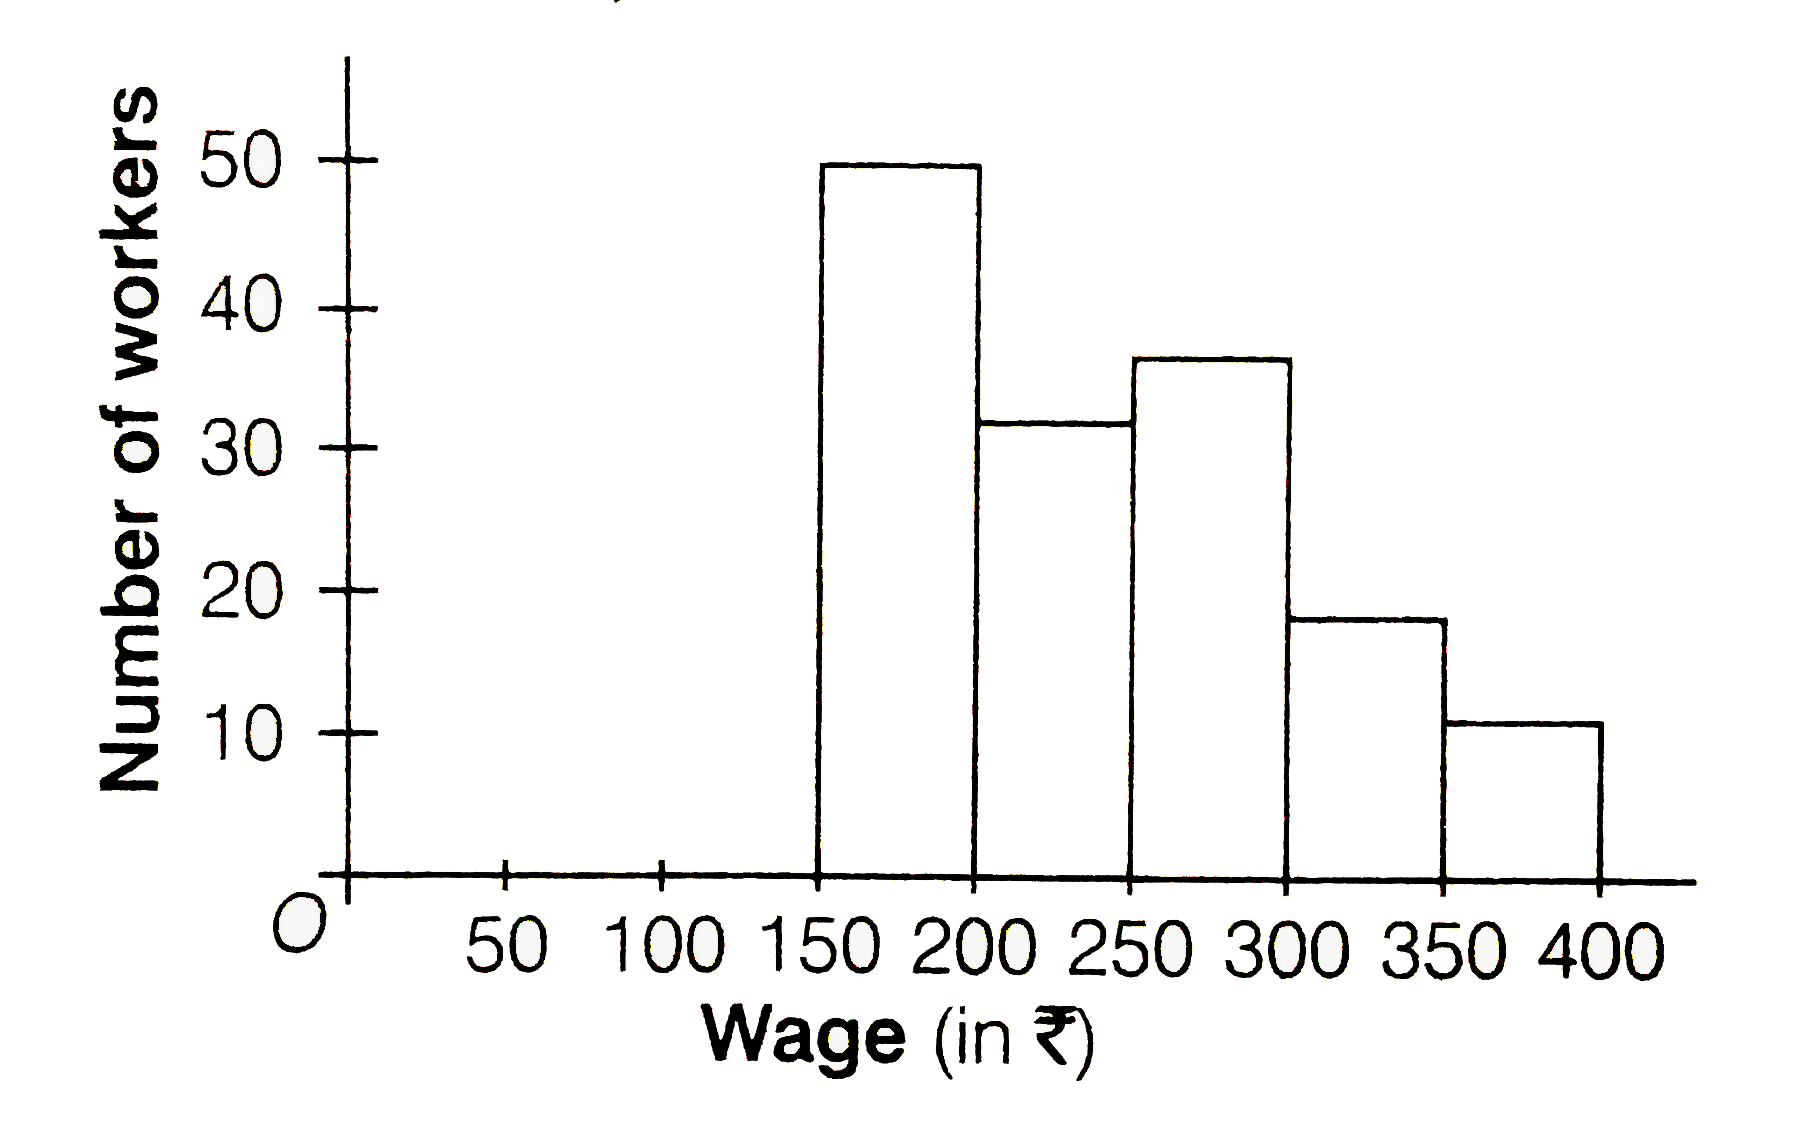
In the figure, there is histrogram depicting daily wages of workers in a factory. Construct the frequency distribution table.

It is clear from the histogram that class interval start from 150-200, 200-250, having width
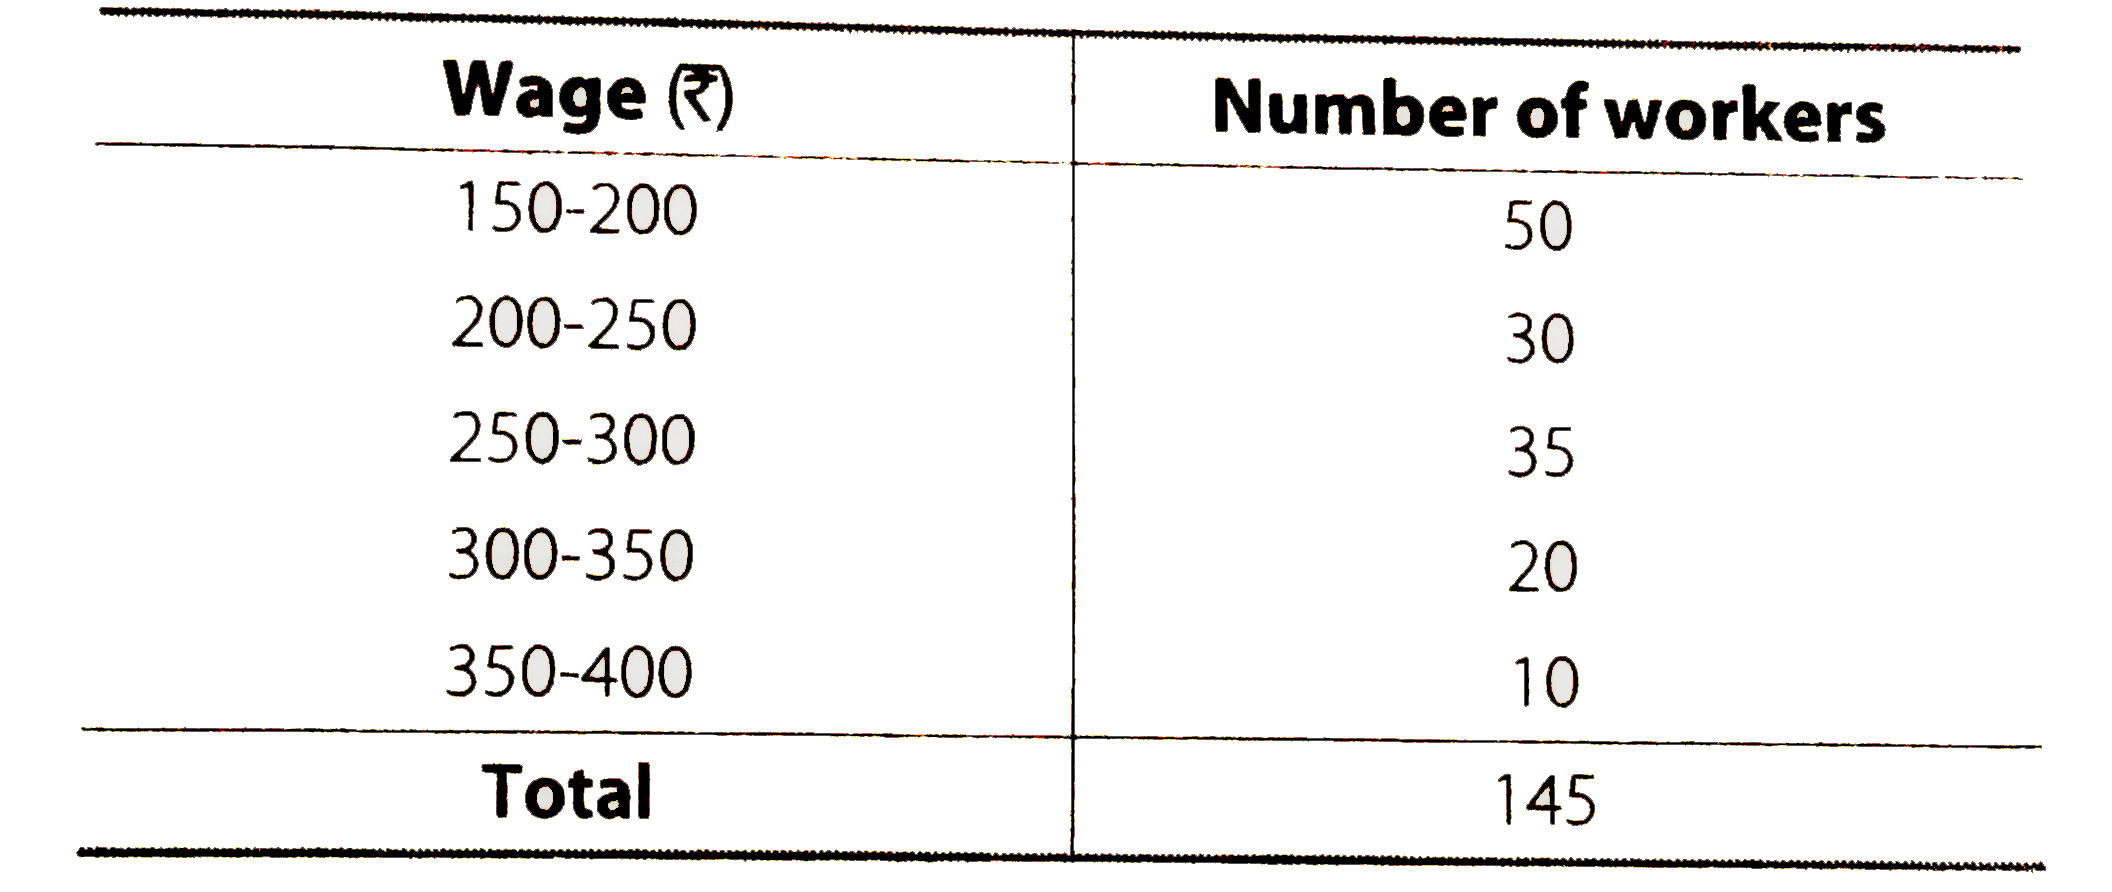
The frequency distribution table is given below.

Topper's Solved these Questions
- STATISTICS AND PROBABILITYBOOK - NCERT EXEMPLARCHAPTER - STATISTICS AND PROBABILITYEXERCISE - LONG ANSWER TYPE QUESTIONS
5 Videos
- QUADRILATERALS BOOK - NCERT EXEMPLARCHAPTER - QUADRILATERALS EXERCISE - Quadrilaterals
56 Videos
- TRIANGLESBOOK - NCERT EXEMPLARCHAPTER - TRIANGLESEXERCISE - Triangles
55 Videos
Similar Questions
Construction of a frequency distribution
View SolutionConstruction of a frequency distribution
View SolutionConstruction of Cumulative frequency distribution
View SolutionConstruction of a discrete frequency distribution
View SolutionConstruction of a Grouped frequency distribution
View SolutionConstruction of a Discrete frequency Distribution
View SolutionFind the mean of the daily wages of 60 workers in a factory as per given below
View SolutionForm the frequency distribution table from the following data:
Construct the frequency distribution table for the above data.

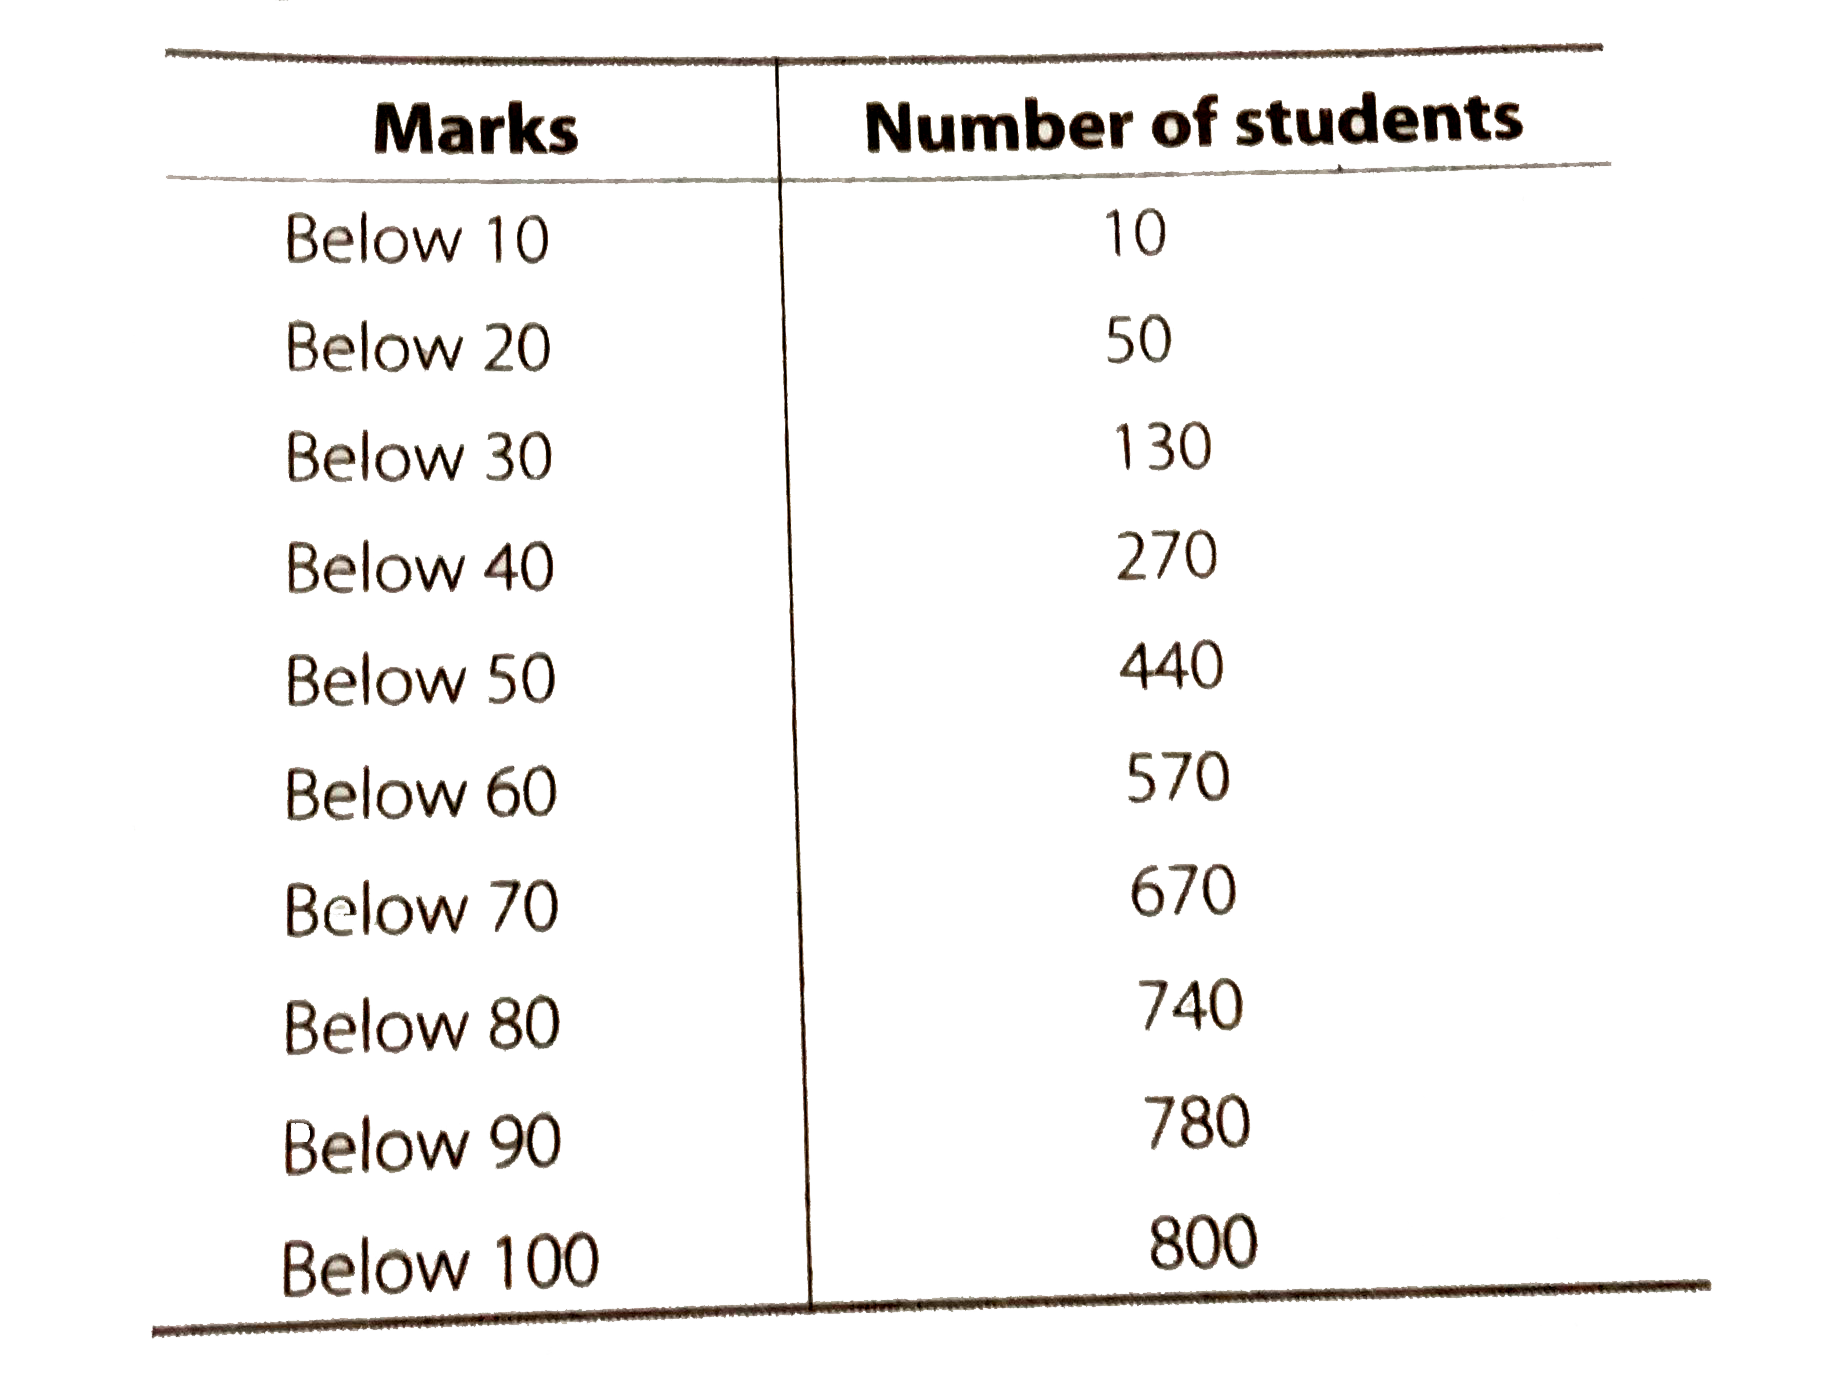
View SolutionThe following table show tha cumulative frequency distribution of marks of 800 students in an examination.

Construct a frequency distribution table for the data above.
View SolutionFind the mean of daily wages of 40 workers in a factory as per data given below:

View Solution
