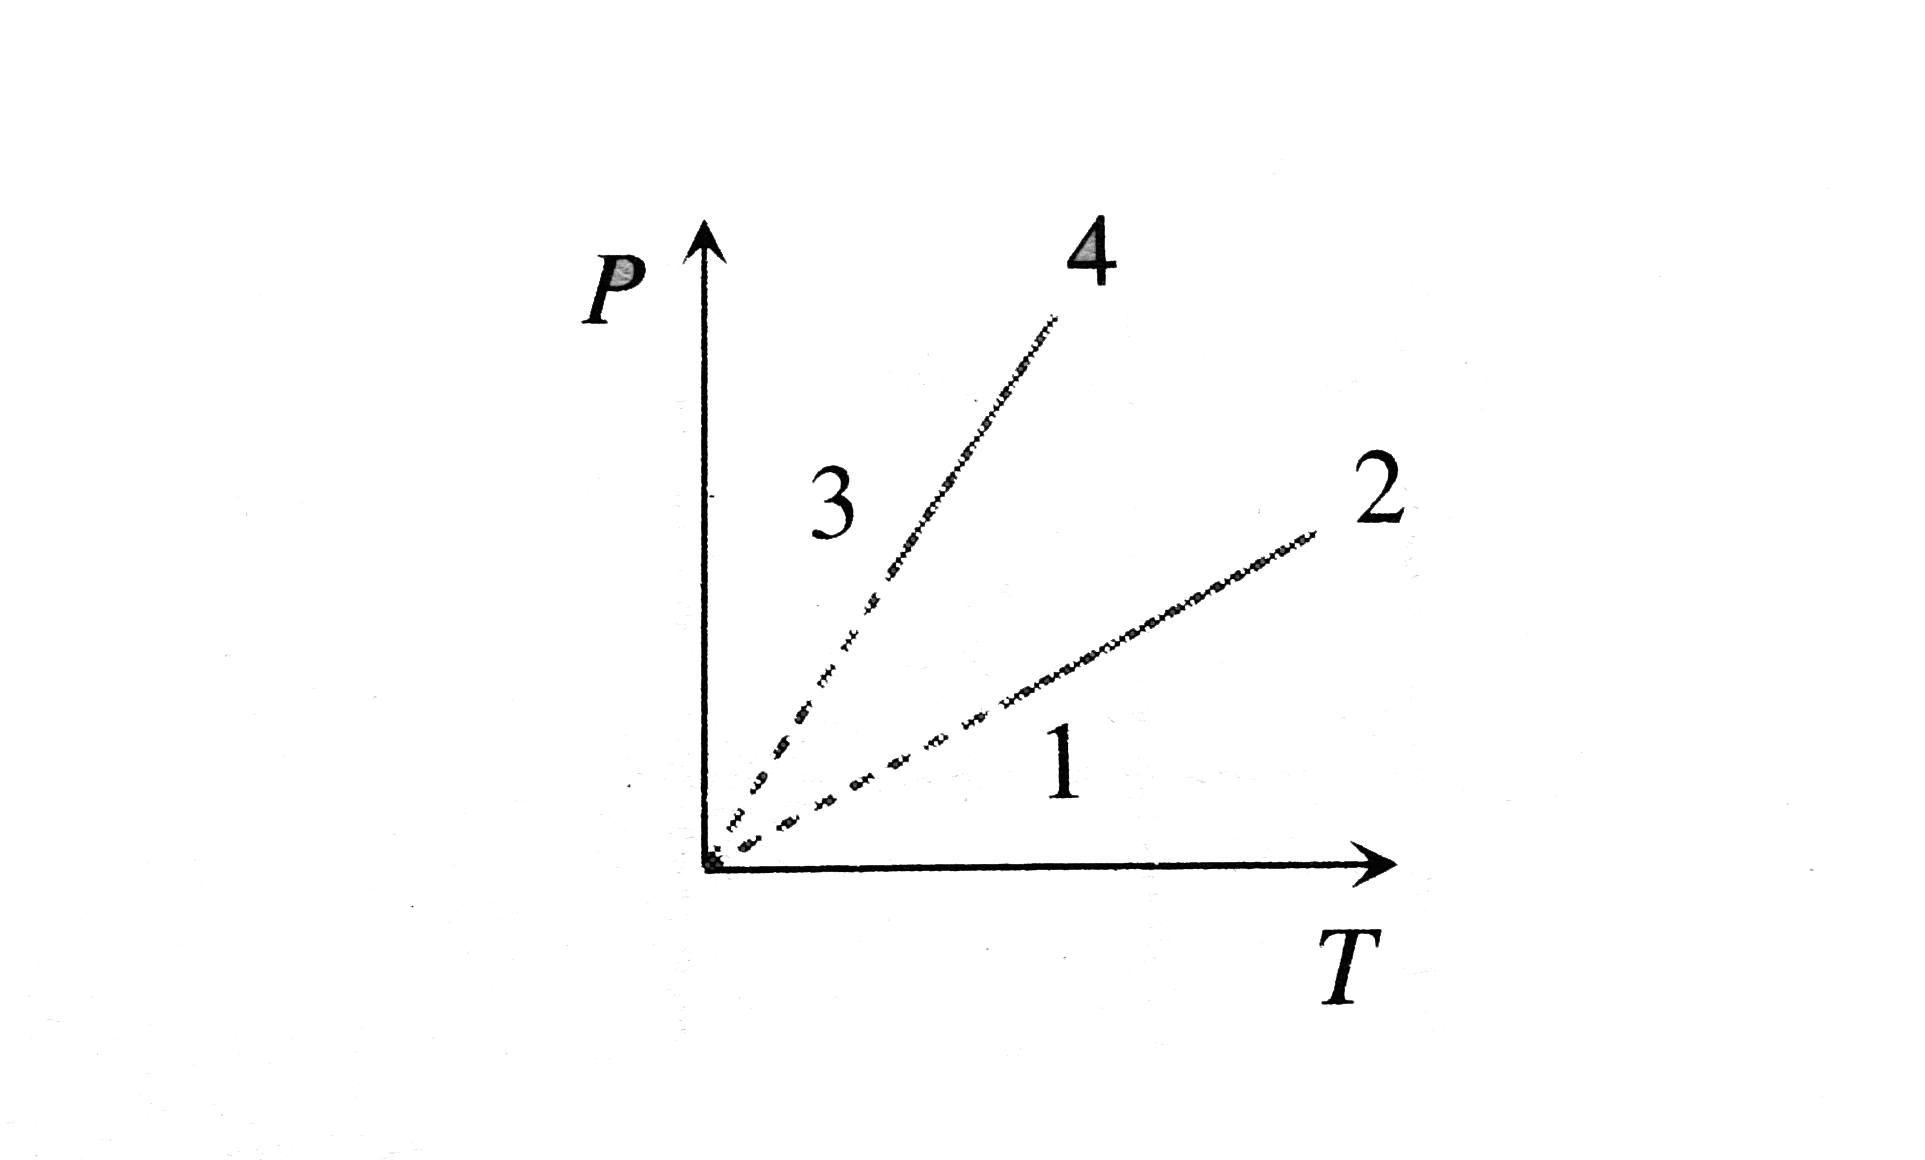
Pressure versus temperature graph of an ideal gas of equal number of moles of different volumes is plotted as shown in Fig. Choose the correct alternative.
A
V1=V2=V3=V4
B
V4>V3>V2>V1
C
V1=V2,V3=V4andV2>V3
D
V1=V2,V3=V4andV2<V3
Video Solution
Text Solution
The correct Answer is:C
As P-T graphs are straight lines, passing through origin, therefore, P∝T. But as P=(μRV)T.
thererore, the slope of straight line ∝1V
As(Slope)12<(Slope)34 ∴V2>V3
As for a given slope, V is constant, therefore,
V1=V2andV3=V4.
|
Updated on:21/07/2023
Topper's Solved these Questions
- BOOK - NCERT FINGERTIPSCHAPTER - KINETIC THEORYEXERCISE - Kinetic Theory Of An Ideal Gas18videos
KINETIC THEORY
- BOOK - NCERT FINGERTIPSCHAPTER - KINETIC THEORYEXERCISE - Law Of Equipartition Of Energy5videos
KINETIC THEORY
- BOOK - NCERT FINGERTIPSCHAPTER - KINETIC THEORYEXERCISE - Assertion And Reason10videos
KINETIC THEORY
- BOOK - NCERT FINGERTIPSCHAPTER - GRAVITATIONEXERCISE - Assertion And Reason15videos
GRAVITATION
- BOOK - NCERT FINGERTIPSCHAPTER - LAWS OF MOTIONEXERCISE - Assertion And Reason15videos
LAWS OF MOTION
Similar Questions
Knowledge Check
- Question 1 - Select One
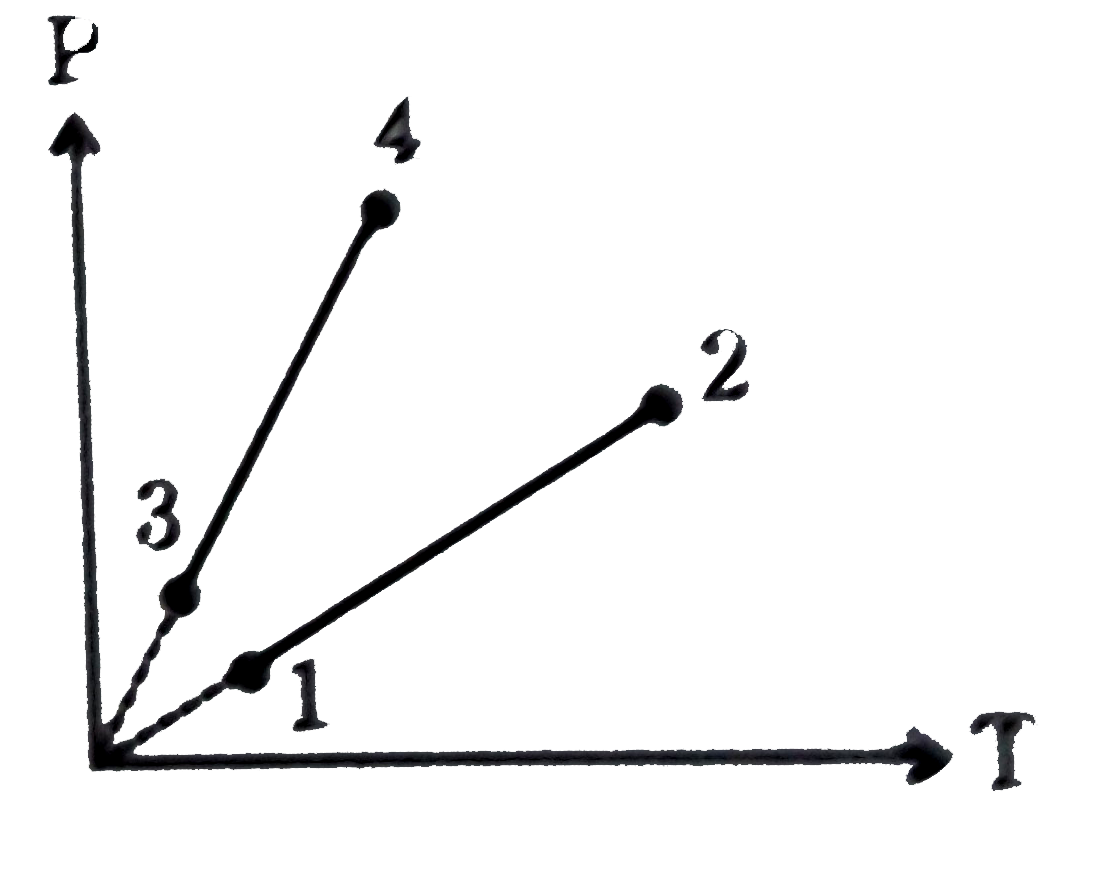
Pressure versus temperature graph of an ideal gas of equal number of moles of different volumes is plotted as shown in figure. Choose the correct alternatives.
 AV1=V2,V3=V4 and V2>V3BV1=V2,V3=V4 and V2<V3CV1=V2=V3=V4DV4>V3>V2>V1
 - Question 2 - Select One
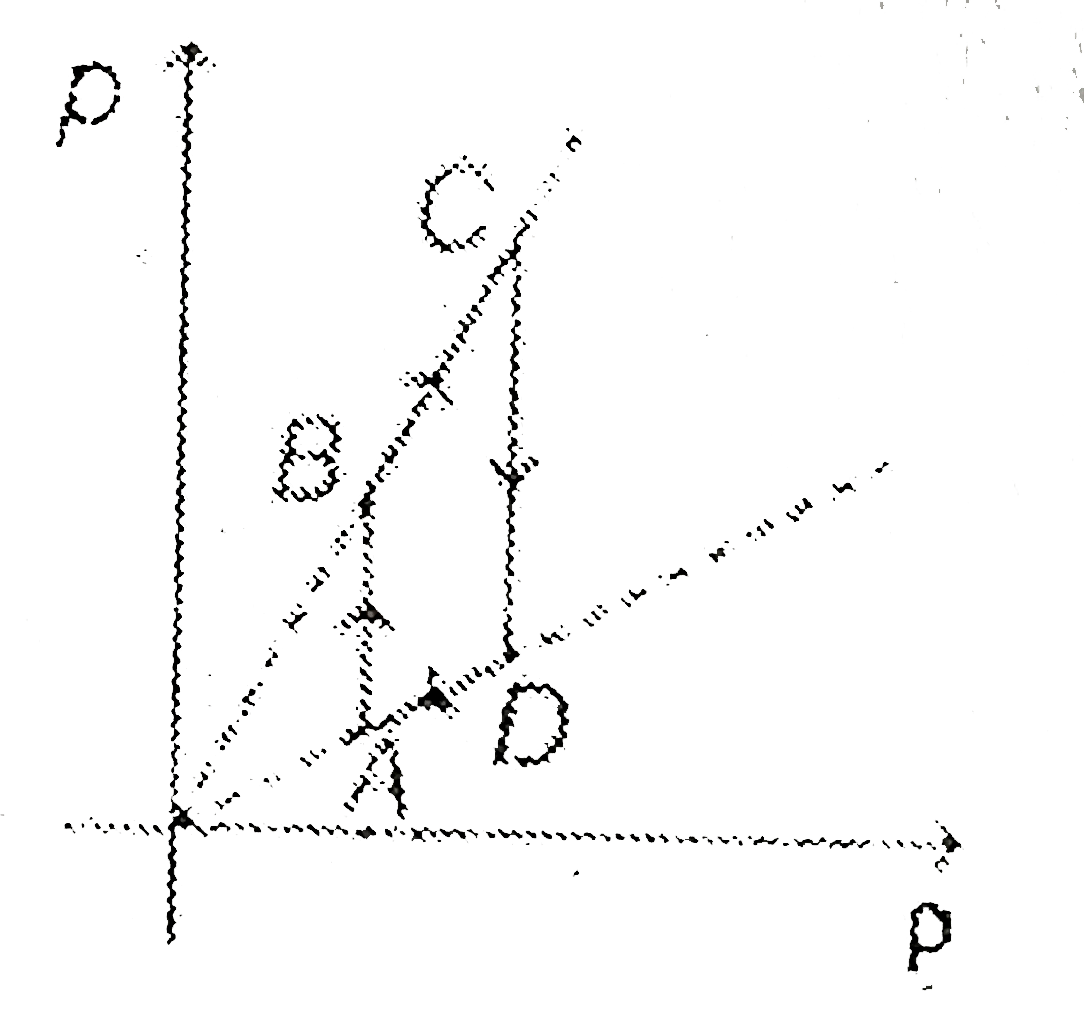
Pressure versus density graph of an ideal gas is shown in figure
 Aduring the process AB work done by the gas is positiveBduring the process AB work done by the gas is negativeCduring the process BC internal energy of the gas is increasingDNone of the above
 - Question 3 - Select One or More
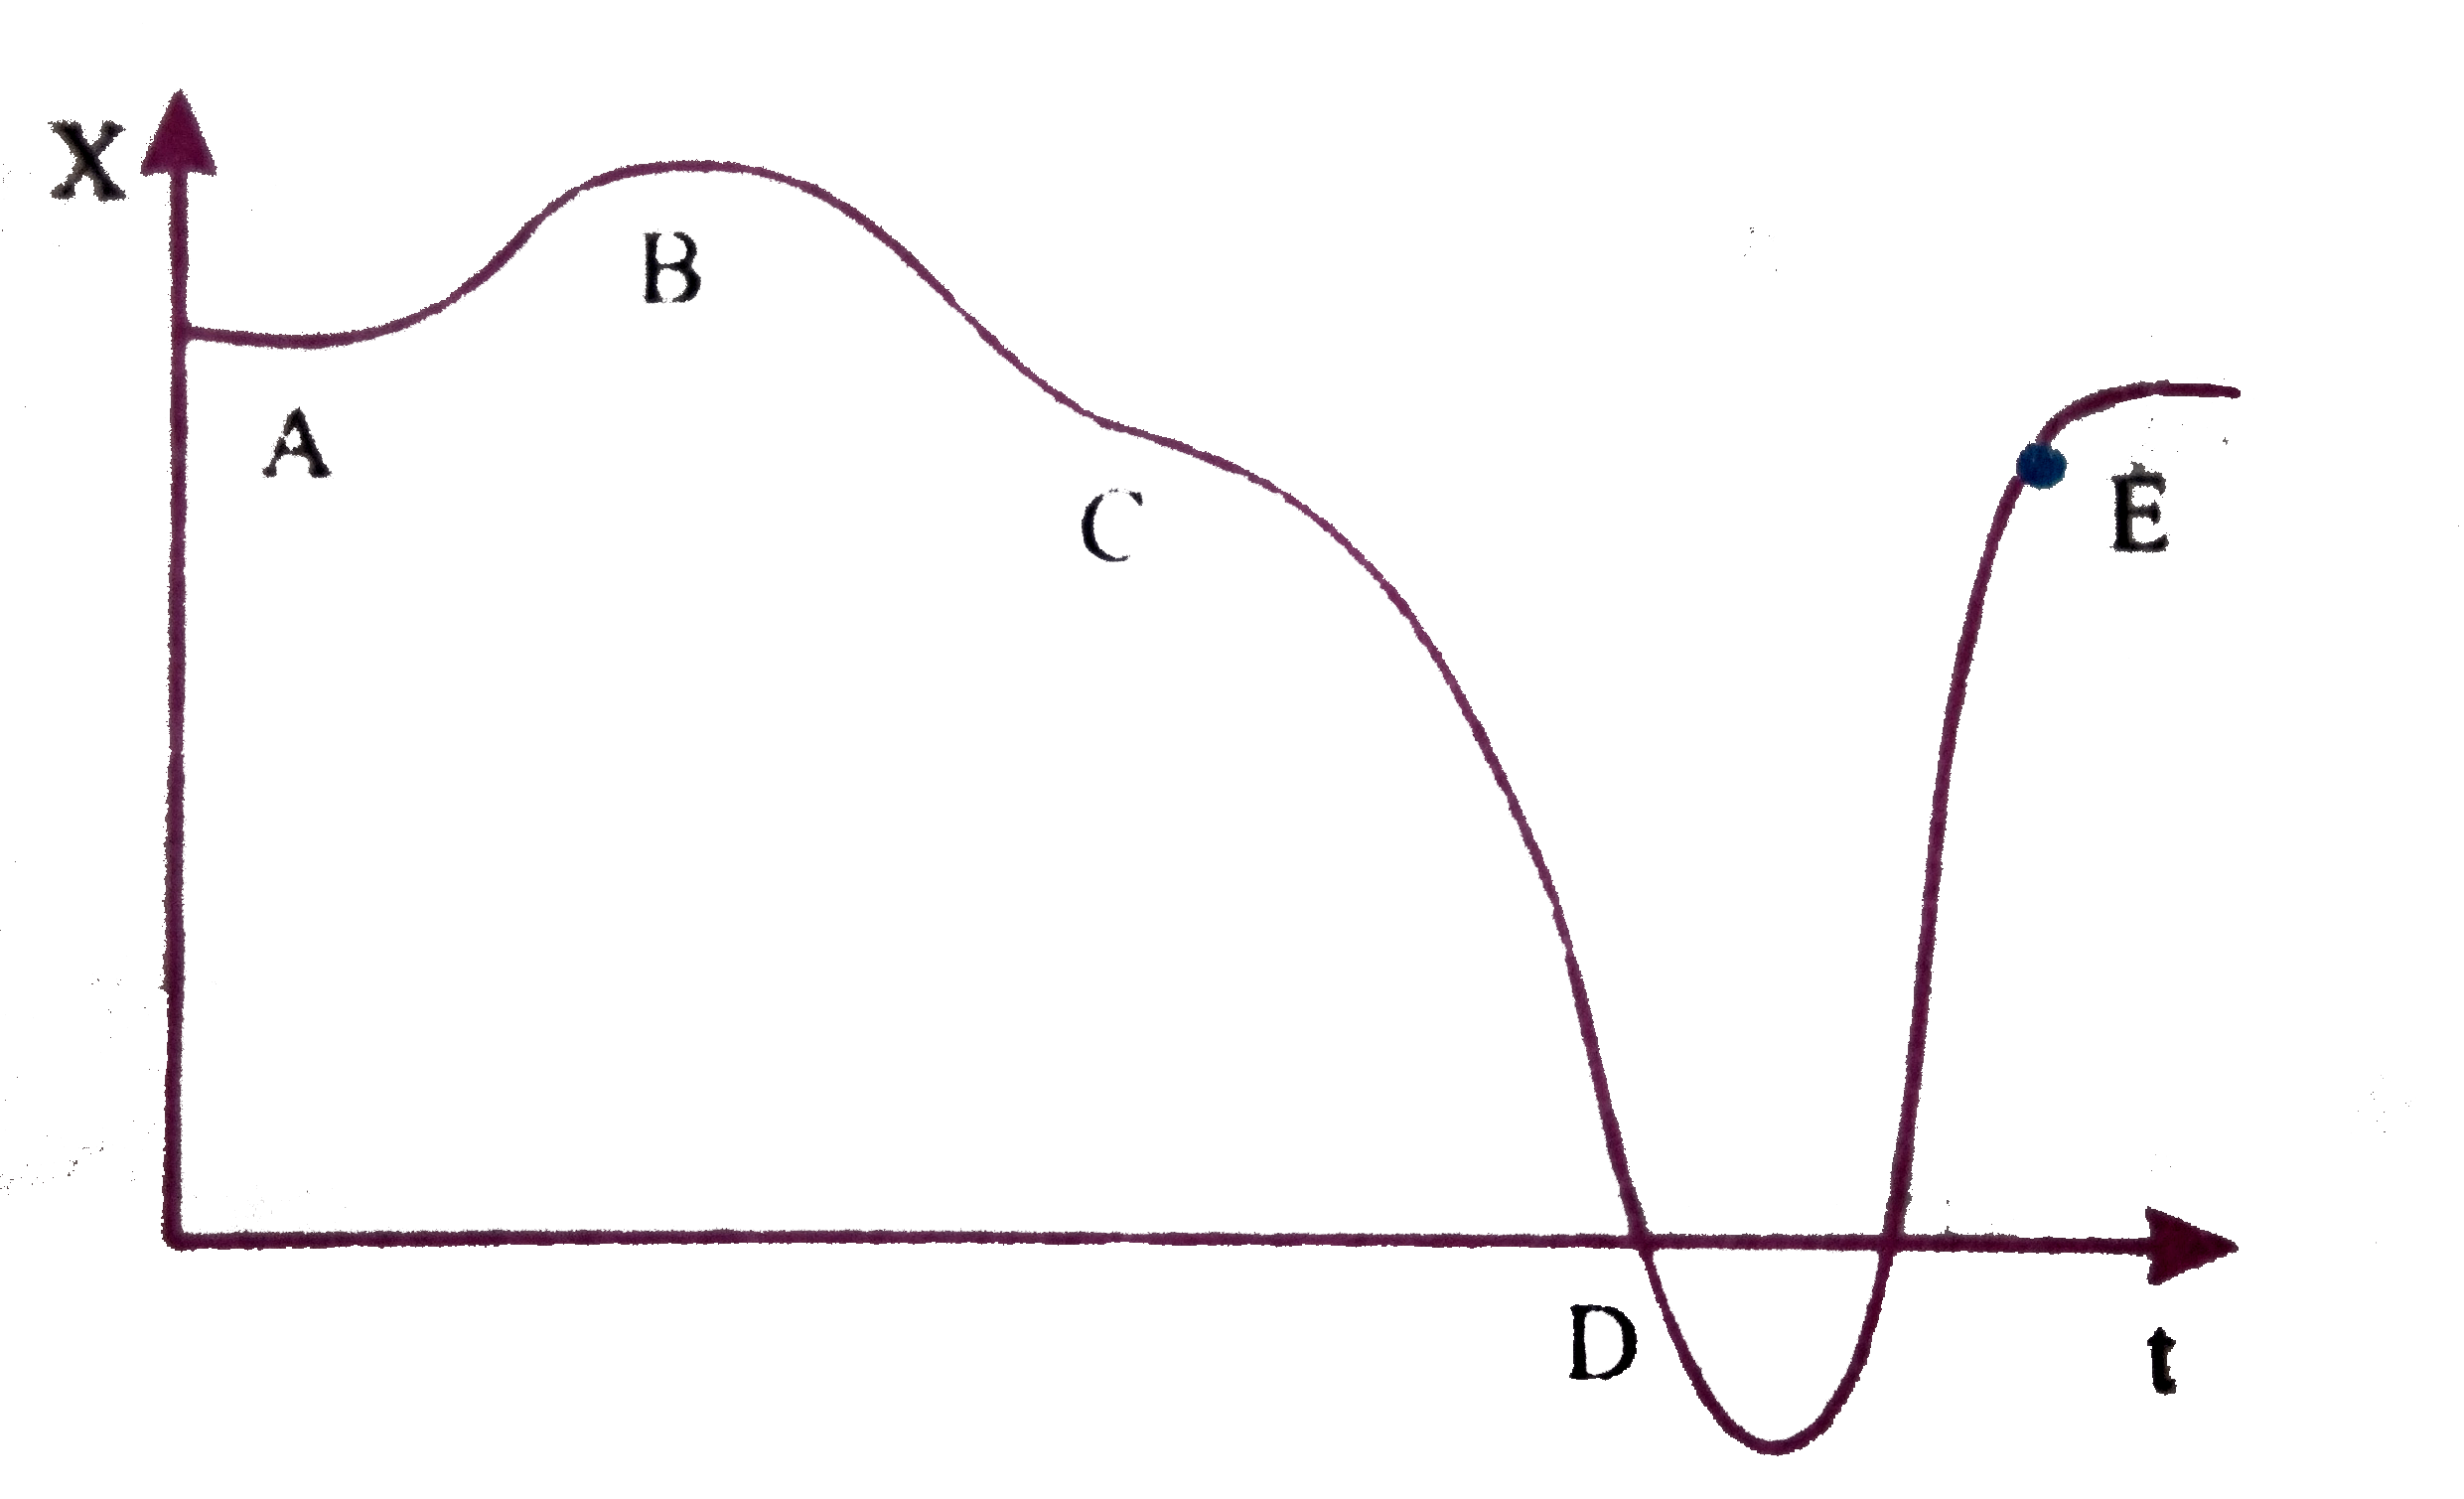
A graph of x versus t is shown in figure. Choose correct alternative from below.AThe particle was released from rest at t=0BAt B, the accleration a>0CAverage velocity for the motion between A and D is positive.DThe speed at D exceeds that at E.
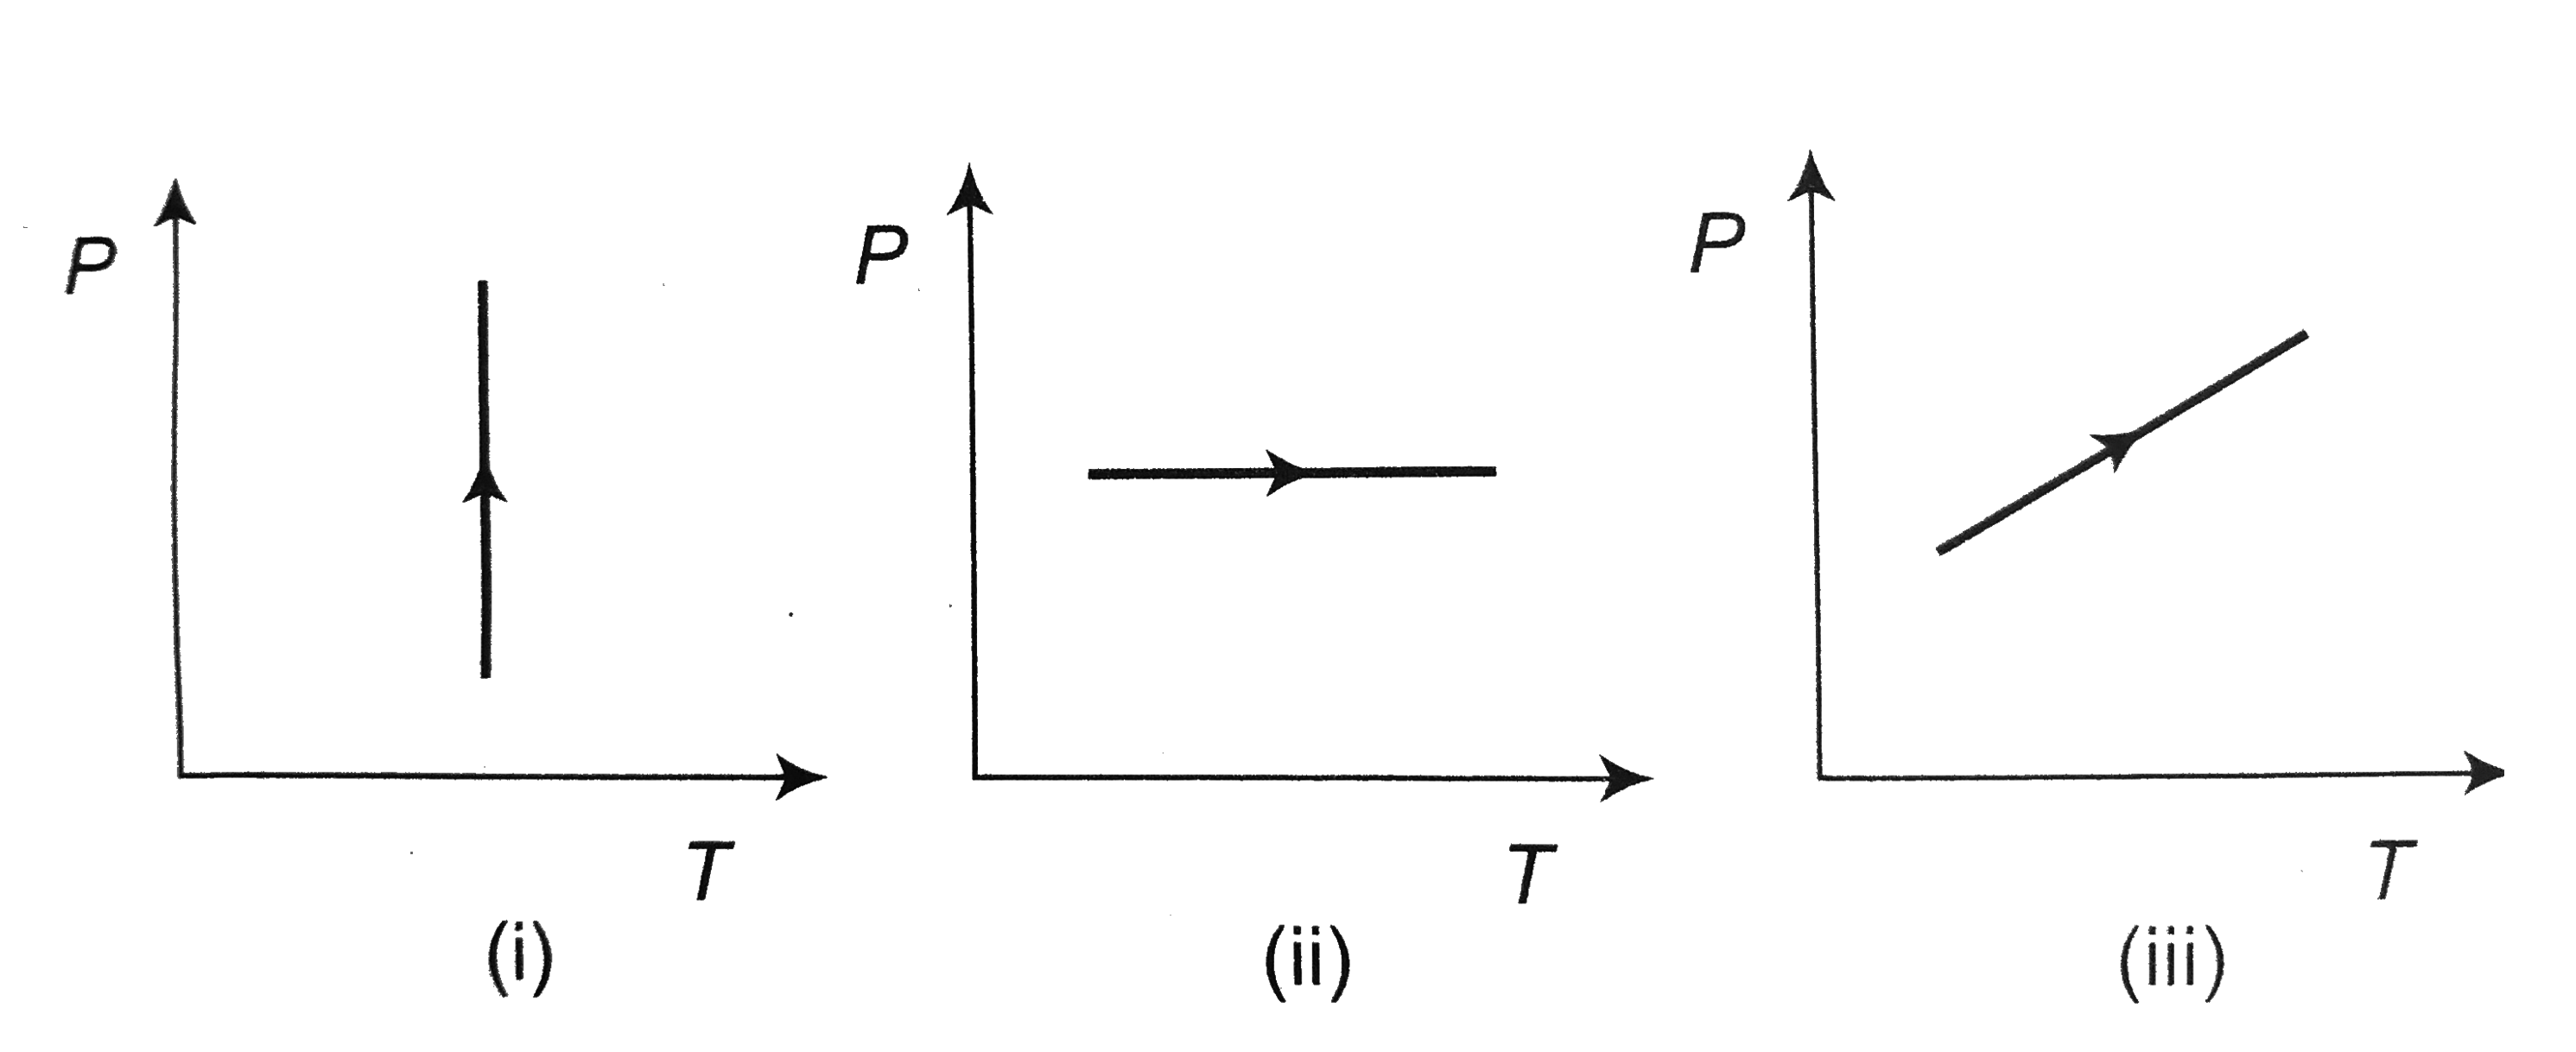
Pressure versus temperature graphs of an ideal gas are as shown in figure. Choose the wrong statement
 View Solution
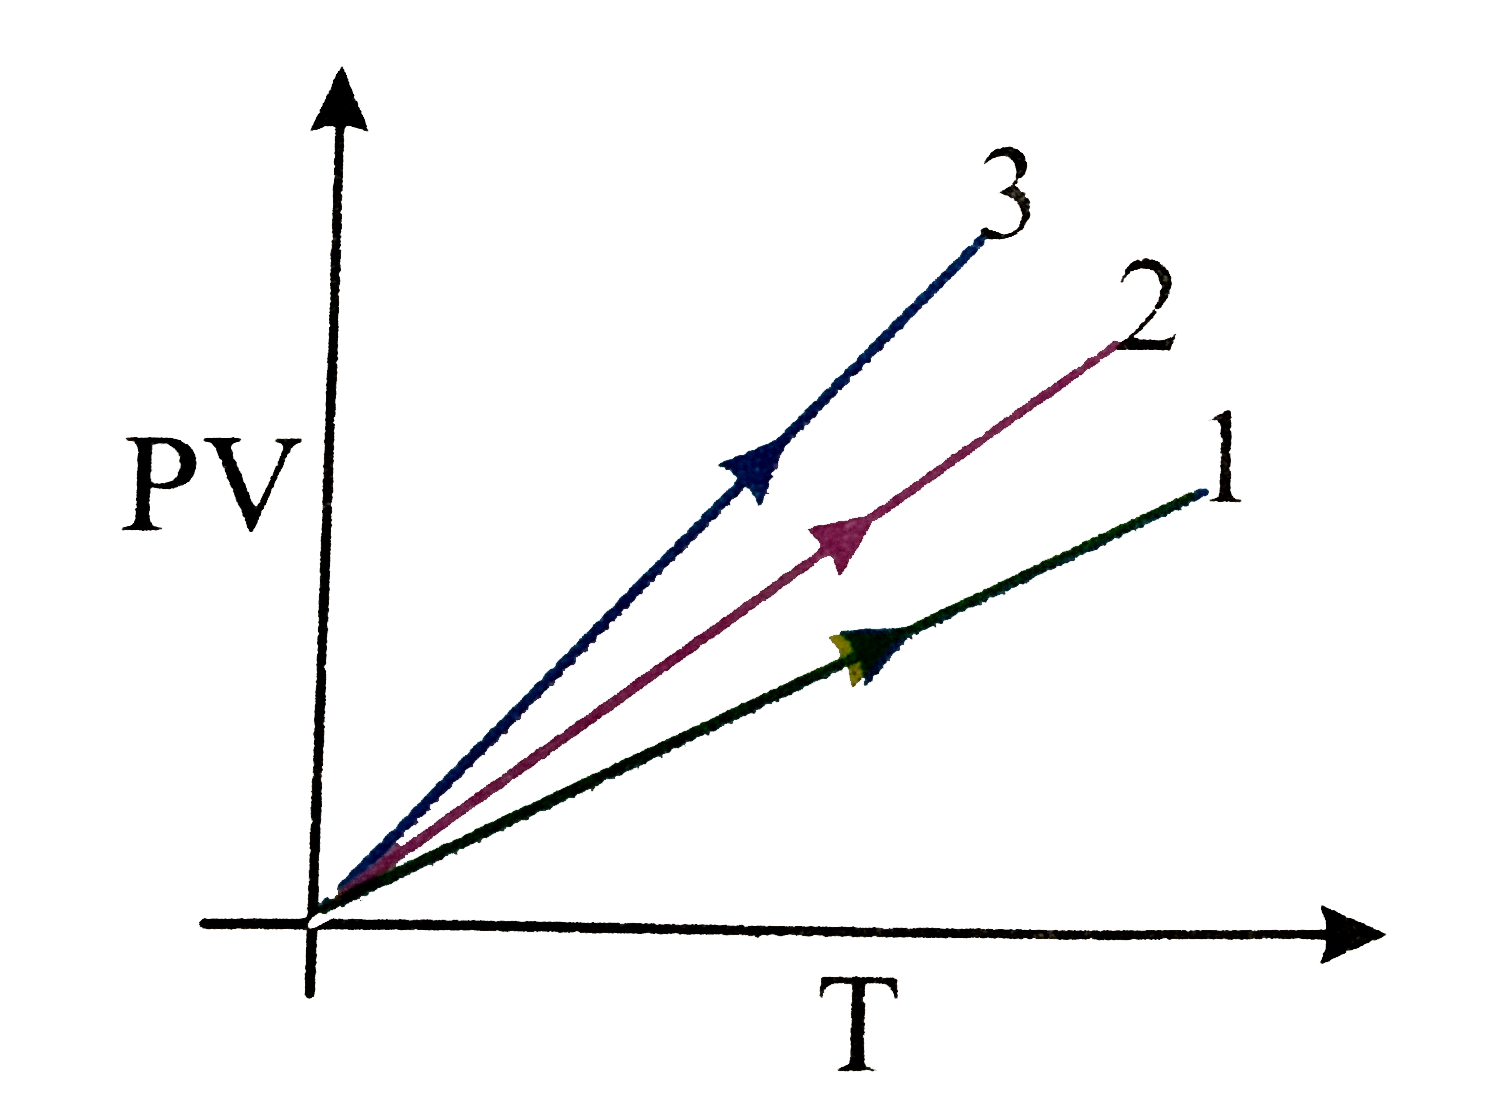
PV versus T graph of equal masses of H2, He and CO2 is shown in figure. Choose the correct alternative?
 View Solution
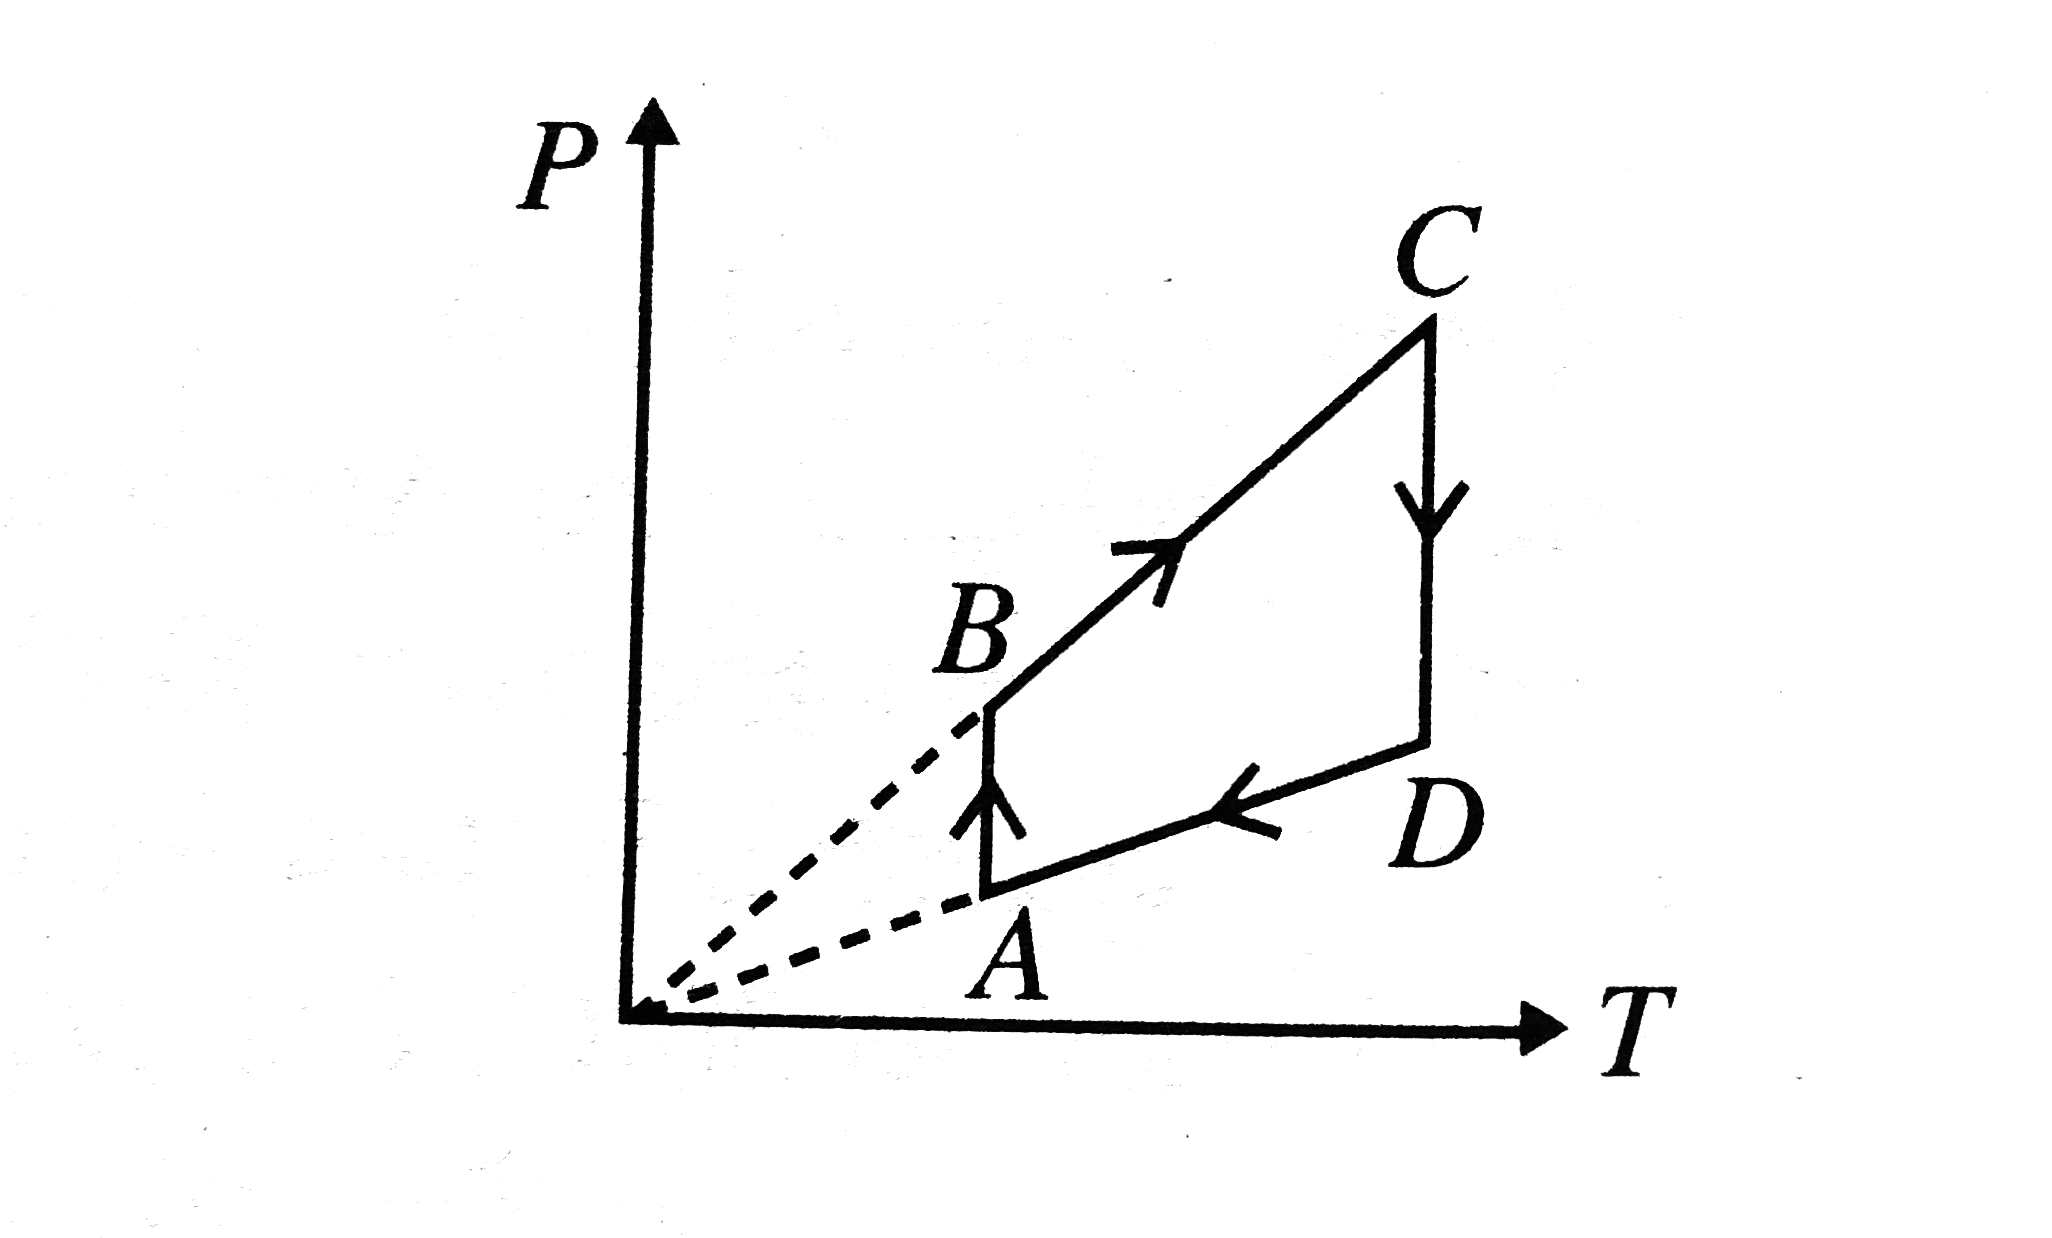
Pressure versus temperature graph of an ideal gas as shown in Fig.
Corresponding density (ρ) versus volume (V) graph will be
 View Solution
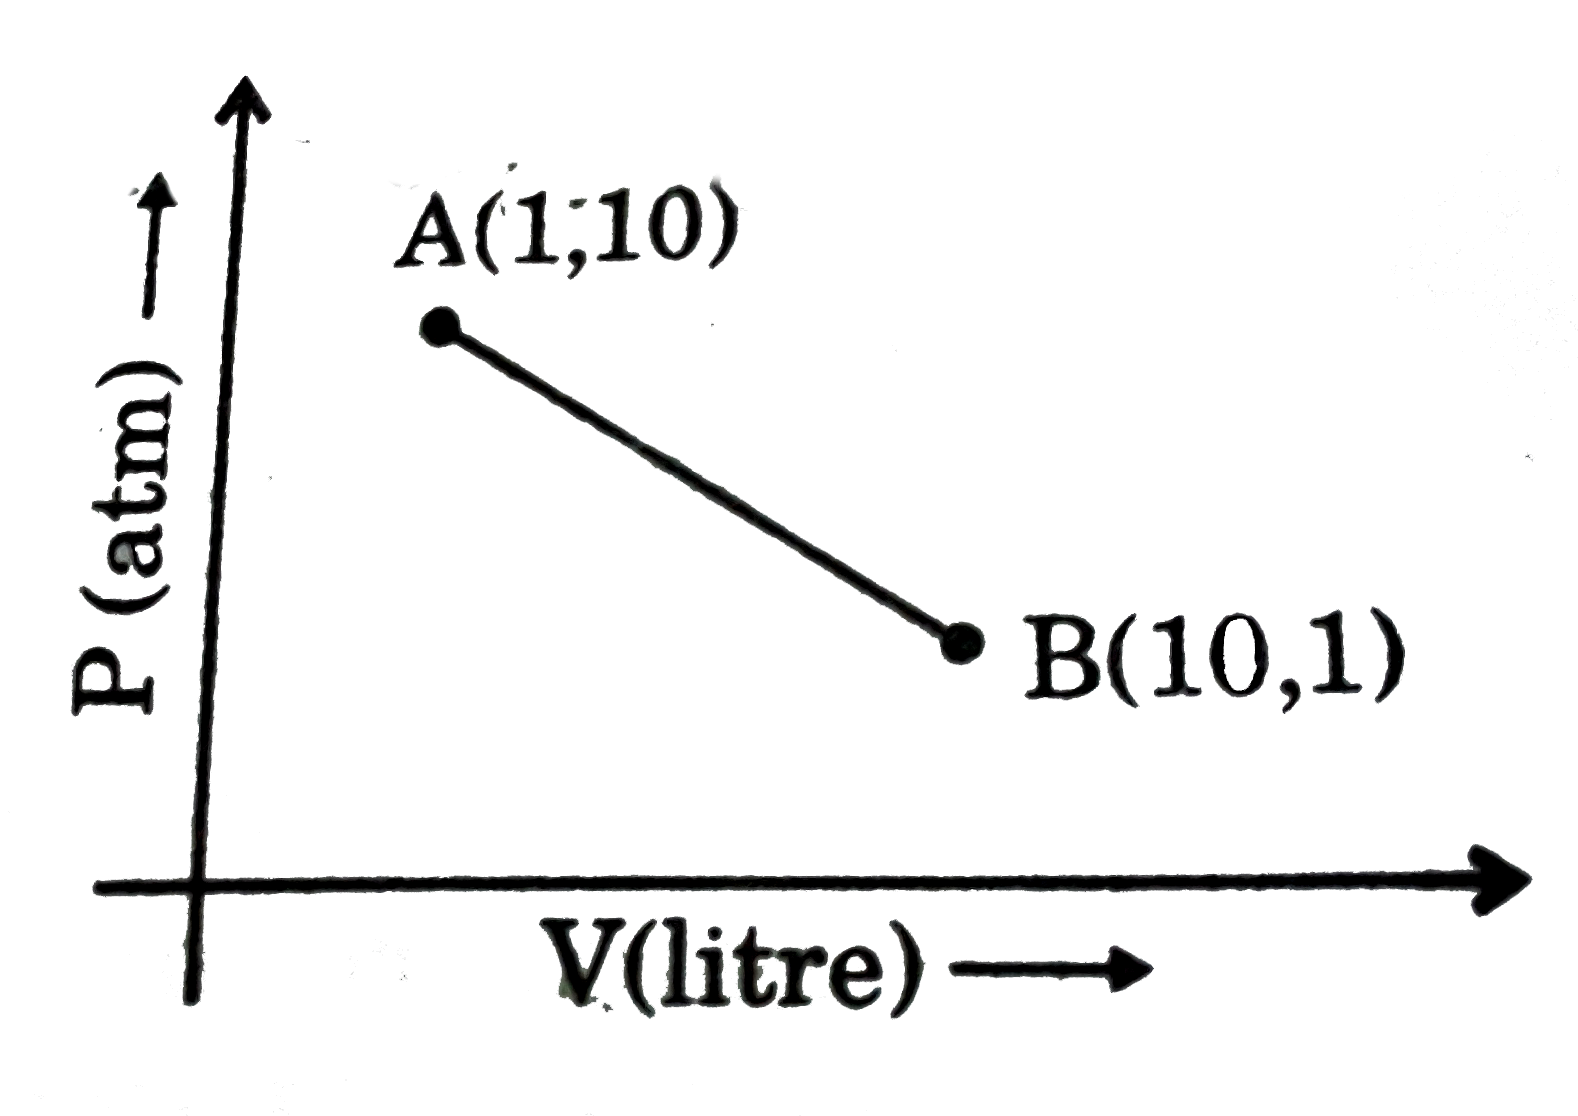
For 1 mole of an ideal gas, a graph of pressure vs volume is plotted as shown. Which of the following option is correct ?
 View Solution
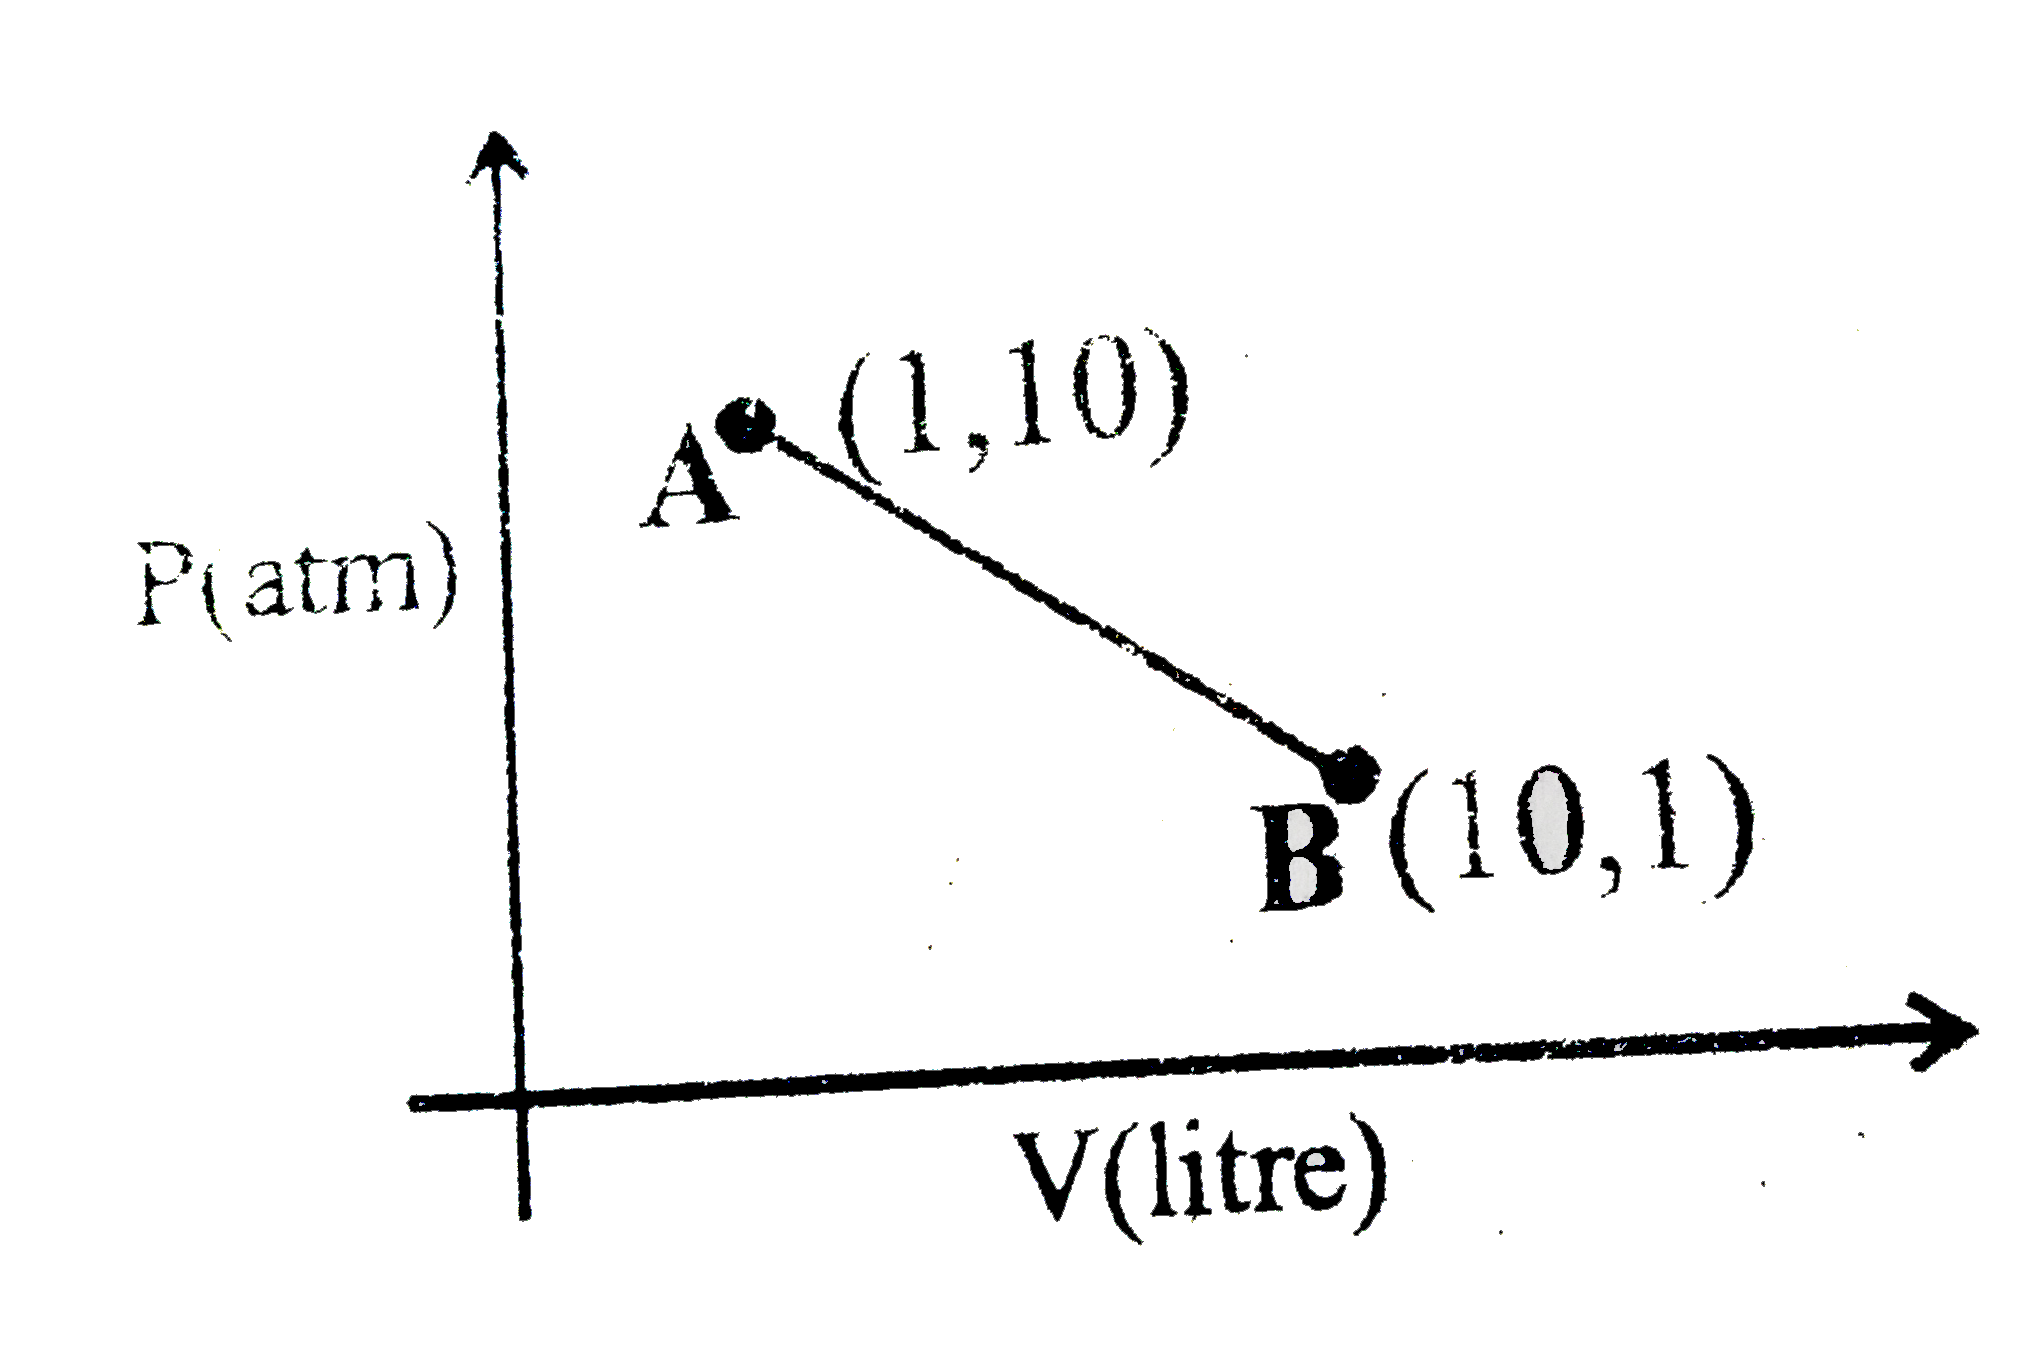
For 1 mole of an ideal gas, a graph of pressure vs volume is plotted as shown. Which of the following options is correct ?
 View Solution


