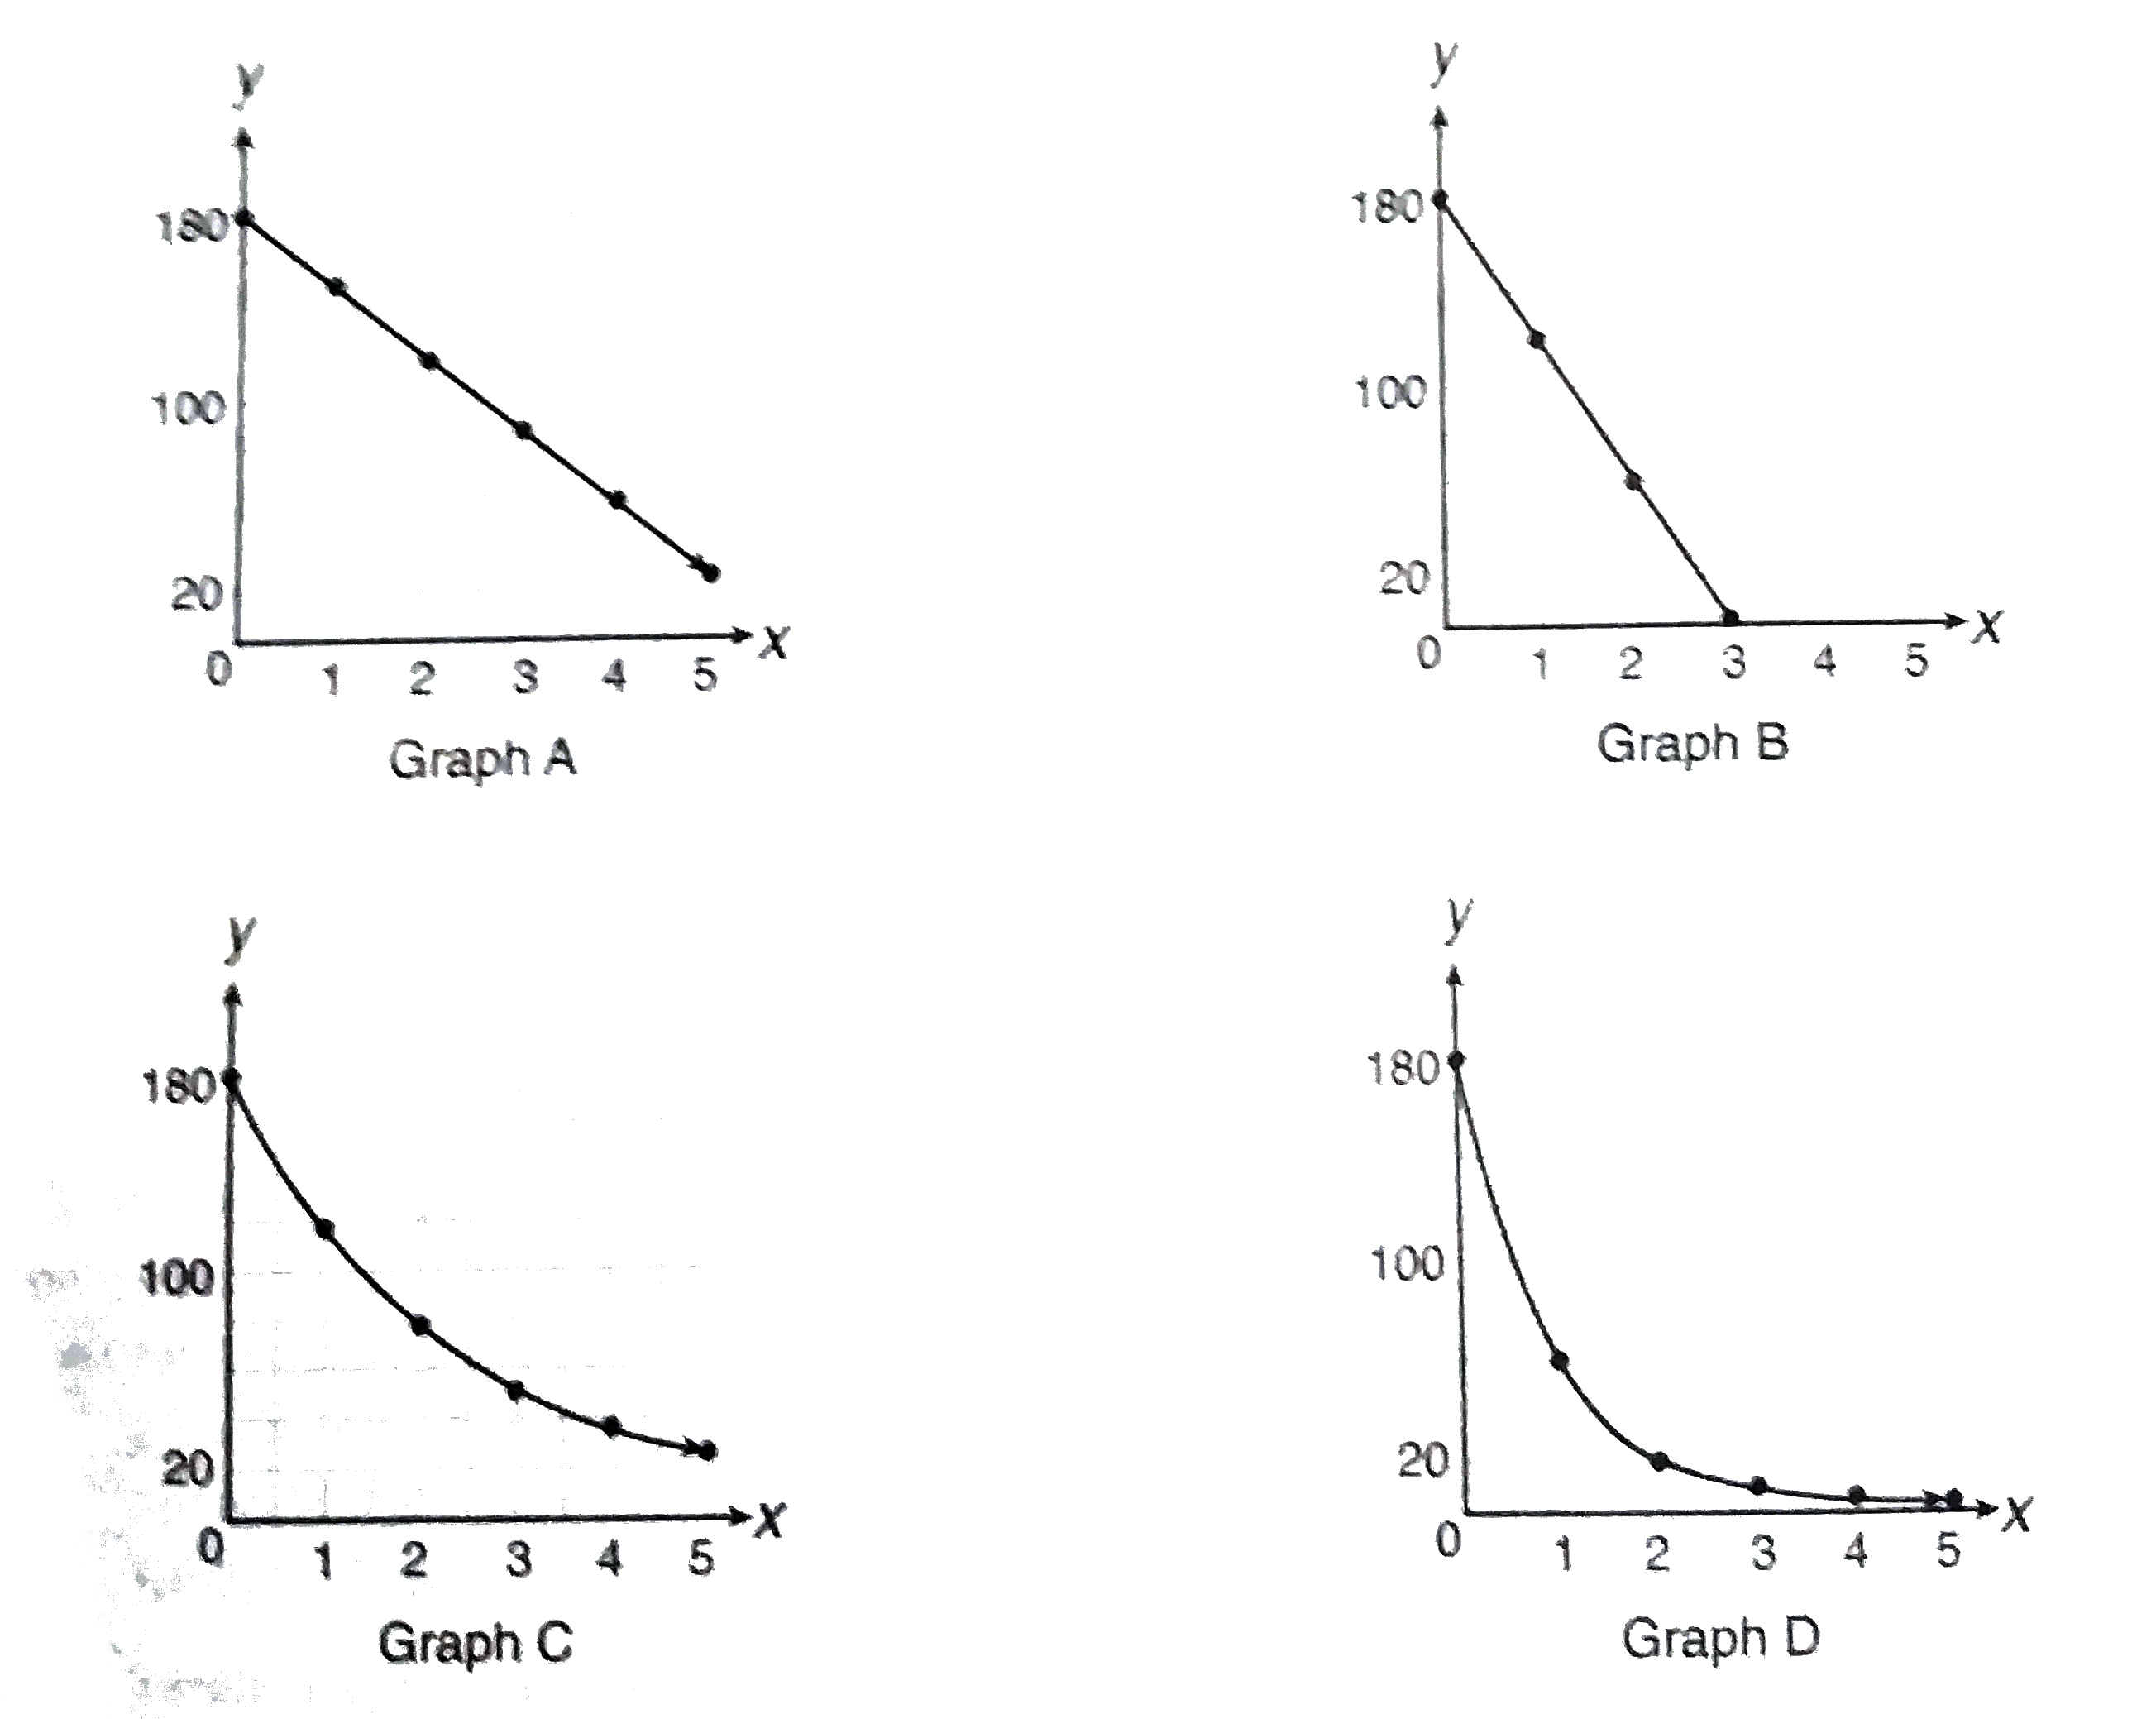
On January 1, a share of a certain stock costs of $180. Each month decreased by one-third. If x represents the time, in months, and y represents the cost of the stock, in dollars, which graph best represents the cost of a share over the following 5 months?
Graph A
Graph B
Graph C
Graph D
The correct Answer is:C
Step by step video, text & image solution for On January 1, a share of a certain stock costs of $180. Each month decreased by one-third. If x represents the time, in months, and y represents the cost of the stock, in dollars, which graph best represents the cost of a share over the following 5 months? by Maths experts to help you in doubts & scoring excellent marks in Class 12 exams.
Updated on:21/07/2023Topper's Solved these Questions
- PROBLEM SOLVING AND DATA ANALYSISBOOK - ENGLISH SATCHAPTER - PROBLEM SOLVING AND DATA ANALYSISEXERCISE - Grib-In
40 Videos
- PROBLEM SOLVING AND DATA ANALYSISBOOK - ENGLISH SATCHAPTER - PROBLEM SOLVING AND DATA ANALYSISEXERCISE - Grib-In
40 Videos
- PROBLEM SOLVING AND DATA ANALYSISBOOK - ENGLISH SATCHAPTER - PROBLEM SOLVING AND DATA ANALYSISEXERCISE - EXERICSE
80 Videos
- PROBLEMS IN CONTEXT BOOK - ENGLISH SATCHAPTER - PROBLEMS IN CONTEXT EXERCISE - PRACTICE TEST
10 Videos
Similar Questions
Knowledge Check
Which of the following graphs represents the soution set for 5x−10y>6 ?
A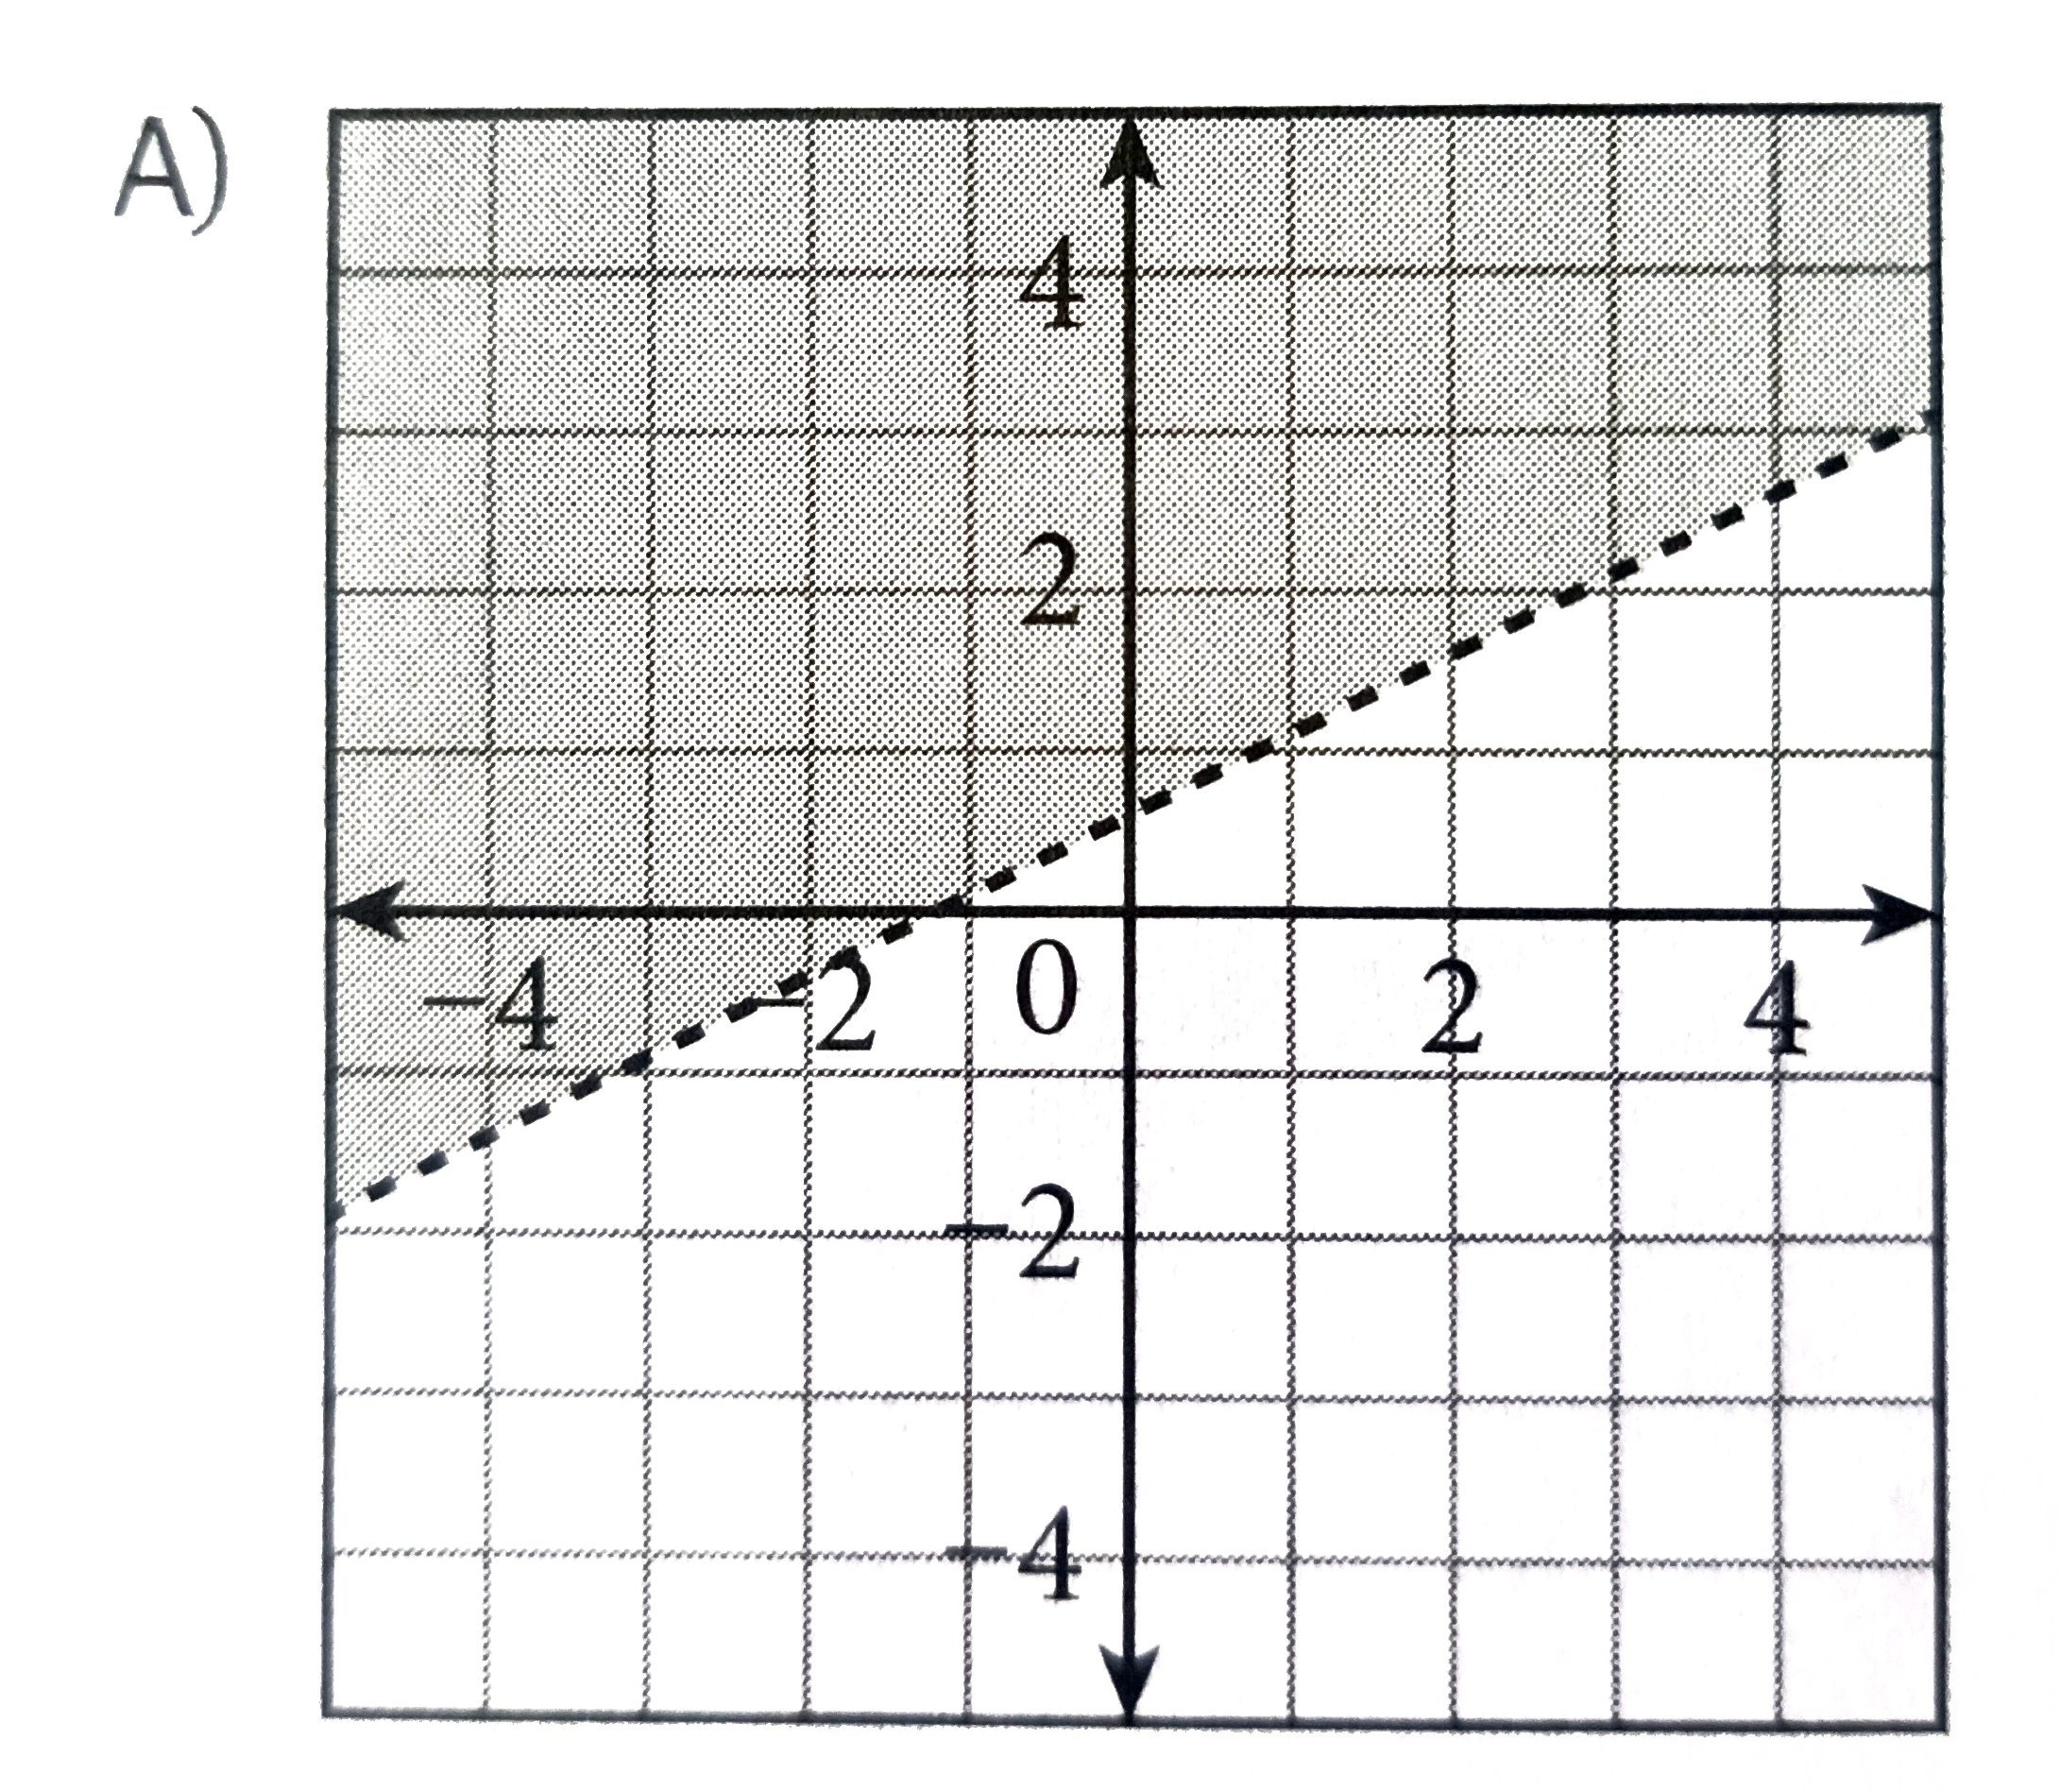 B
B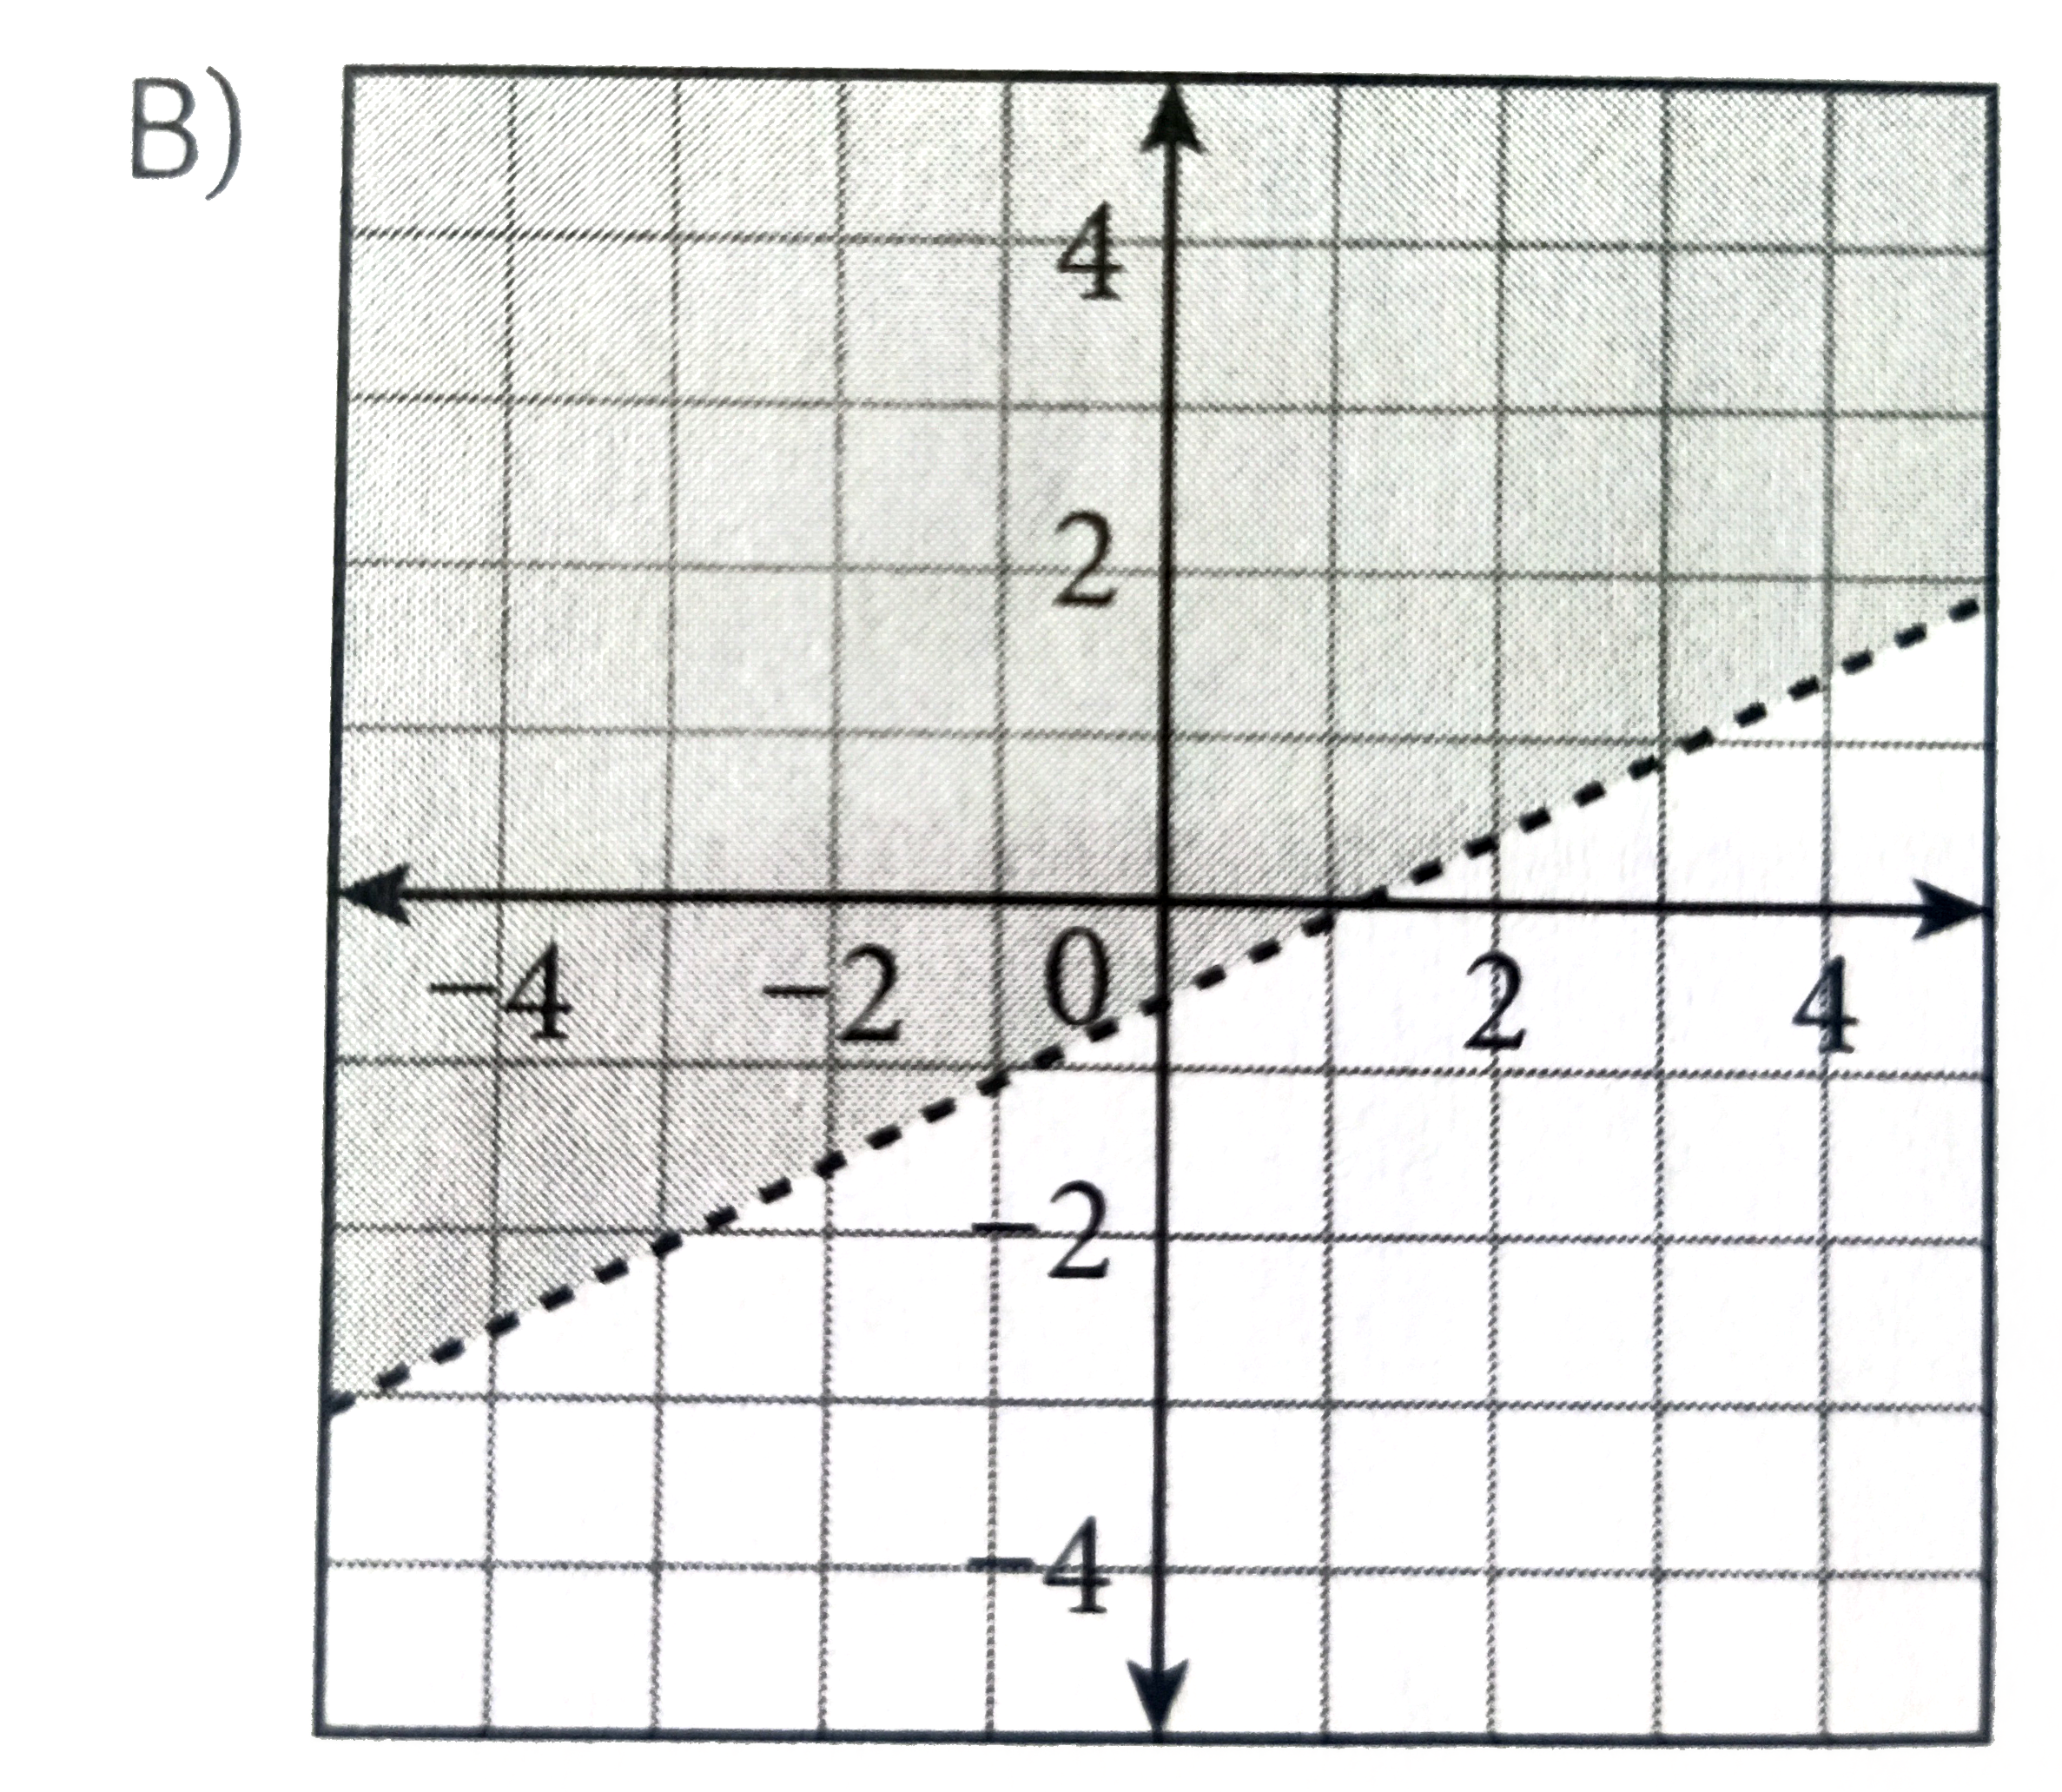 C
C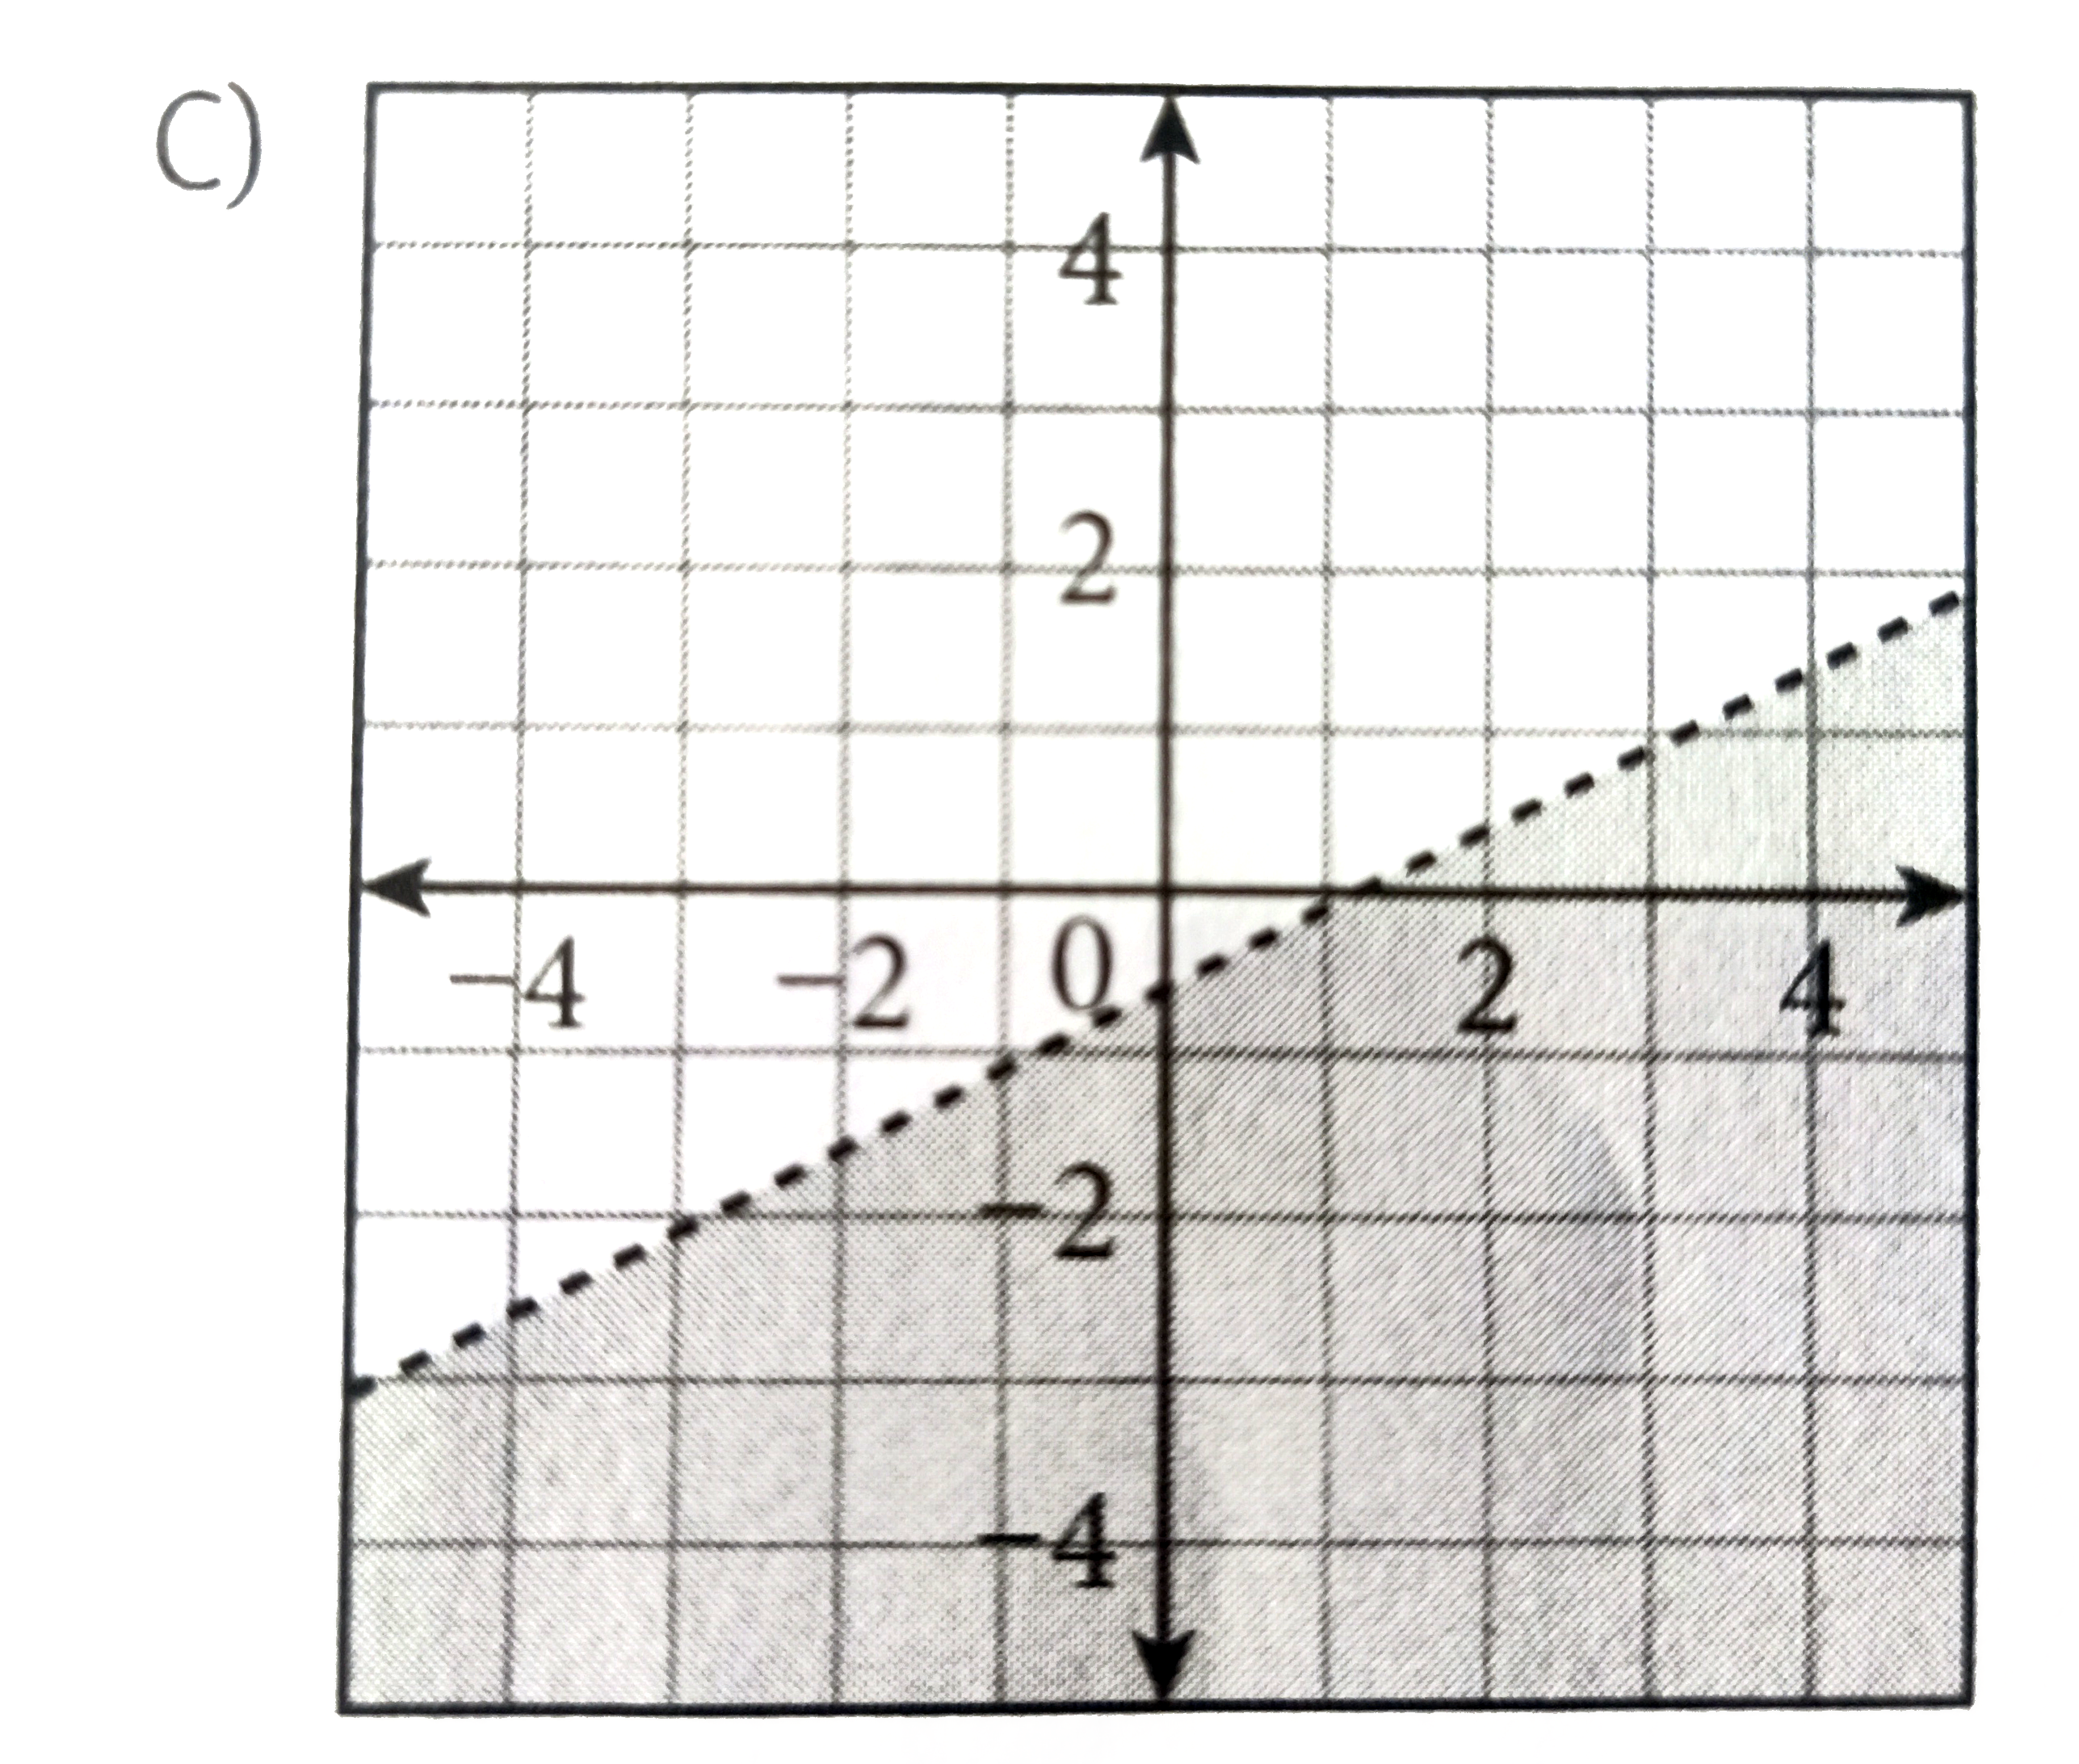 D
D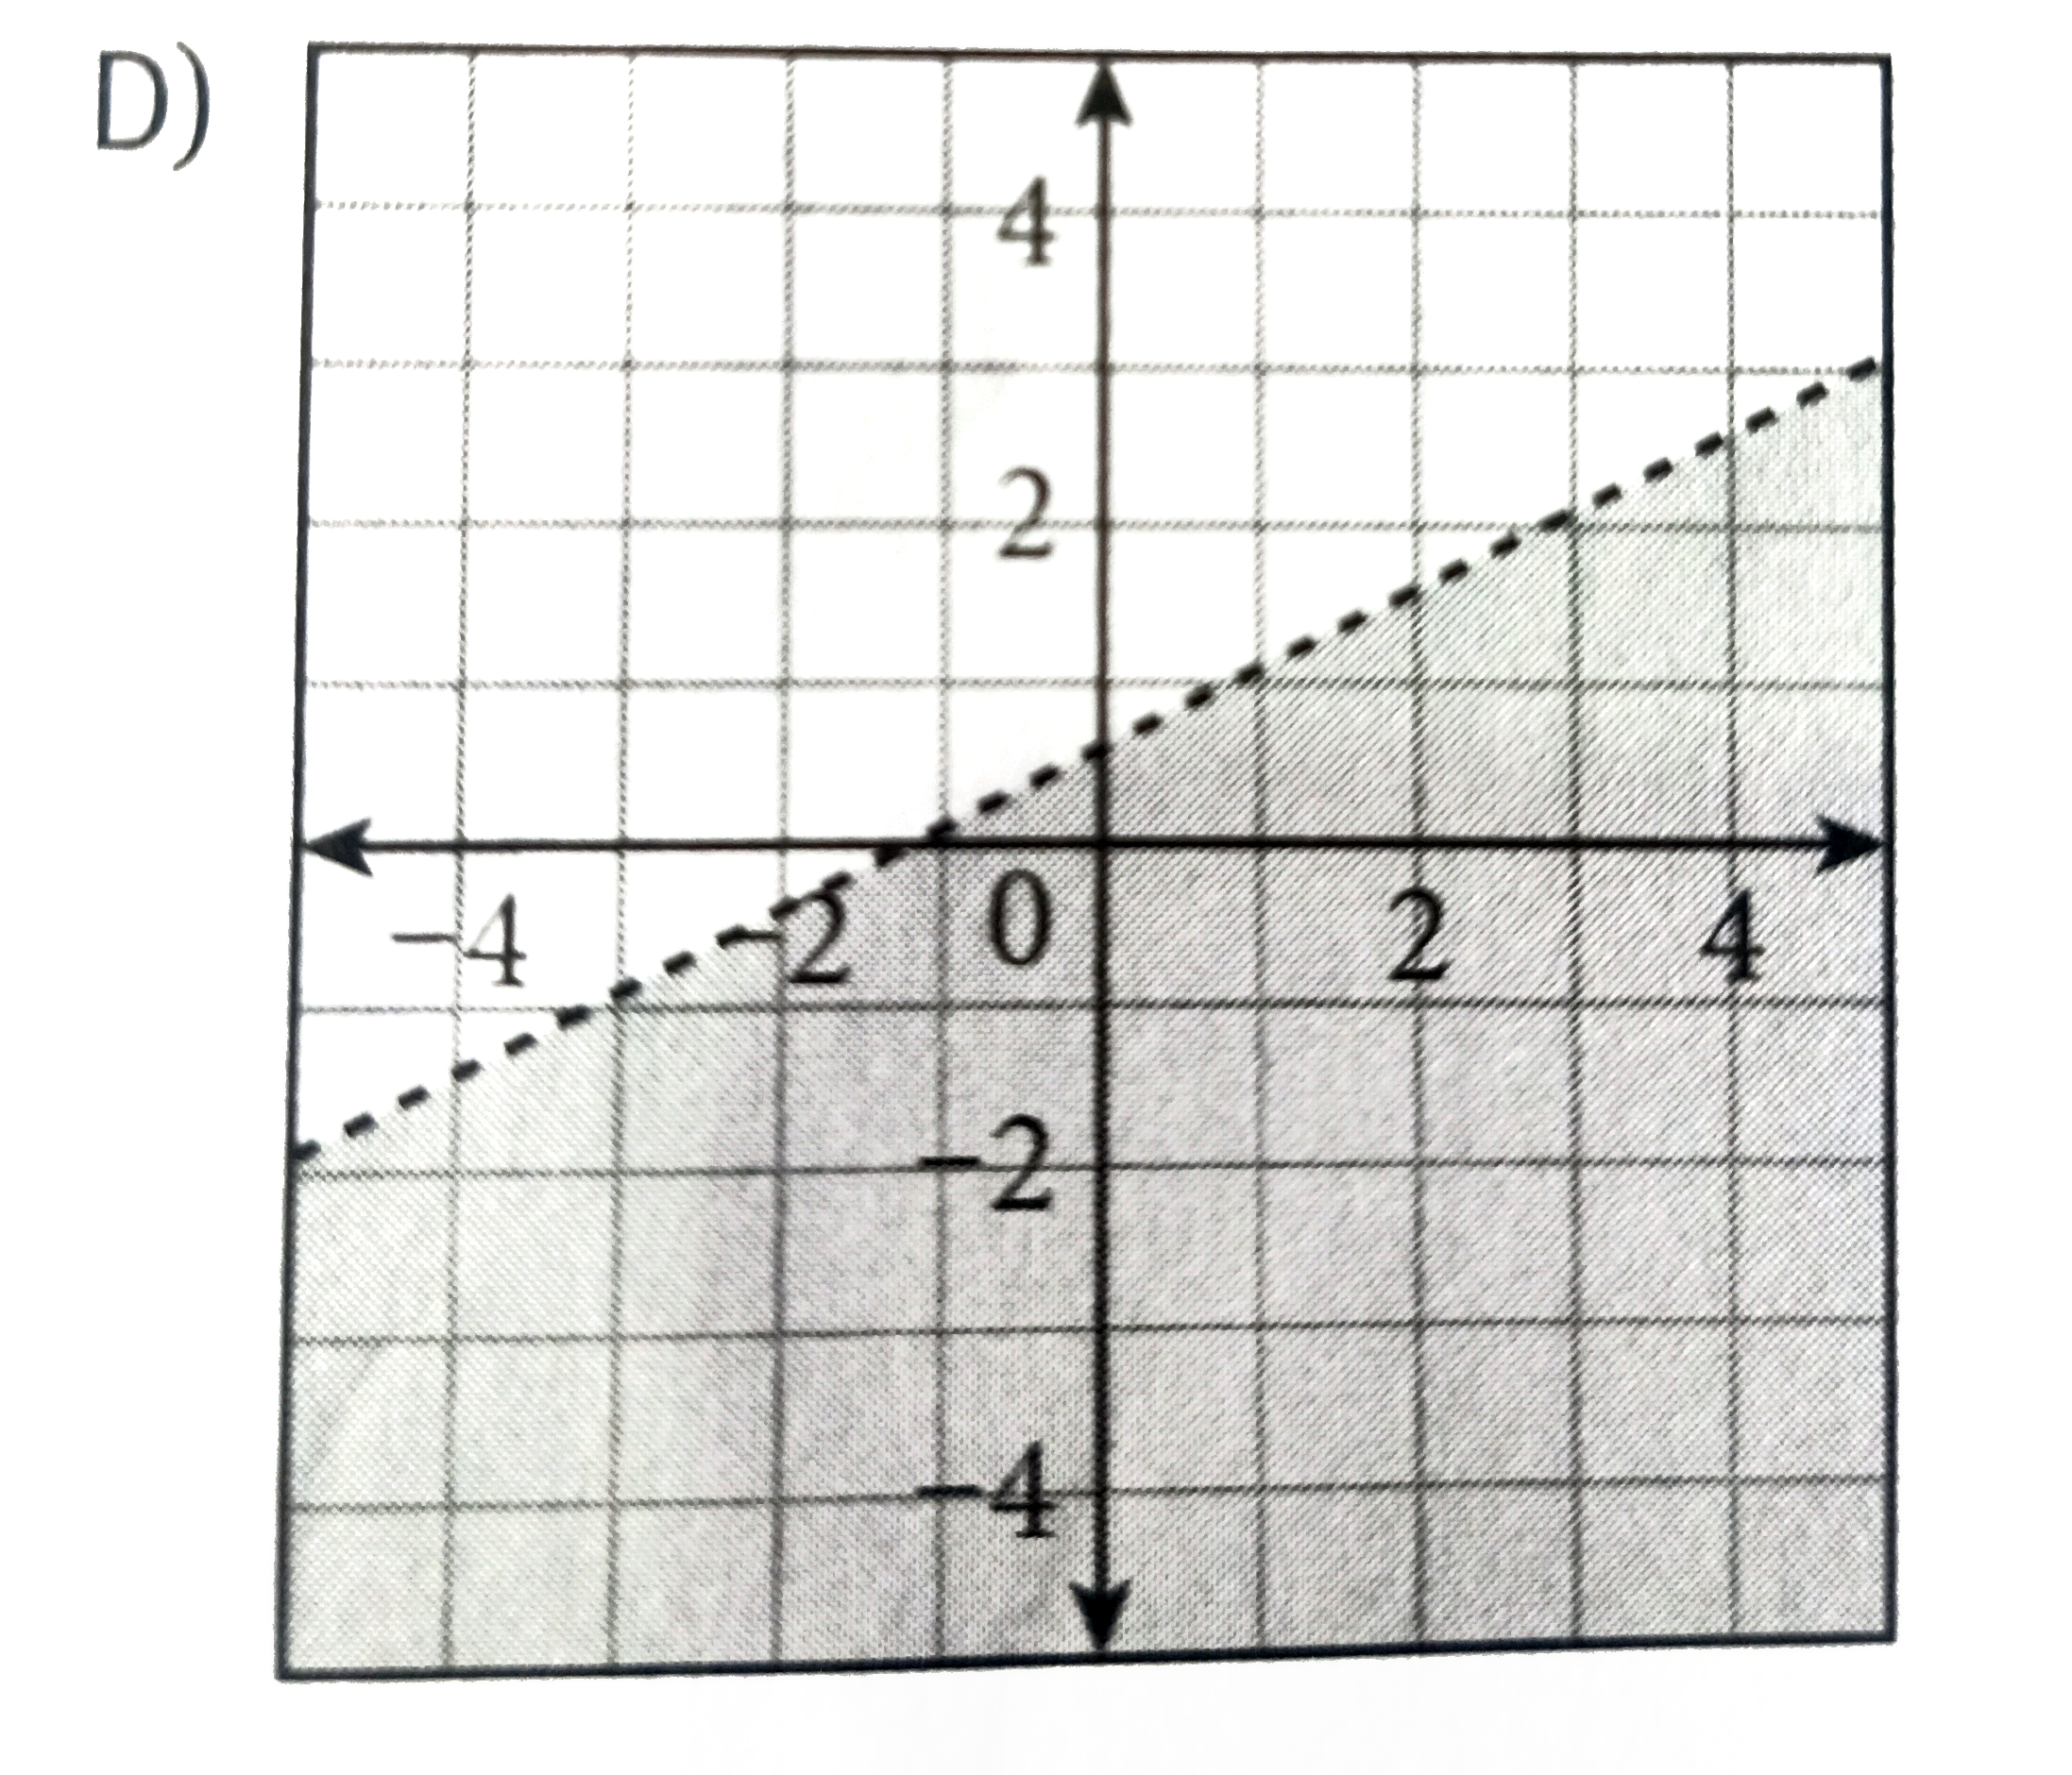
Tickets to the annual Follies Show at Littleton High School are $4 for adults and $2.50 for students. There is a cost of $750 to produce the show. If the x-axis represents the number of adult tickets sold and the y-axis represents the number of student tickets sold, which graph represents all the possible combinations of ticket sales that allow the junior class to at least cover the cost of the show ?
A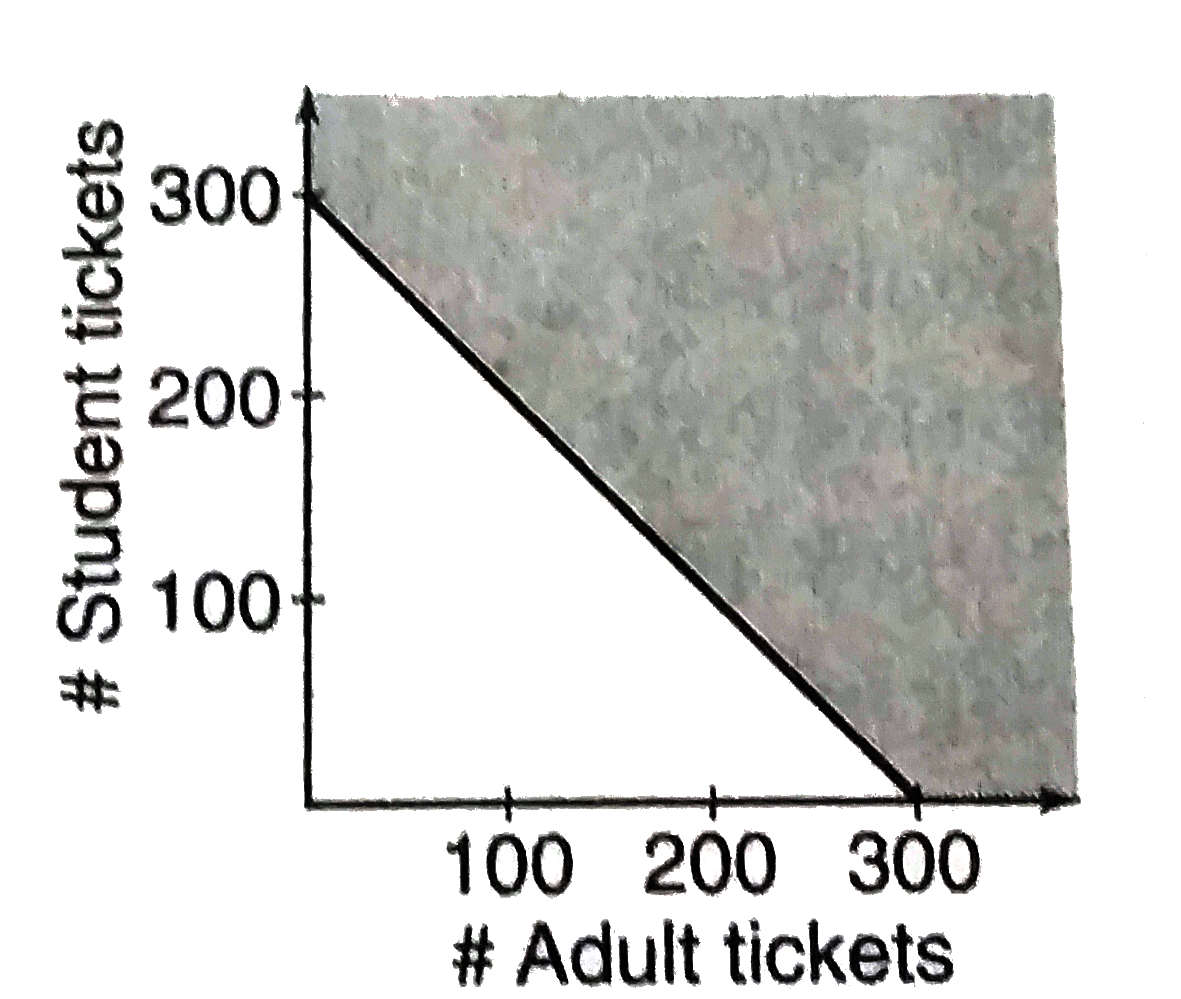 B
B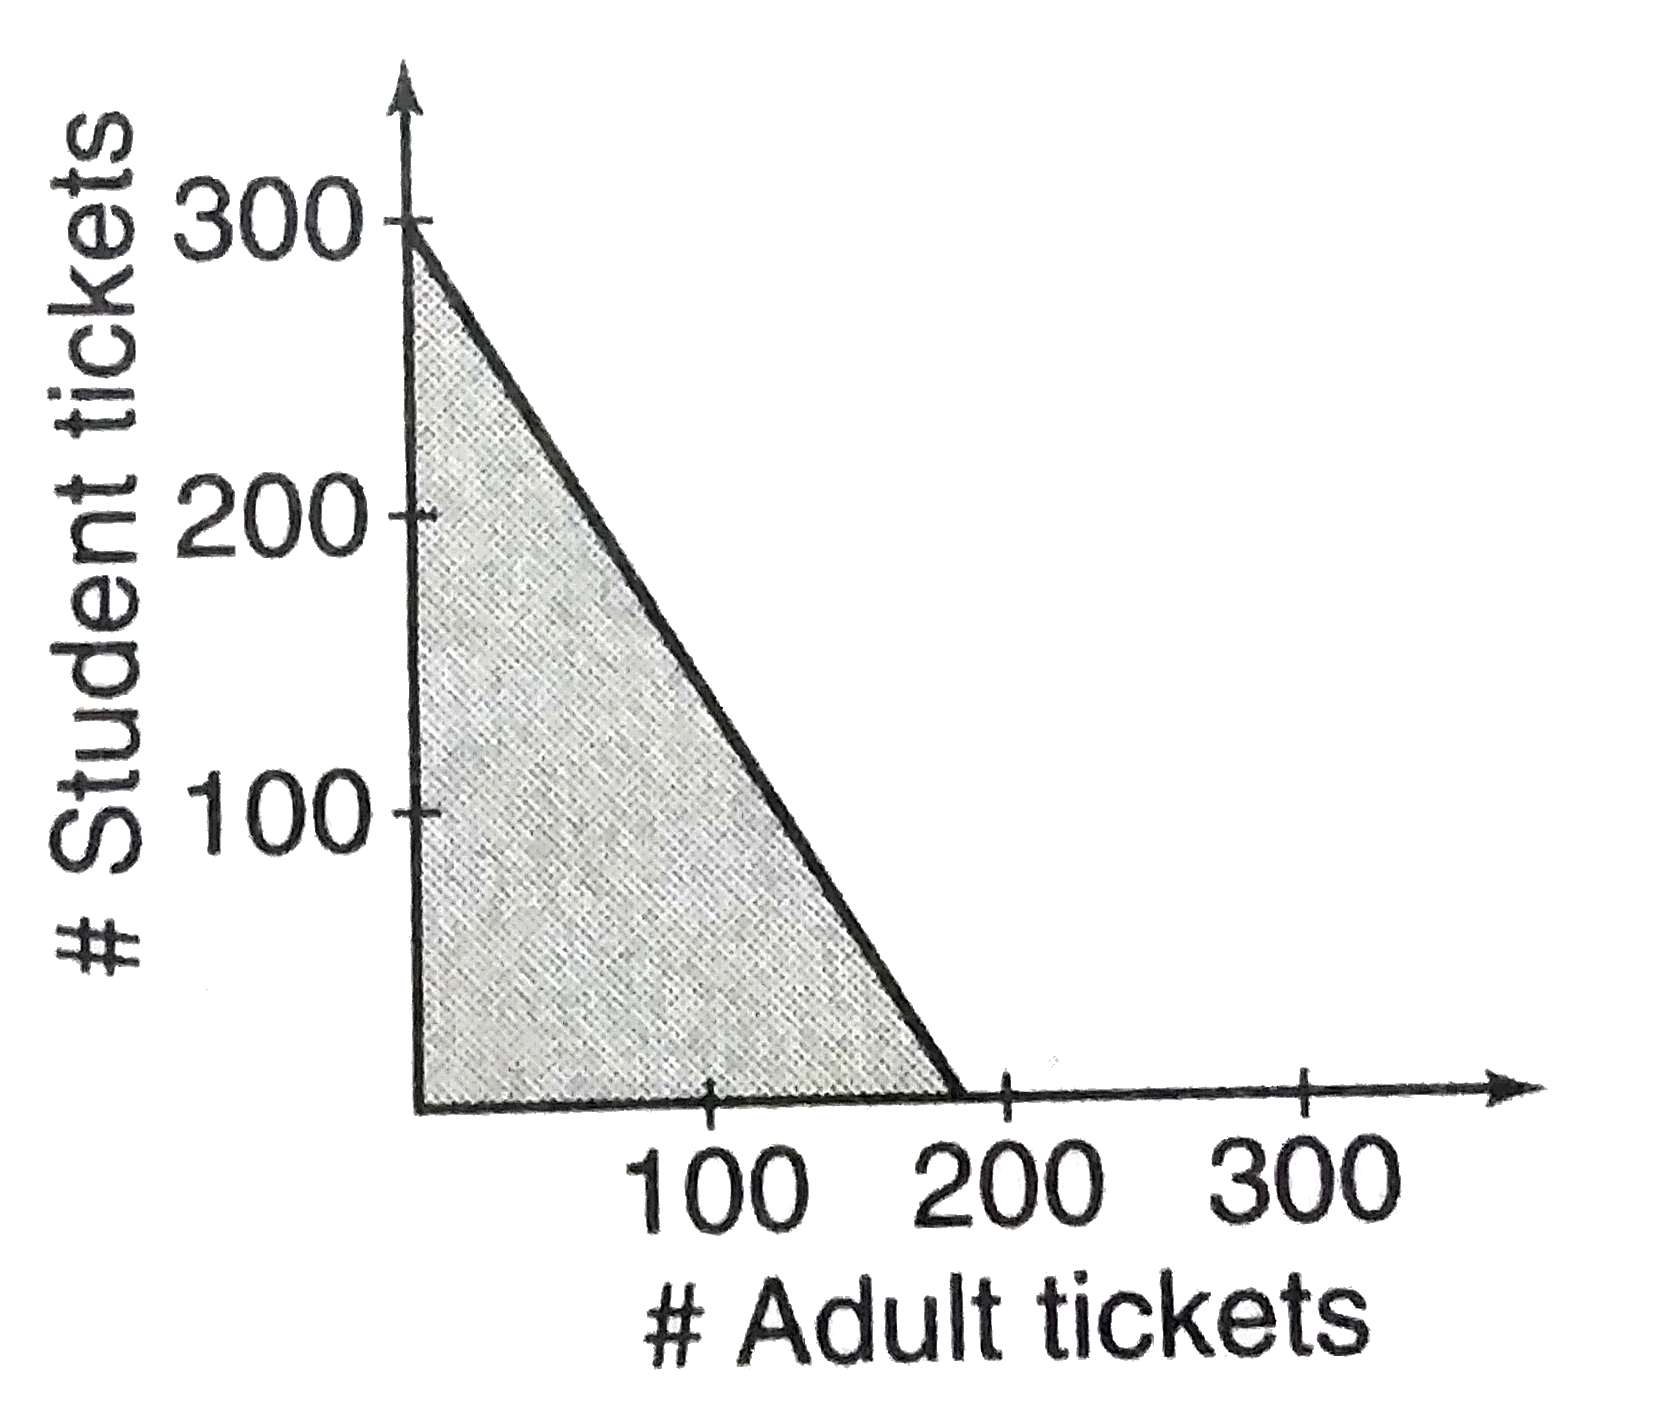 C
C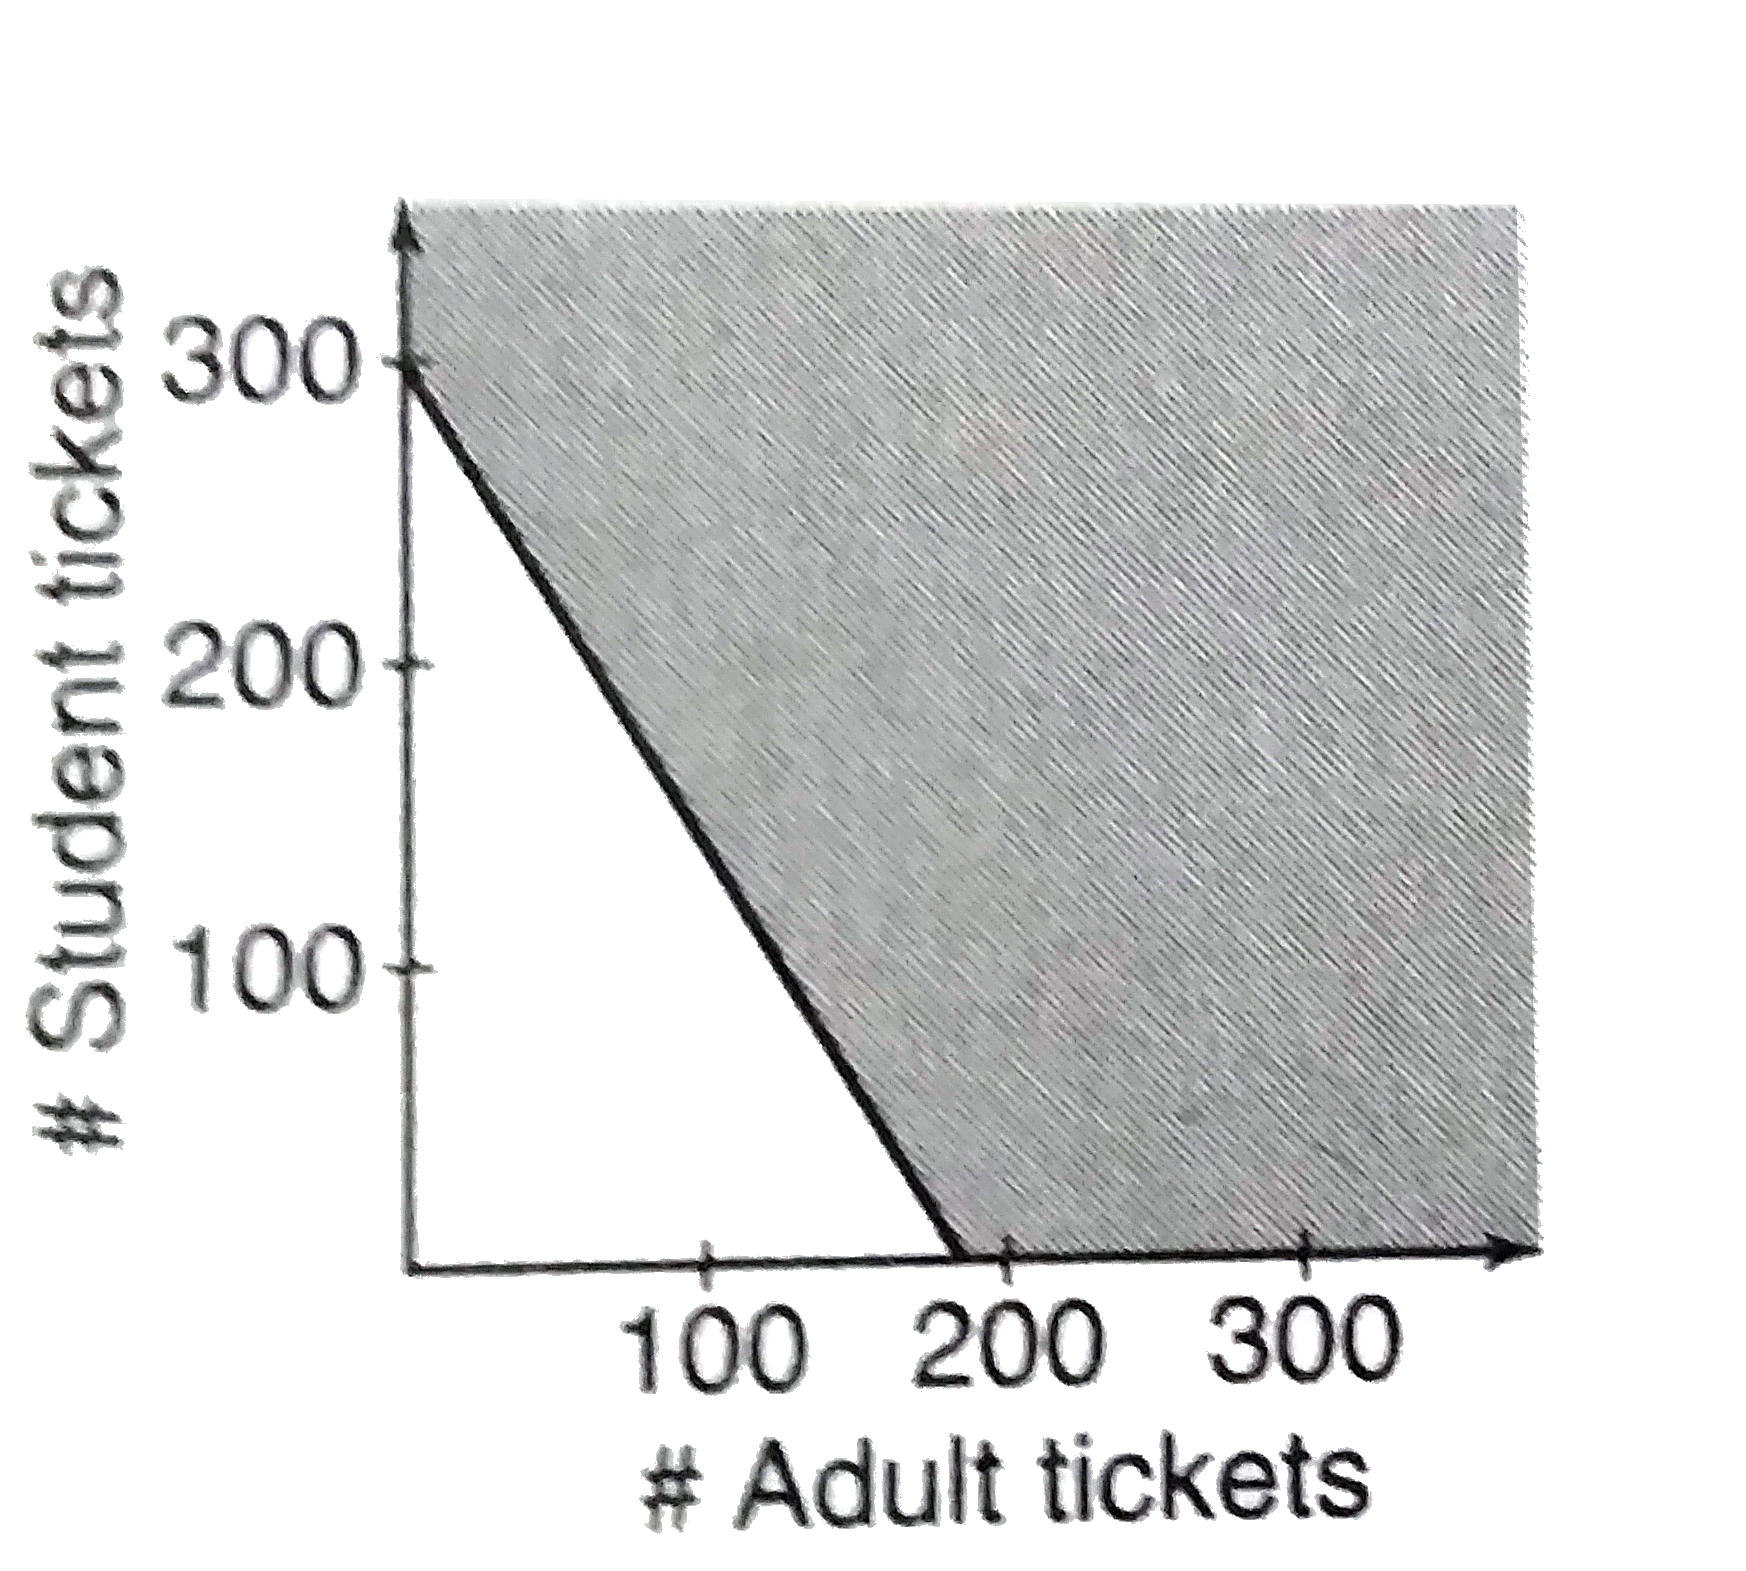 D
D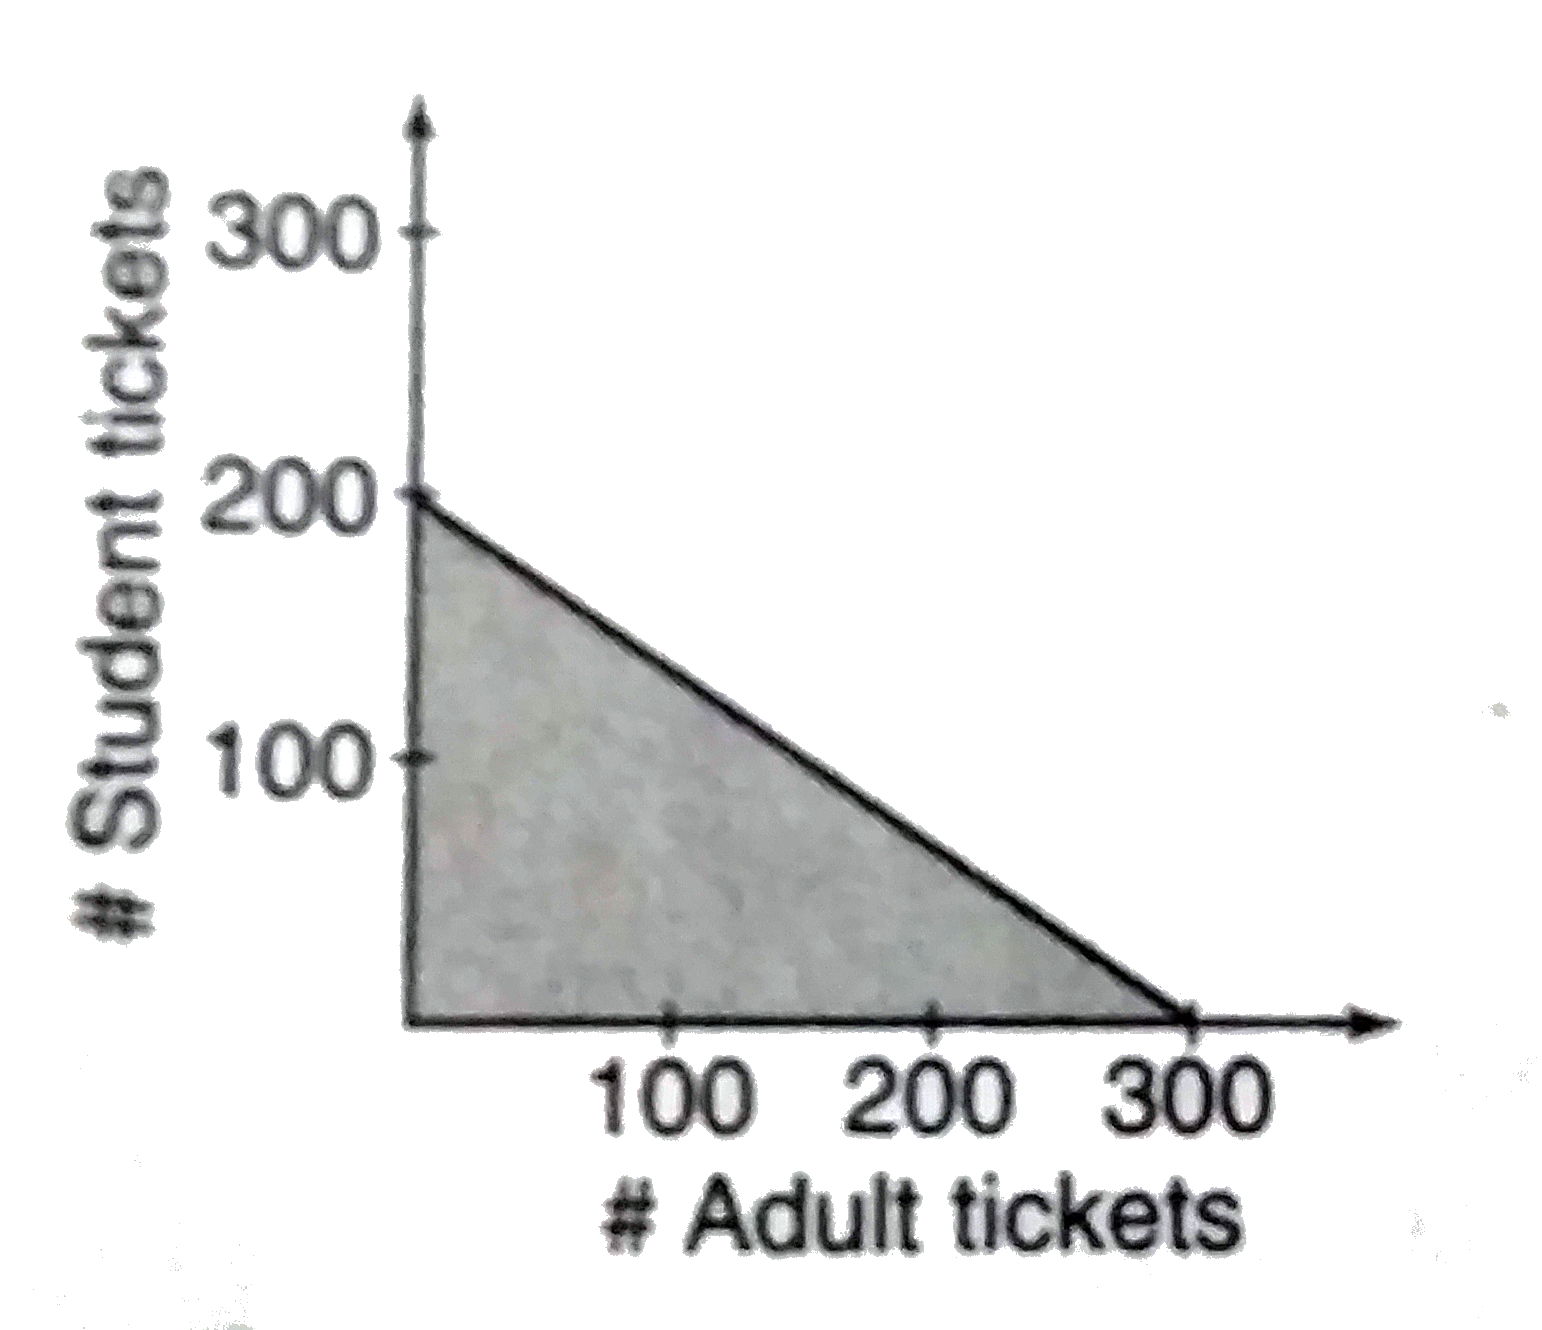
Ezekiel has $5.00 to spend onsnacks. Candy bars cost $0.60 each, gum costs $0.50 per pack and nuts are priced at $1.29 per small bag. If c represents the number of candy bars, g represnts the number of packs of gum, and n represents the number of bags of nuts, whichh of the following inequalities correctly describes Ezekiel's choices ?
Ac0.60+g0.50+n1.29≤15Bc+g+n≤5C0.60c+0.50g+1.29n≤5.00D0.60+0.50g+1.29n≥5.00
A text messaging plan charges a flat fee of $5 per month for up to 100 text messages sent plus $0.25 for each additional text message sent that month. Which of the following graphs represents the cost, y, of sending x texts in a month?
View SolutionThe total cost, y for Rosa to go on vacation for x days given by the equation y=A+(H+M)x, where A represents the airface, H represents the cost per day for the hotel, and M represents the cost the metal. If the relationship between the total cost of the vacation and the number of the days of the vacation is graphed on the xy-plane, what does the slope of the line represents?
View SolutionThe 2005 to 2015 population density of a certain town can be modeled by the equation d=21.3y+1,927.3, where y represents the number of years since 2005 and d represent the population density .Which of the following best describes the meaning of the number 21,3 in the equation?
View SolutionTo make its sales goals for the month, a toy manufacture must sell at least $10,400 for of toy hoops and basketballs. Toy hoops sell for $8 and basketballs sell for $25. The company hopes to sell more than three times as many basketballs as toy hoops. If h represents the number of toy hoops and b represents the number of basketballs, where h and b are positive integer, which of the following systemsof inequalities best describes this situation ?
View SolutionThe cost of using a telephone in a hotel meeting room is $0.20 per minute. Which of the following equations represents the total cost c, in dollars, for h hours of phone use?
View Solution

