Pictorial representation of 3×23 is:


To find the pictorial representation of 3×23, we can follow these steps:
Step 1: Understand the Expression
The expression 3×23 means that we are adding 23 three times. This can also be expressed as:
23+23+23
Step 2: Draw Circles
Next, we will draw three circles to represent the three parts we are adding.
1. Draw the first circle.
2. Draw the second circle.
3. Draw the third circle.
Step 3: Divide Each Circle
Now, we need to divide each of the three circles into three equal parts since the denominator of our fraction is 3.
1. For each circle, draw two lines to create three equal sections.
Step 4: Shade the Required Parts
Now, we will shade two out of the three parts in each circle to represent 23.
1. In the first circle, shade 2 parts out of the 3.
2. In the second circle, shade 2 parts out of the 3.
3. In the third circle, shade 2 parts out of the 3.
Step 5: Final Representation
After shading, we will have three circles with two parts shaded in each, visually representing 3×23.
Summary
The pictorial representation of 3×23 consists of three circles, each divided into three equal parts, with two parts shaded in each circle.
---
The expression 3×23 means that we are adding 23 three times. This can also be expressed as:
23+23+23
Next, we will draw three circles to represent the three parts we are adding.
2. Draw the second circle.
3. Draw the third circle.
Now, we need to divide each of the three circles into three equal parts since the denominator of our fraction is 3.
Now, we will shade two out of the three parts in each circle to represent 23.
2. In the second circle, shade 2 parts out of the 3.
3. In the third circle, shade 2 parts out of the 3.
After shading, we will have three circles with two parts shaded in each, visually representing 3×23.
The pictorial representation of 3×23 consists of three circles, each divided into three equal parts, with two parts shaded in each circle.
Topper's Solved these Questions
- FRACTIONS AND DECIMALSBOOK - NCERT EXEMPLARCHAPTER - FRACTIONS AND DECIMALSEXERCISE - EXERCISE (FIND THE ERROR)
3 Videos
- FRACTIONS AND DECIMALSBOOK - NCERT EXEMPLARCHAPTER - FRACTIONS AND DECIMALSEXERCISE - THINK AND DISCUSS
9 Videos
- EXPONENTS AND POWERSBOOK - NCERT EXEMPLARCHAPTER - EXPONENTS AND POWERSEXERCISE - EXERCISE
136 Videos
- INTEGERSBOOK - NCERT EXEMPLARCHAPTER - INTEGERSEXERCISE - VOCOBULARY
5 Videos
Similar Questions
Knowledge Check
The pictorial representation of a program or alogrithm is called a .....
AchartBsalve chartCflow chartDmix chart
The pictorial representation of the algorithm of a problem is know as________
View SolutionState True or False:
Pictographs and bar graphs are pictorial representations of the numerical data.
View SolutionIn the pictorial representation of an orbital, what is the role of different intensity of shading
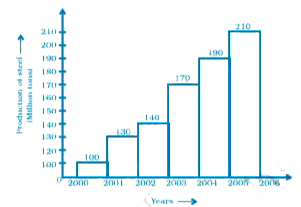
View Solutionbar graph and their construction
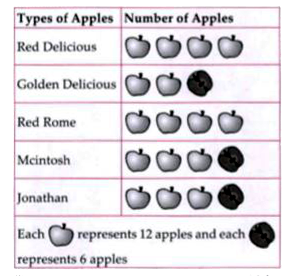
View SolutionGiven below is the pictorial representation of various kind of apples in a food store which were sold.

How many apples were sold of Mcintosh variety ?
View SolutionBAR GRAPH: Definition
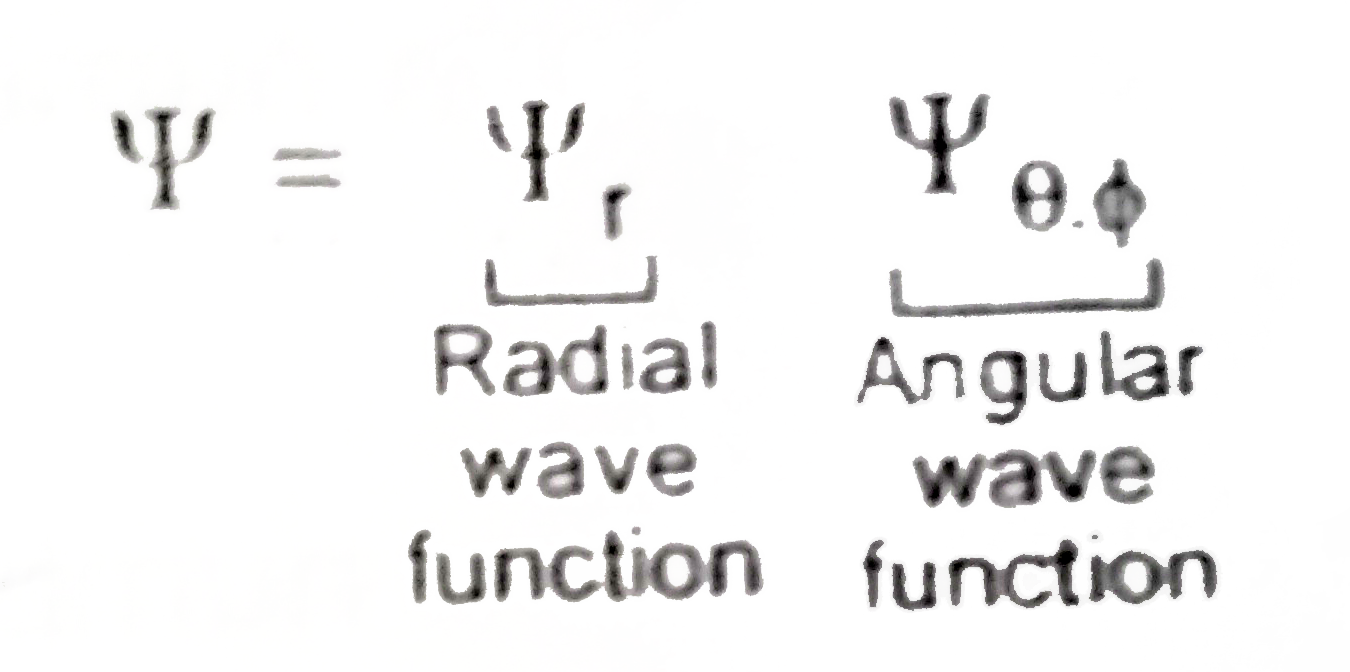
View SolutionOrbitals are the pictorial representationofΨ or Ψ2

Ψ2 tell about the probability of finding electron.
Which of the following graph is correct for 3p ?
View Solution

