Present the following frequency table for the above data.

Video Solution
Text Solution
|
Topper's Solved these Questions
- PRESENTATION OF DATA IN TABULAR FORMBOOK - RS AGGARWALCHAPTER - PRESENTATION OF DATA IN TABULAR FORMEXERCISE - EXERCISE 31
1 Videos
- PRESENTATION OF DATA IN TABULAR FORMBOOK - RS AGGARWALCHAPTER - PRESENTATION OF DATA IN TABULAR FORMEXERCISE - EXERCISE 32
1 Videos
- PRESENTATION OF DATA IN TABULAR FORMBOOK - RS AGGARWALCHAPTER - PRESENTATION OF DATA IN TABULAR FORMEXERCISE - EXERCISE 29
1 Videos
- POLYNOMIALSBOOK - RS AGGARWALCHAPTER - POLYNOMIALSEXERCISE - Multiple Choice Questions (Mcq)
32 Videos
- PROBABILITYBOOK - RS AGGARWALCHAPTER - PROBABILITYEXERCISE - Multiple Choice Questions (Mcq)
16 Videos
Similar Questions
Knowledge Check
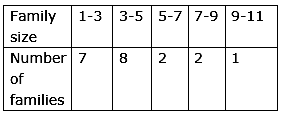
A survey conducted on 20 households in a locality by a group of students resulted in the following frequency table for the number of family members in a household:Find the mode of this data.
 A4B3.8C3.286DNone
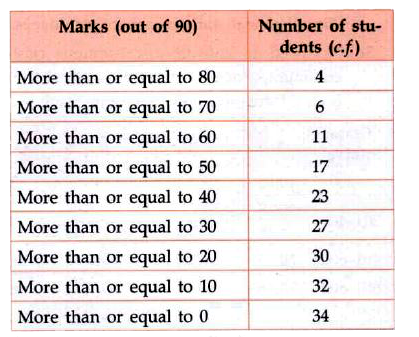
Find the median of the following frequency table :

View SolutionFind the median of the following frequency table :

View SolutionThe following data shows the number of children in 20 families

Make a frequency table for above data
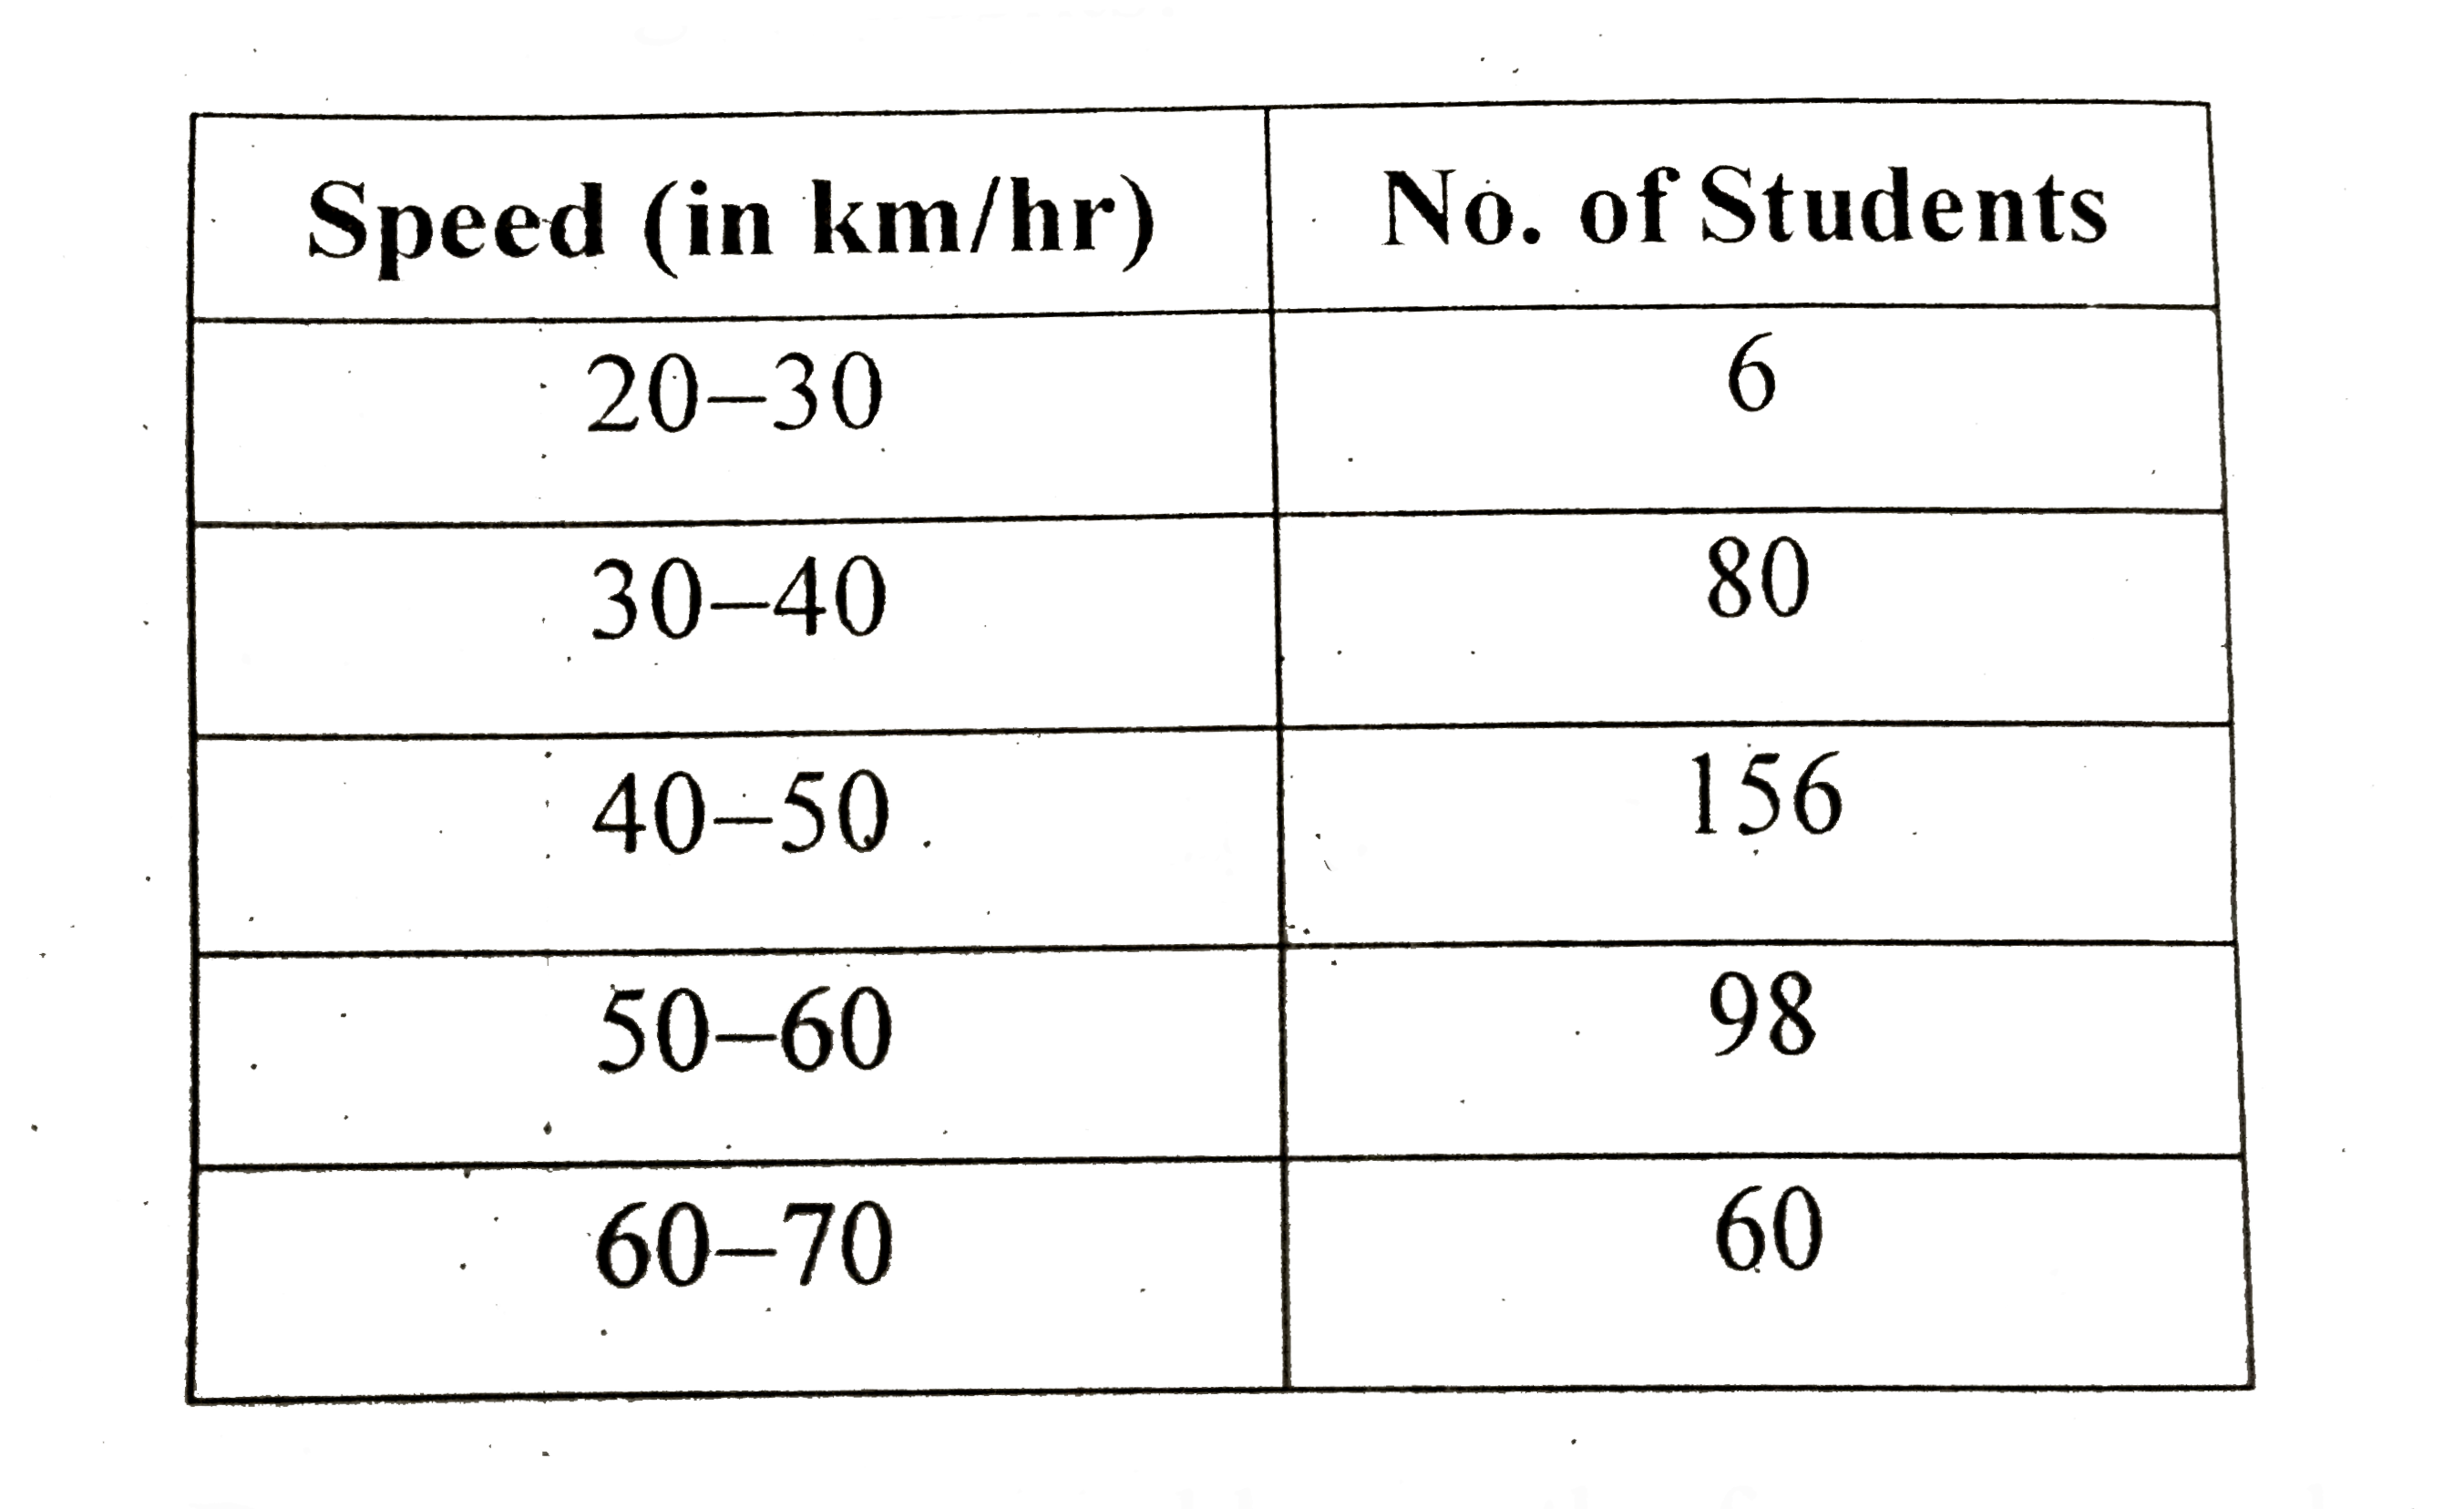
View SolutionGiven below is the frequency distribution of driving speeds (in km/hour) of the vehicles of 400 college students:

Draw Histogram and hence the frequency polygon for the above data.
View SolutionObserve the following data :

If the above data has mean = 50 , then missing frequencies f1andf2 are
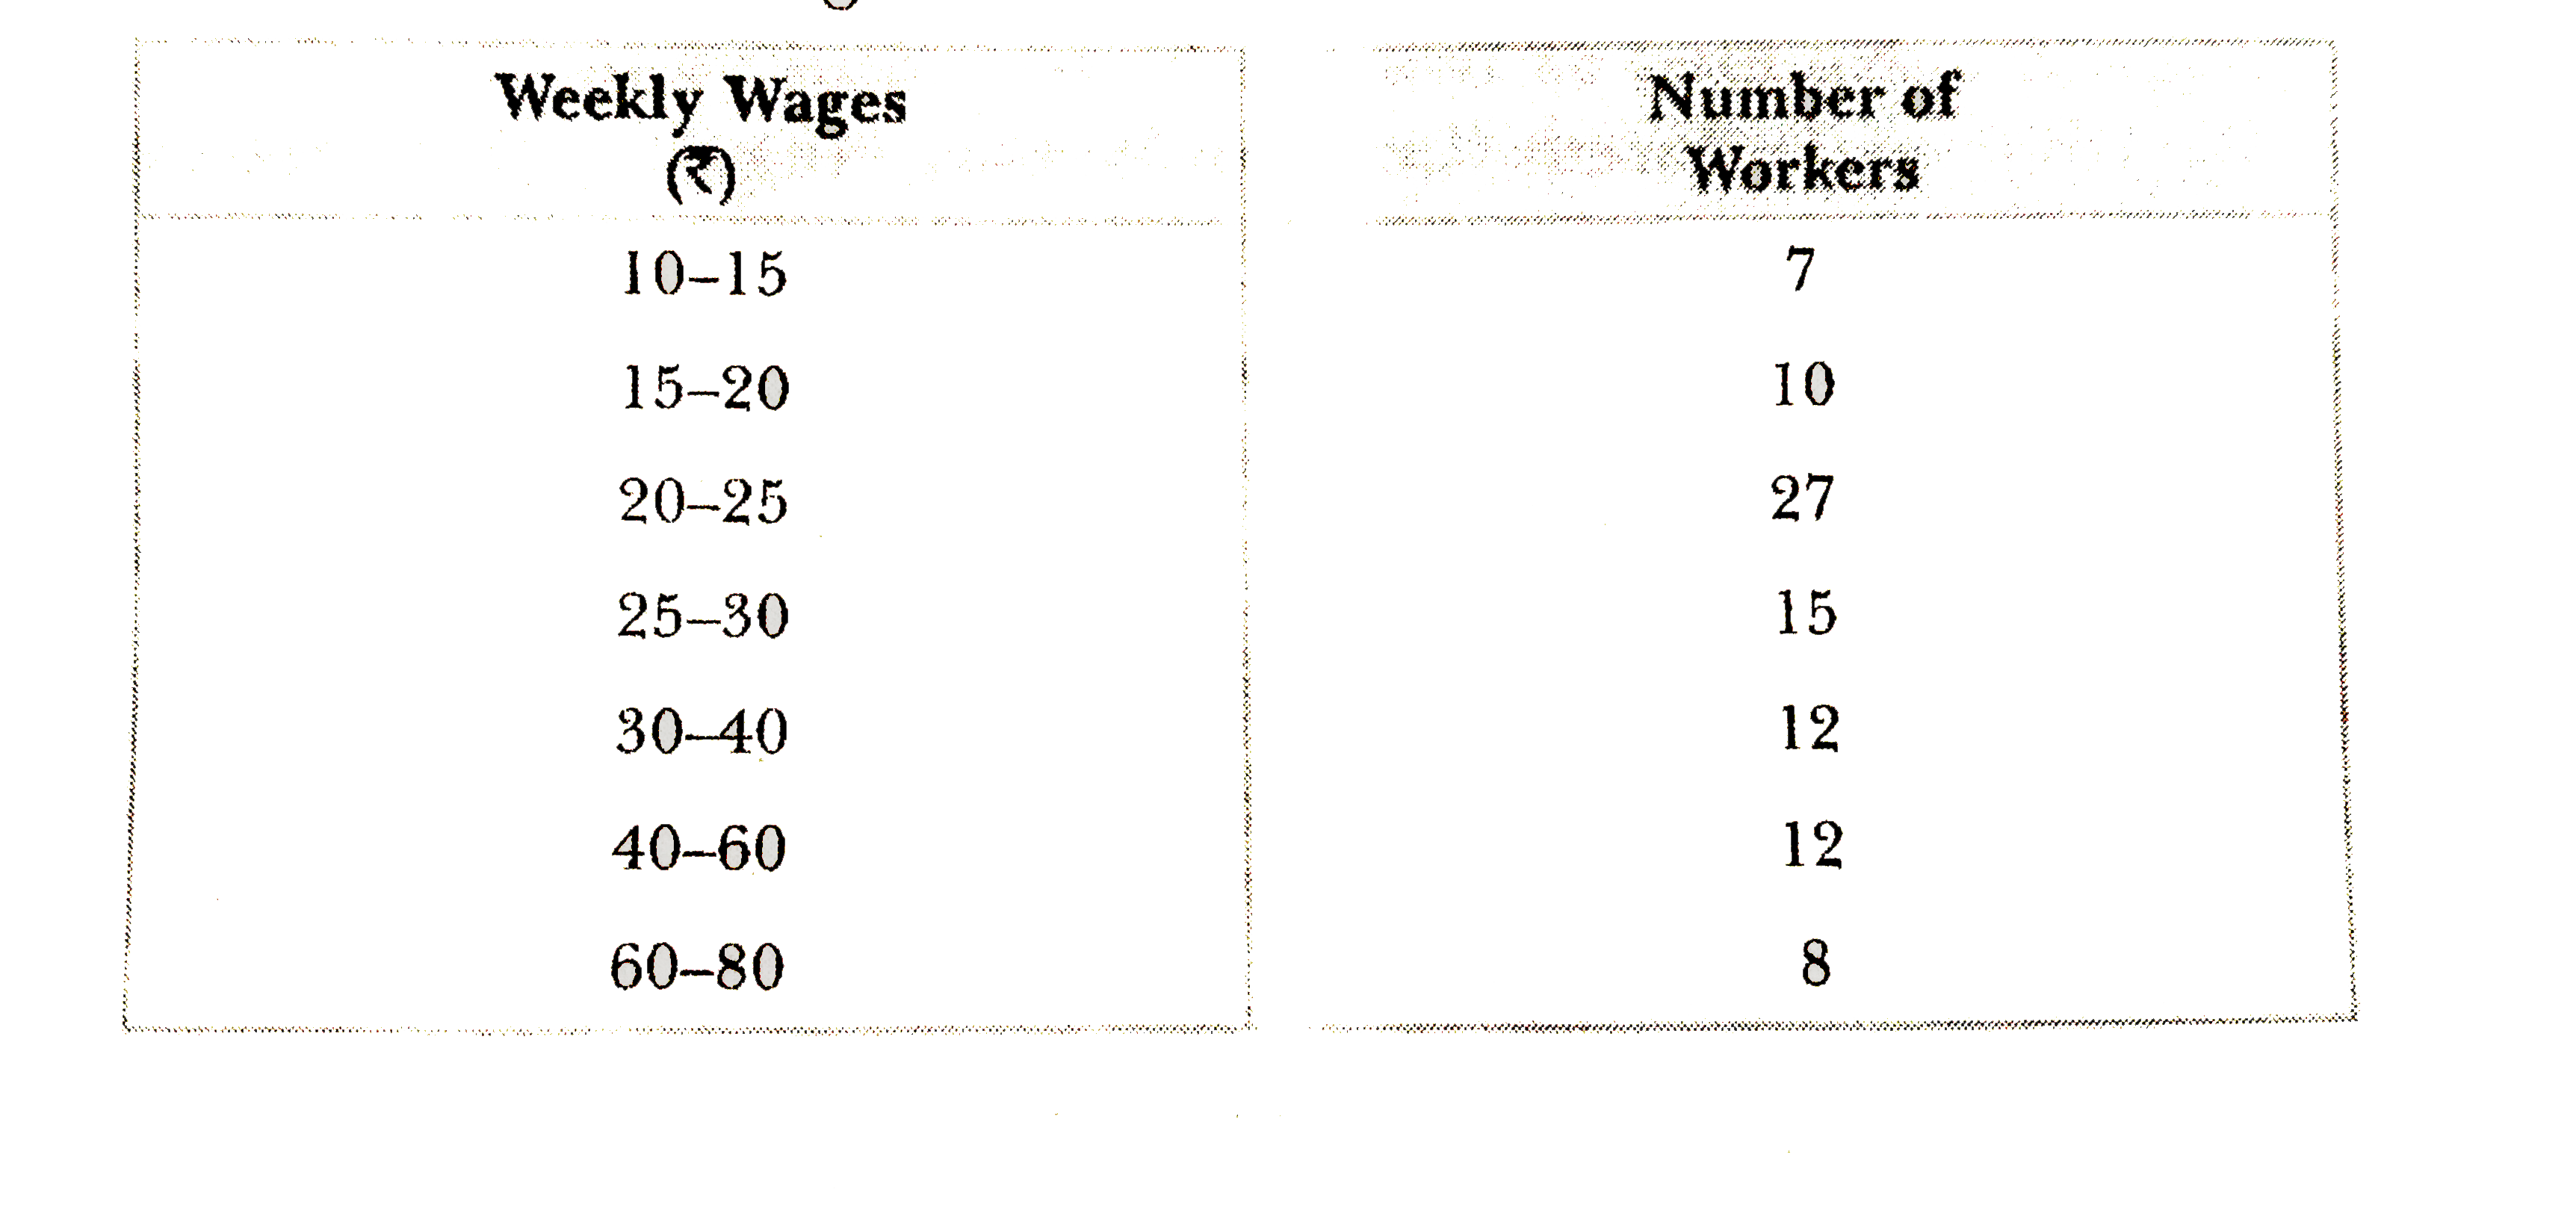
View SolutionPresent the following data in the form of a histogram :

View SolutionPresent the following data in the form of a histogram :

View Solution


