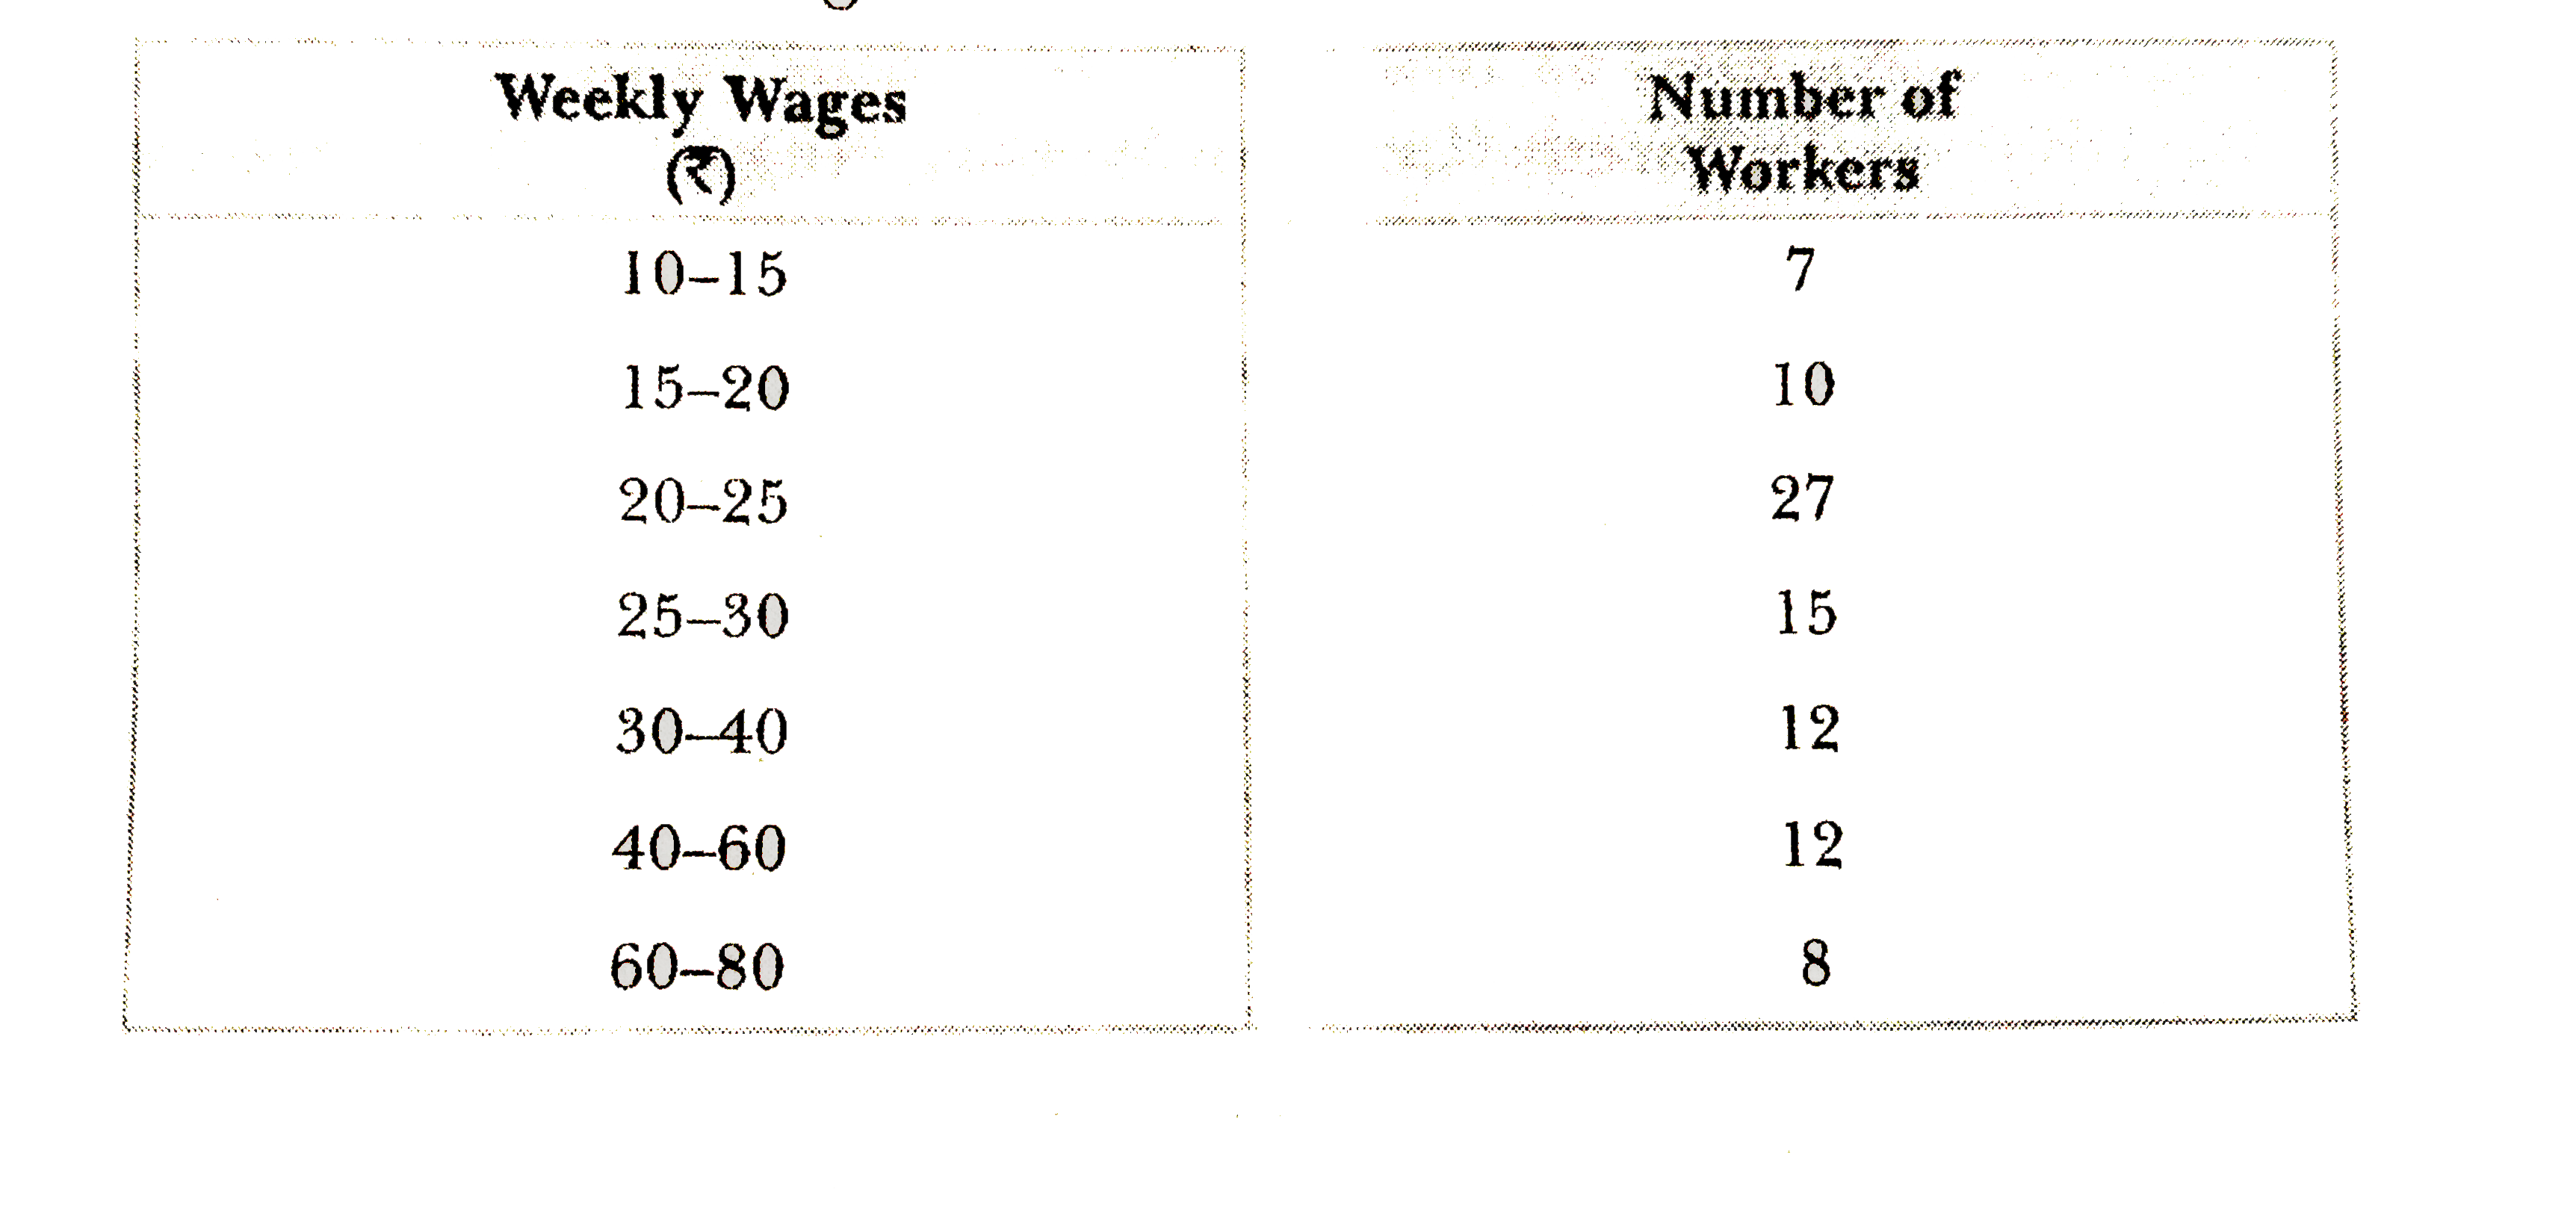
Present the following data in the form of a histogram :

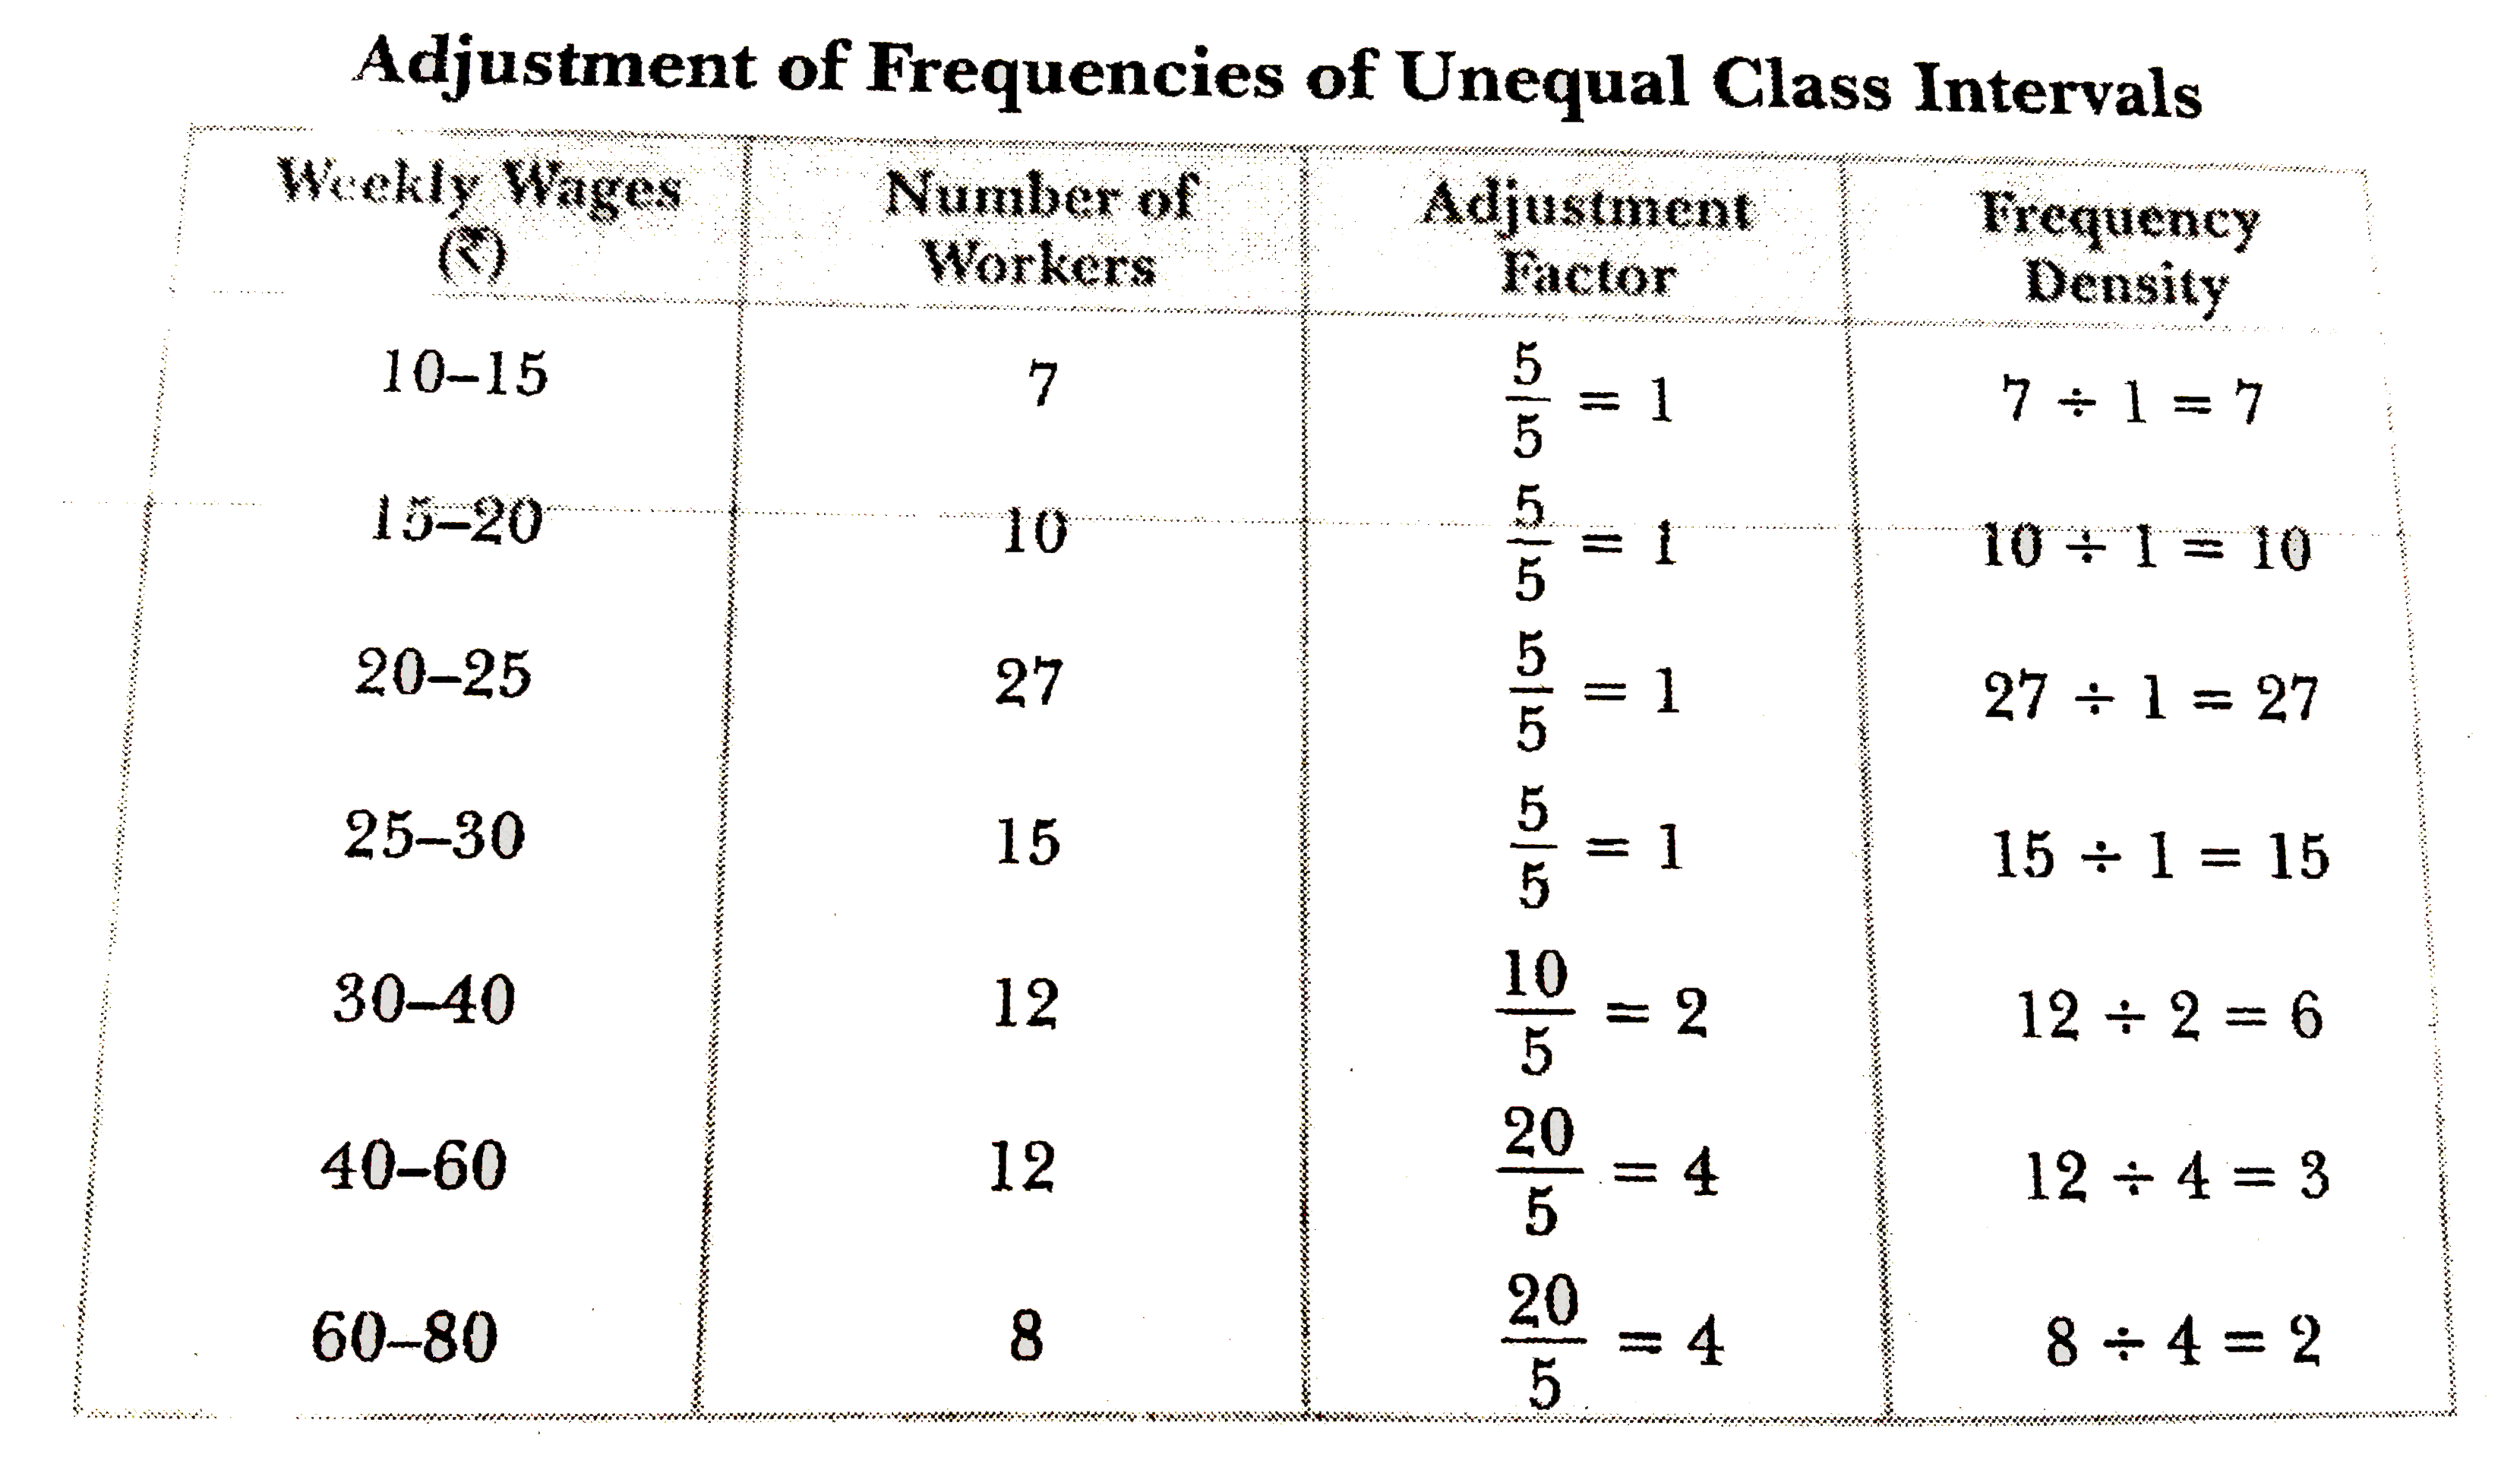
In the frequency distribution minimum class interval is 5. Other class interval are 10 and 20. Hence, before drawing the graph, frequency density should be calculated.It can be done by dividing frequencies by adjustment factor. The above table is adjusted as under :

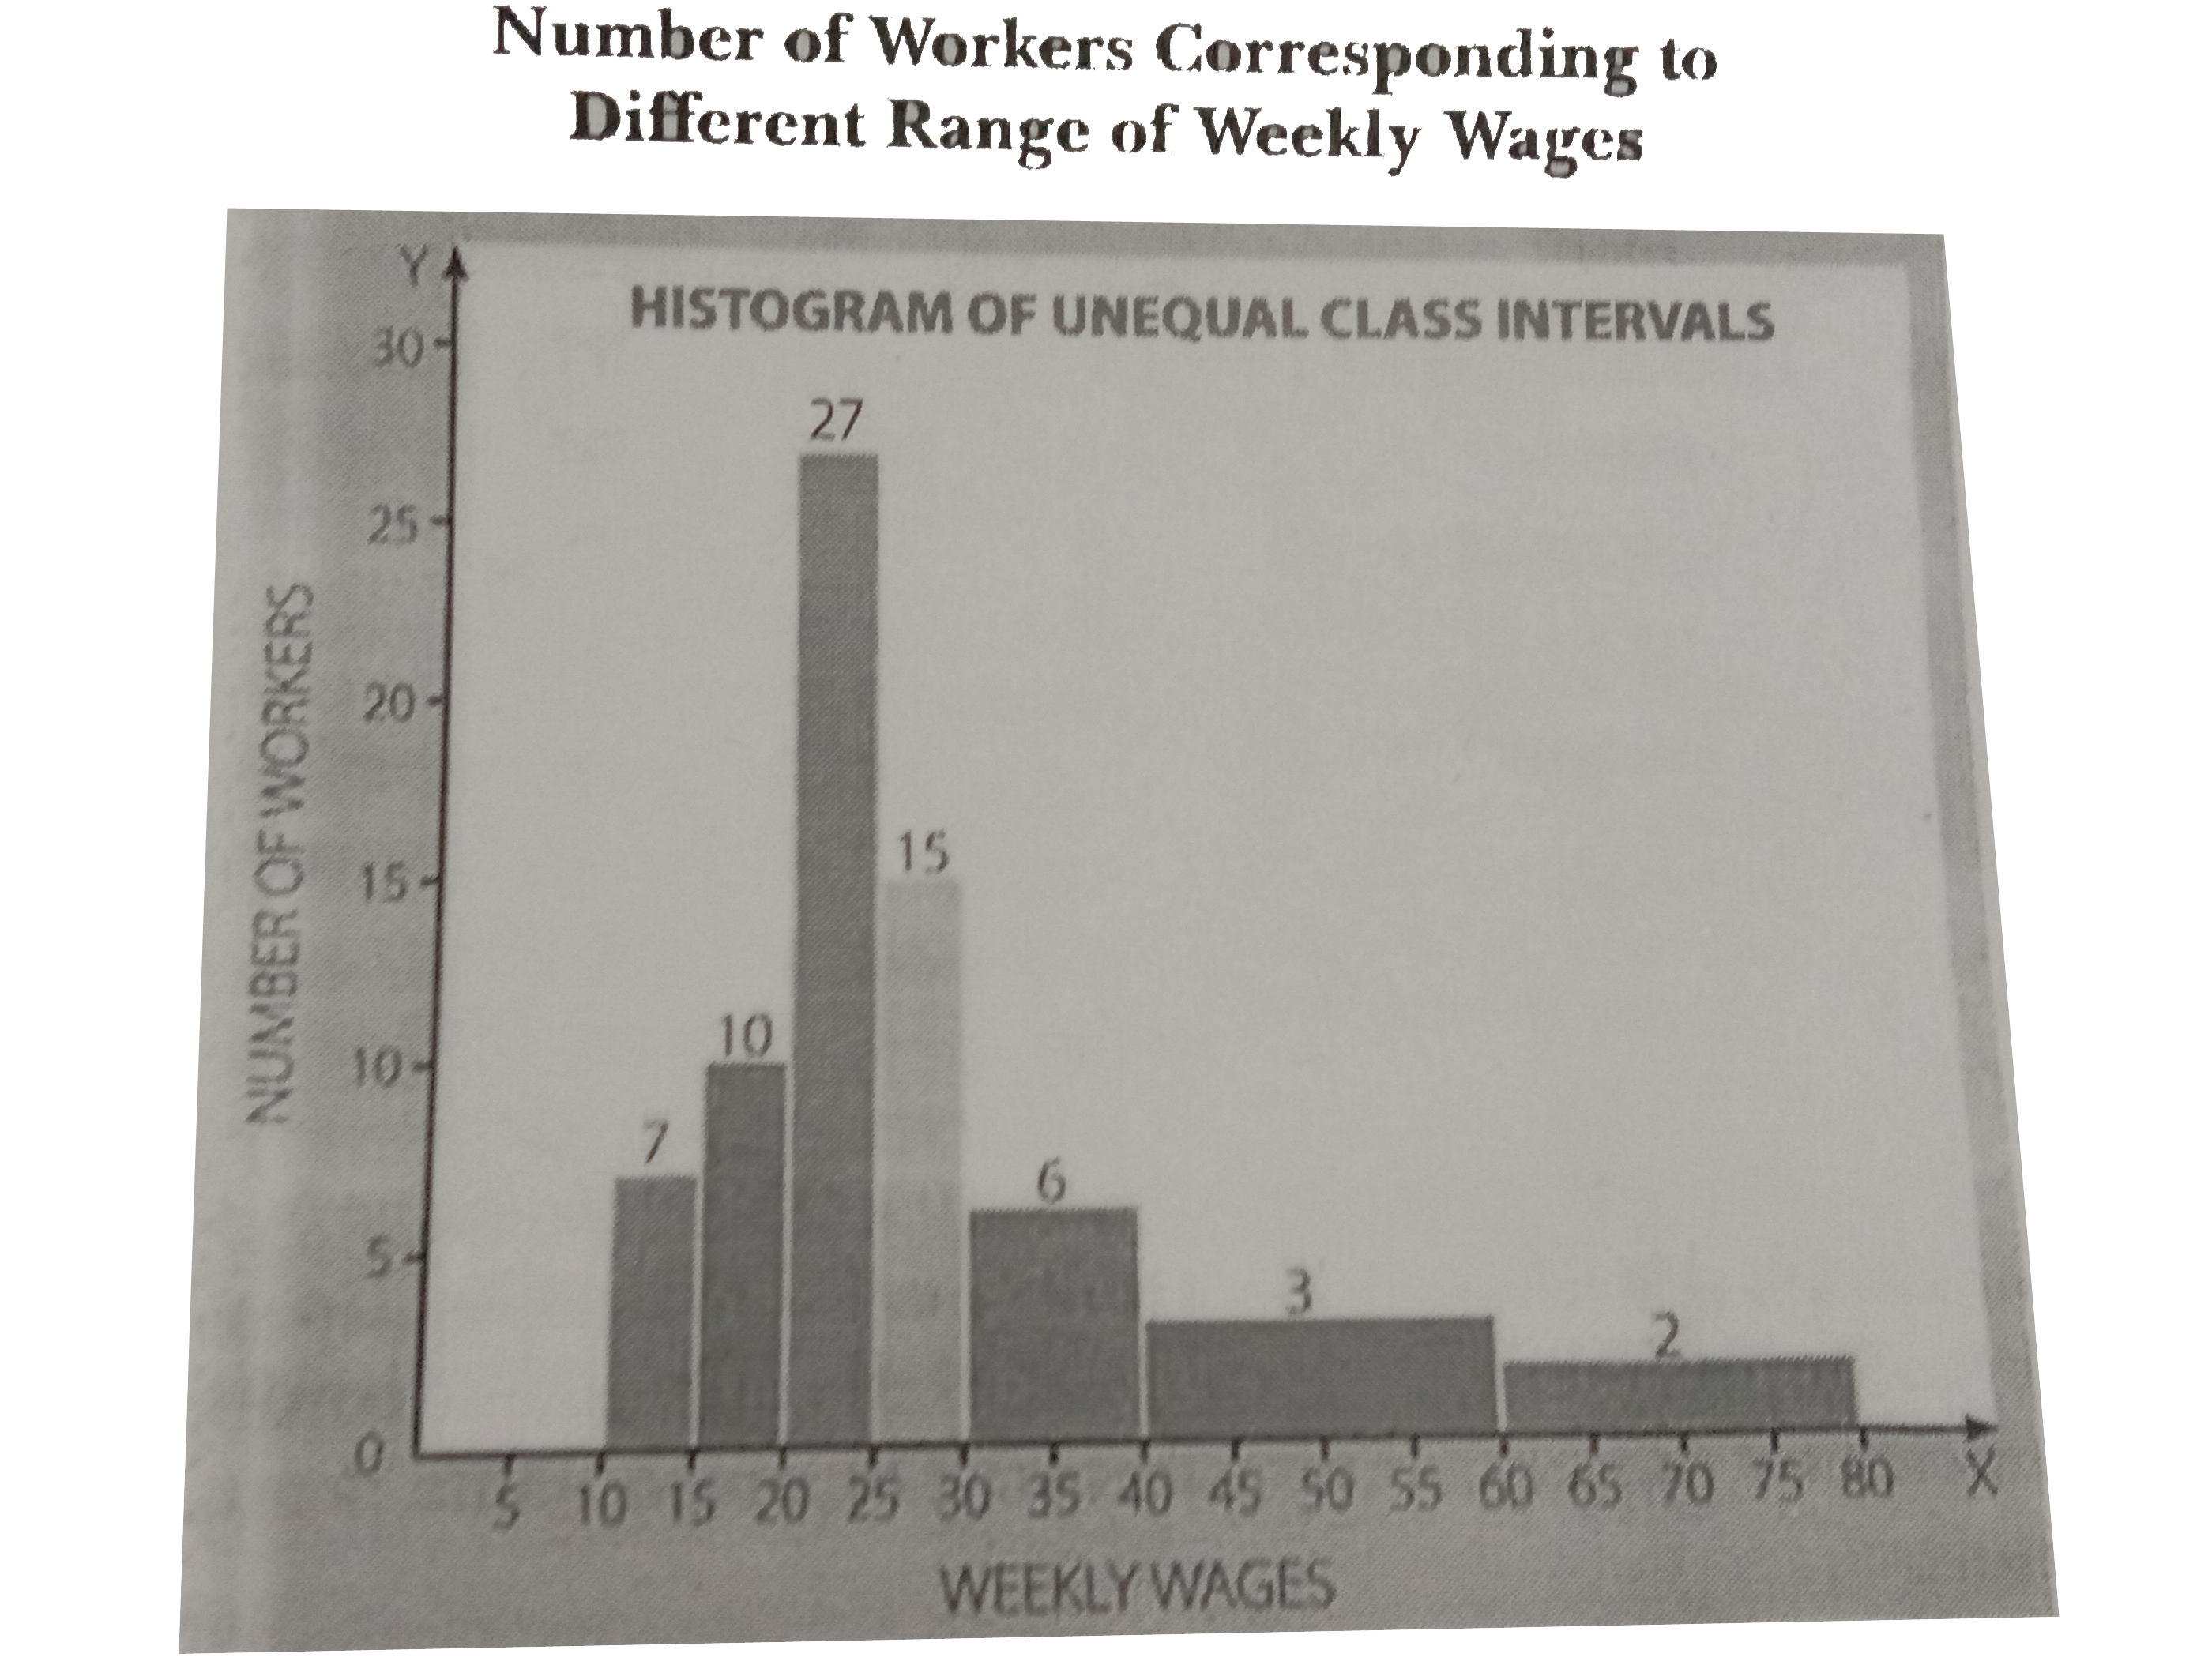
In the above table, the class interval for the first four classes is 5.Fifth class , however, is of the interval of 10 (40-30=10) which is twice as much as the class interval of the first four classes. Accordingly, frequency of the fifth class is divided by 2. Further, class interval of the 6th class is 20 (60-40=20) which is 4 times the minimum class interval of 5.Accordingly, frequency of this class is divided by 4.Likewise , the frequencies of other classes have been adjusted . It is based on this table that the histogram is drawn , as given below :

Topper's Solved these Questions
- BOOK - TARUN JAIN & VK OHRICHAPTER - FREQUENCY DIAGRAMS - HISTOGRAM, POLYGON AND OGIVEEXERCISE - Miscellaneous Illustration8videos
FREQUENCY DIAGRAMS - HISTOGRAM, POLYGON AND OGIVE
- BOOK - TARUN JAIN & VK OHRICHAPTER - FREQUENCY DIAGRAMS - HISTOGRAM, POLYGON AND OGIVEEXERCISE - EXERCISE M.C.Q6videos
FREQUENCY DIAGRAMS - HISTOGRAM, POLYGON AND OGIVE
- BOOK - TARUN JAIN & VK OHRICHAPTER - DIAGRAMMATIC PRESENTATION OF DATA BAR DIAGRAMS AND PIE DIAGRAMSEXERCISE - NCERT Question (With Hints to Answers)3videos
DIAGRAMMATIC PRESENTATION OF DATA BAR DIAGRAMS AND PIE DIAGRAMS
- BOOK - TARUN JAIN & VK OHRICHAPTER - INDEX NUMBERSEXERCISE - NCERT Questions (With Hints to Answers)12videos
INDEX NUMBERS
Similar Questions
Present the following data in the form of horizontal bar diagram :
 View Solution
Present the following data in the form of a multiple bar diagrm:
 View Solution
Present the following data in the form of a frequency polygon :
 View Solution
The table below shows number of students of students of a college corresponding to different range of marks in Statistics. Present the information in the form of a histogram.
 View Solution
The following table gives the marks scored by 100 students in an entrance examination

Represent this data in the form of a histogram.View SolutionRepresent the following data by histogram:
 View Solution
Present the following data on the production of food grains in the form of a sub divided bar diagrm:
 View Solution
Represent the following data using a histogram.
 View Solution
Estimate mode of the following data from the histogram :

From the graph, mode (M) = 34View SolutionFollowing data relate to the construction of a house in delhi .present the information in the form of a pie diagram:
 View Solution

