Reactant A is placed in a beaker, to which Reactant B will be added. Reactants A and B will not react unless B gets to a certain concentration. Once the reaction starts, both concentrations decreases until B has been consumed . Which of the following graphs showing concentration in moles as a function of time in seconds, represent the reaction?
The correct Answer is:B
To solve the problem, we need to analyze the behavior of the concentrations of reactants A and B over time as described in the question. Here’s a step-by-step breakdown of the solution:
Step 1: Understand the Reaction Dynamics
- Reactant A is present in a beaker.
- Reactant B is added but will not react until it reaches a certain concentration.
- Once the reaction starts, both concentrations will decrease until B is completely consumed.
Hint for Step 1: Focus on the conditions under which the reaction begins and how the concentrations change over time.
Step 2: Analyze the Graphs
- We need to look for graphs that show the behavior of the concentrations of A and B over time.
- Initially, the concentration of B must increase until it reaches the threshold for the reaction to start.
Hint for Step 2: Check for graphs where the concentration of B increases before any decrease occurs.
Step 3: Eliminate Incorrect Options
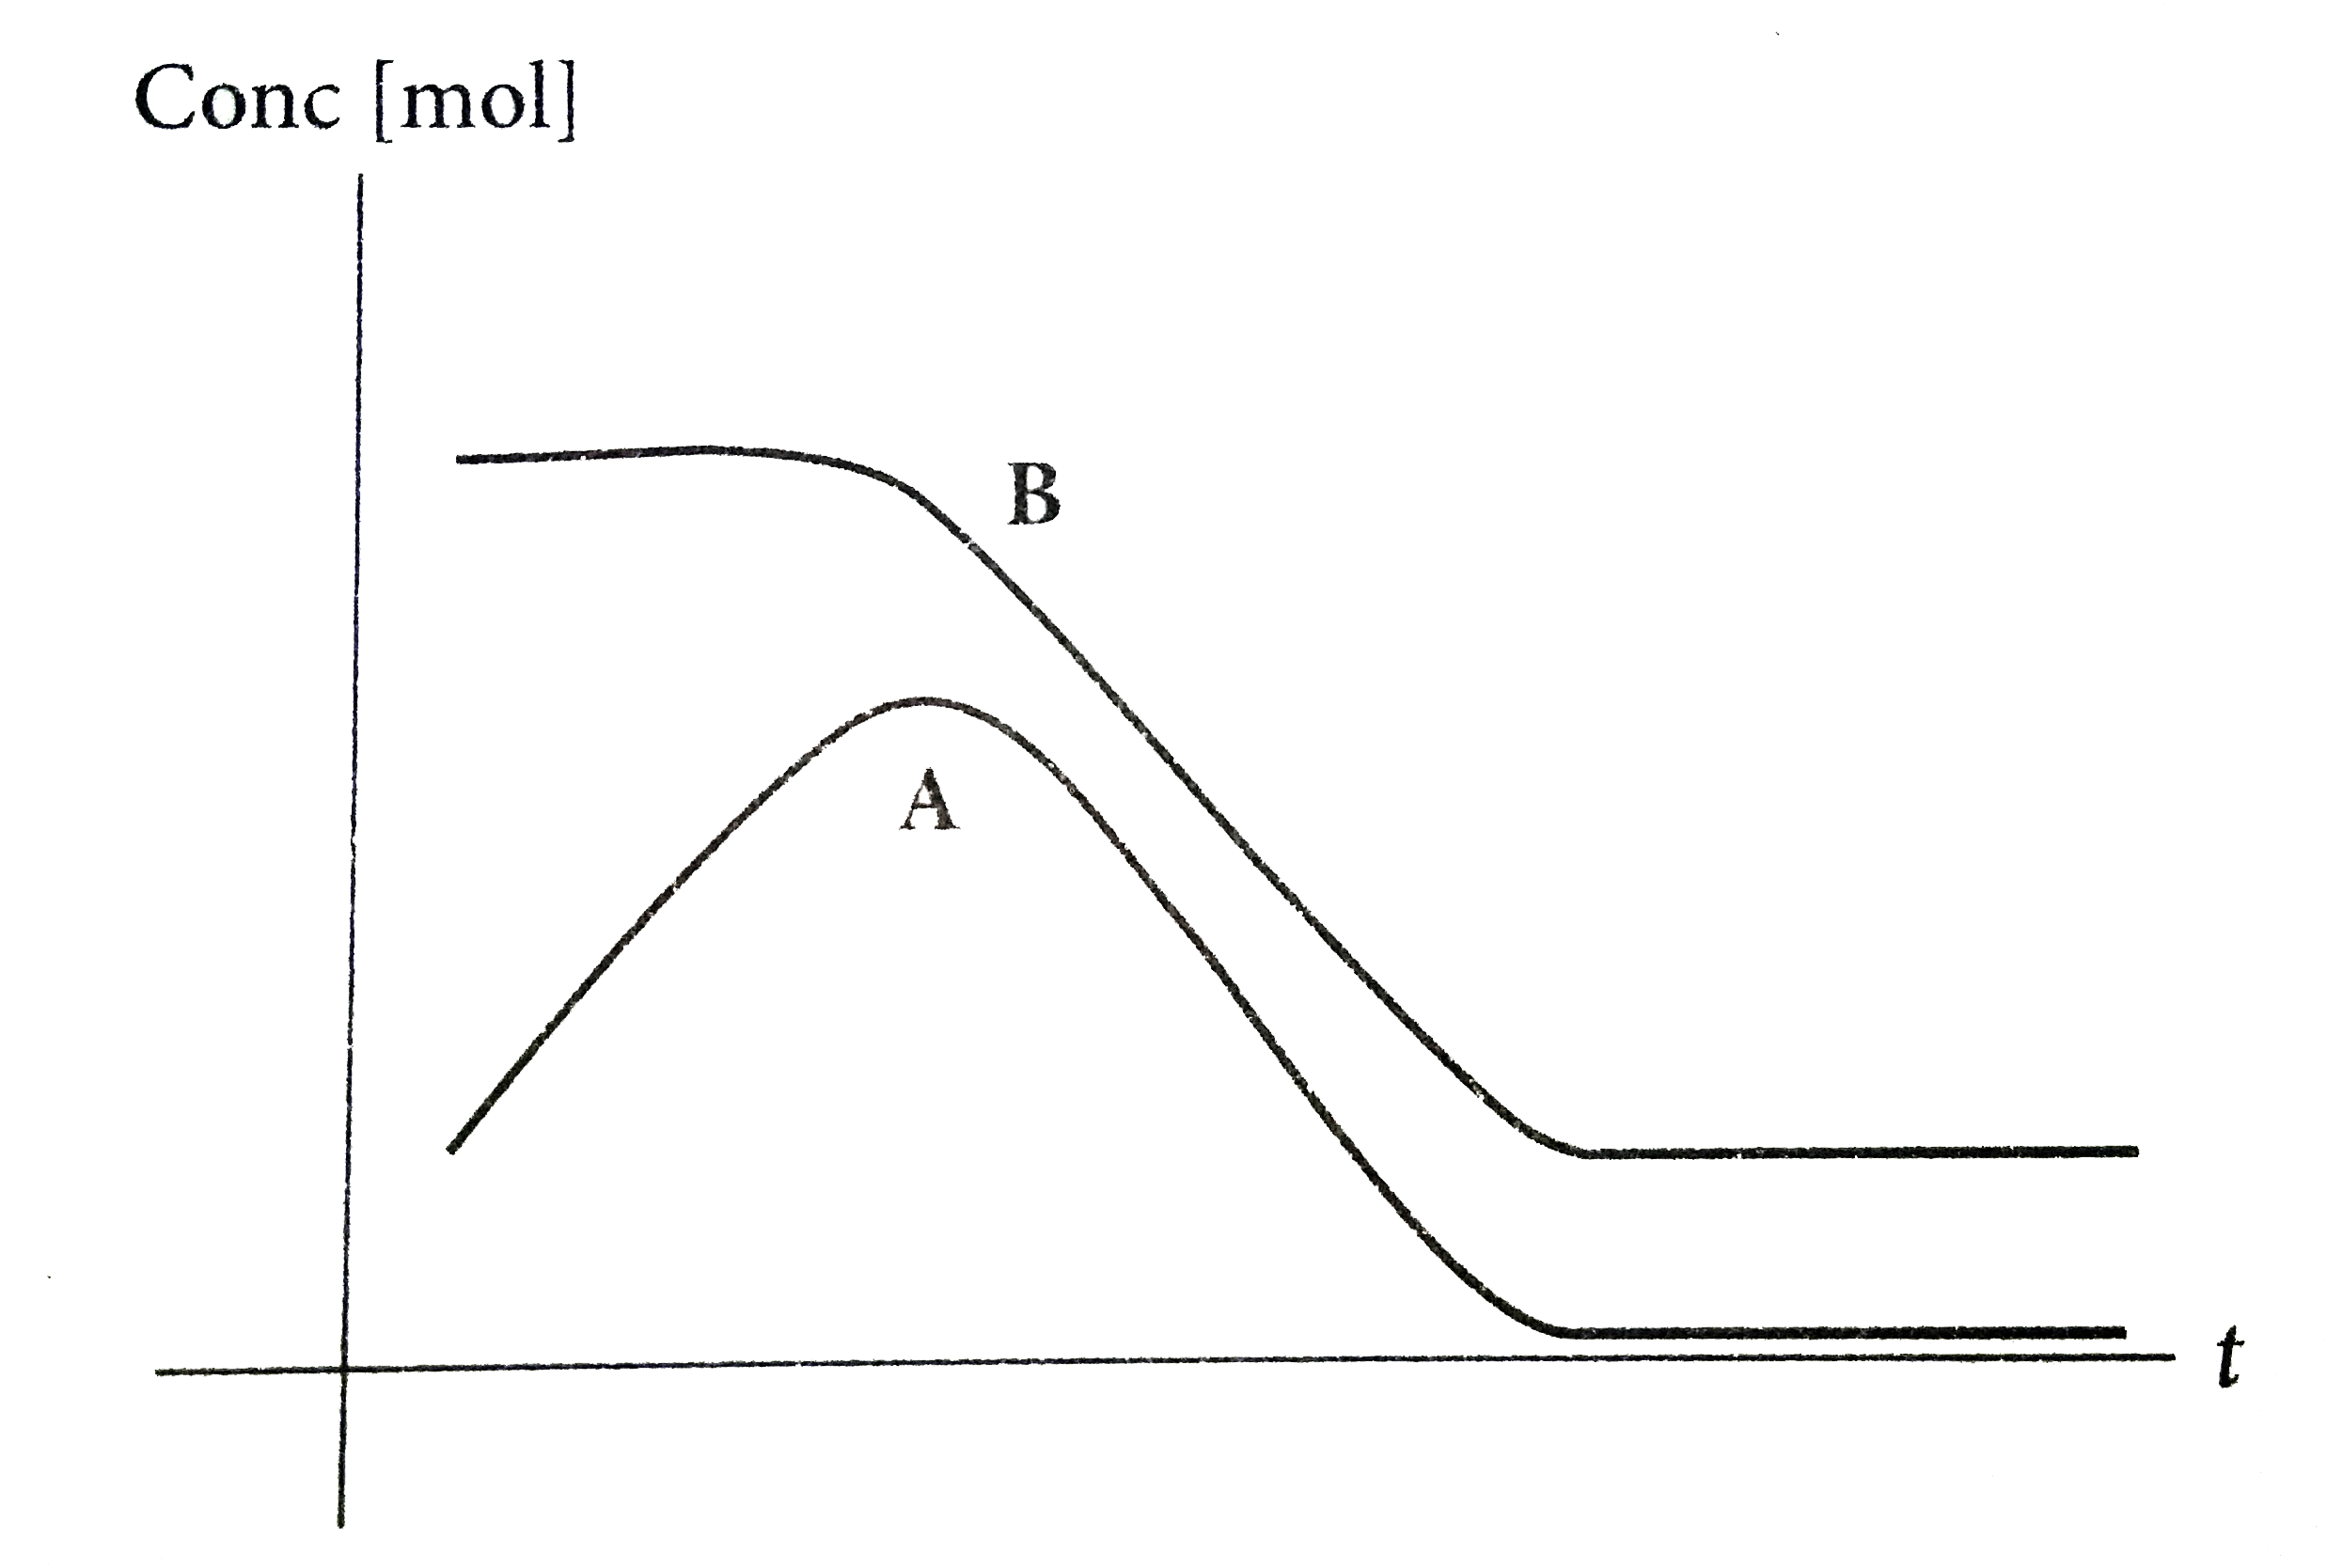
- Graph A: Shows B as constant initially, which does not match the requirement that B must increase to start the reaction. (Eliminate A)
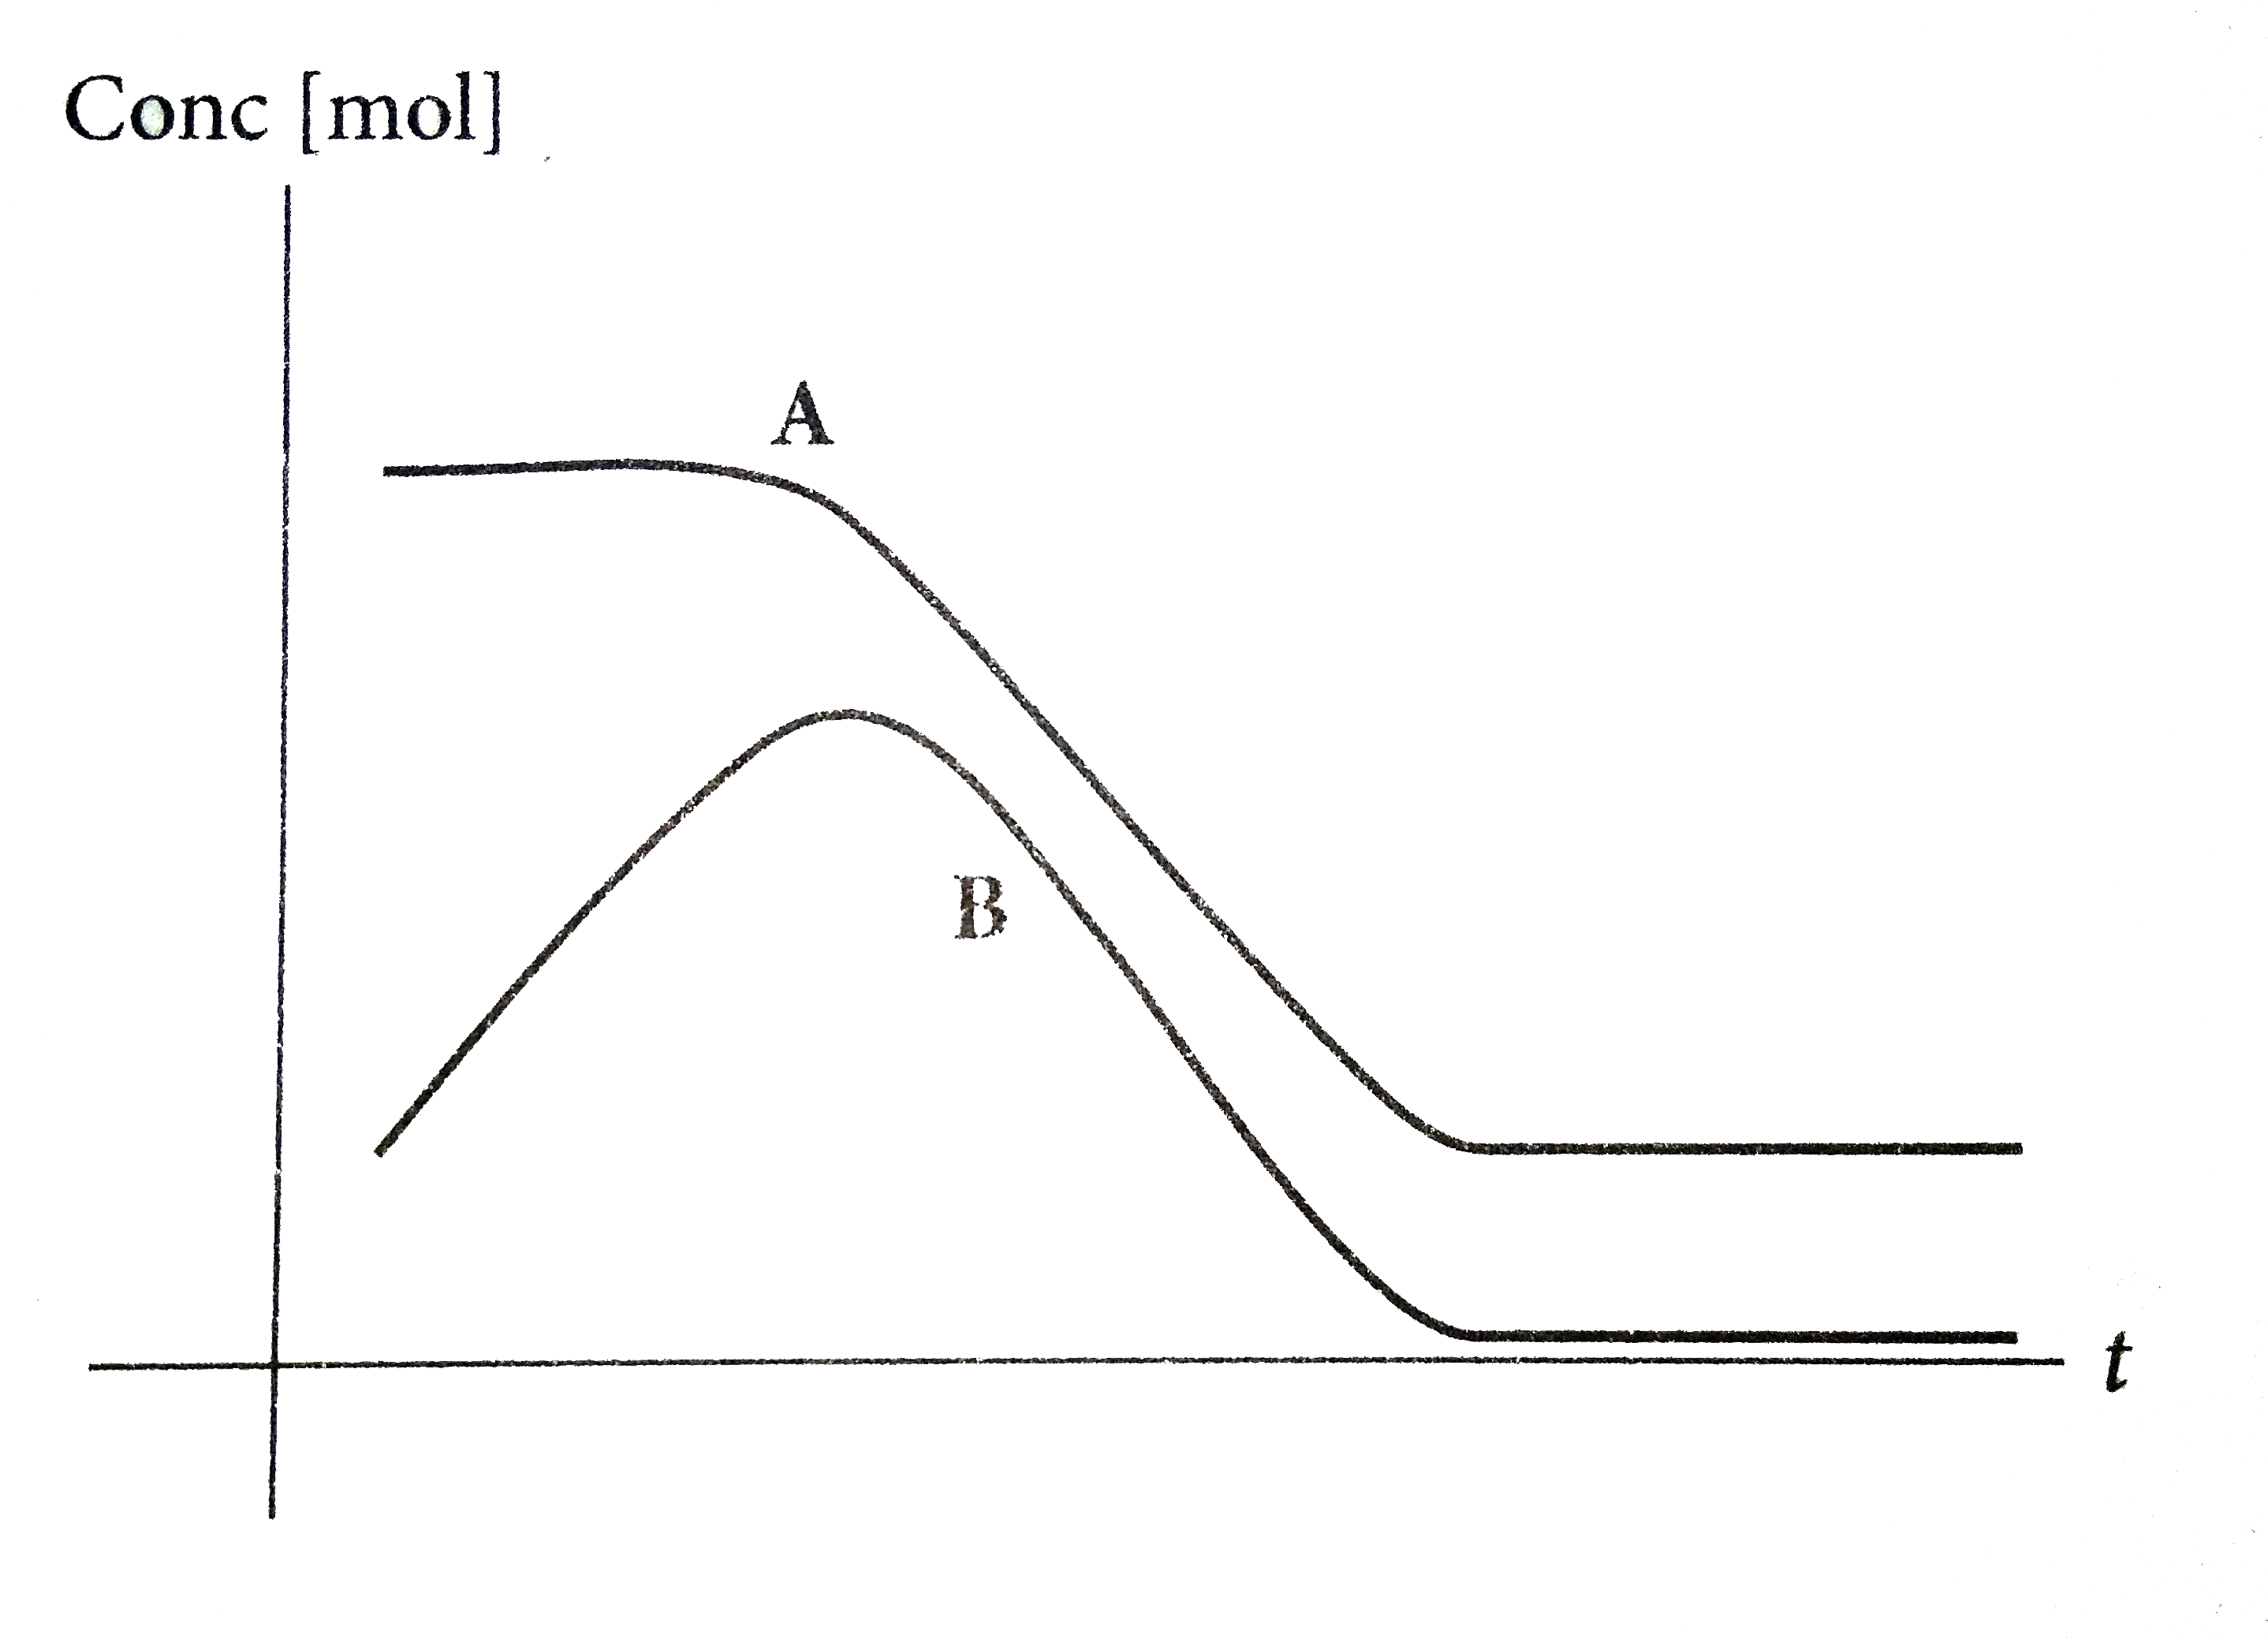
- Graph B: Shows B increasing to a certain point and then decreasing, which is consistent with the reaction dynamics.
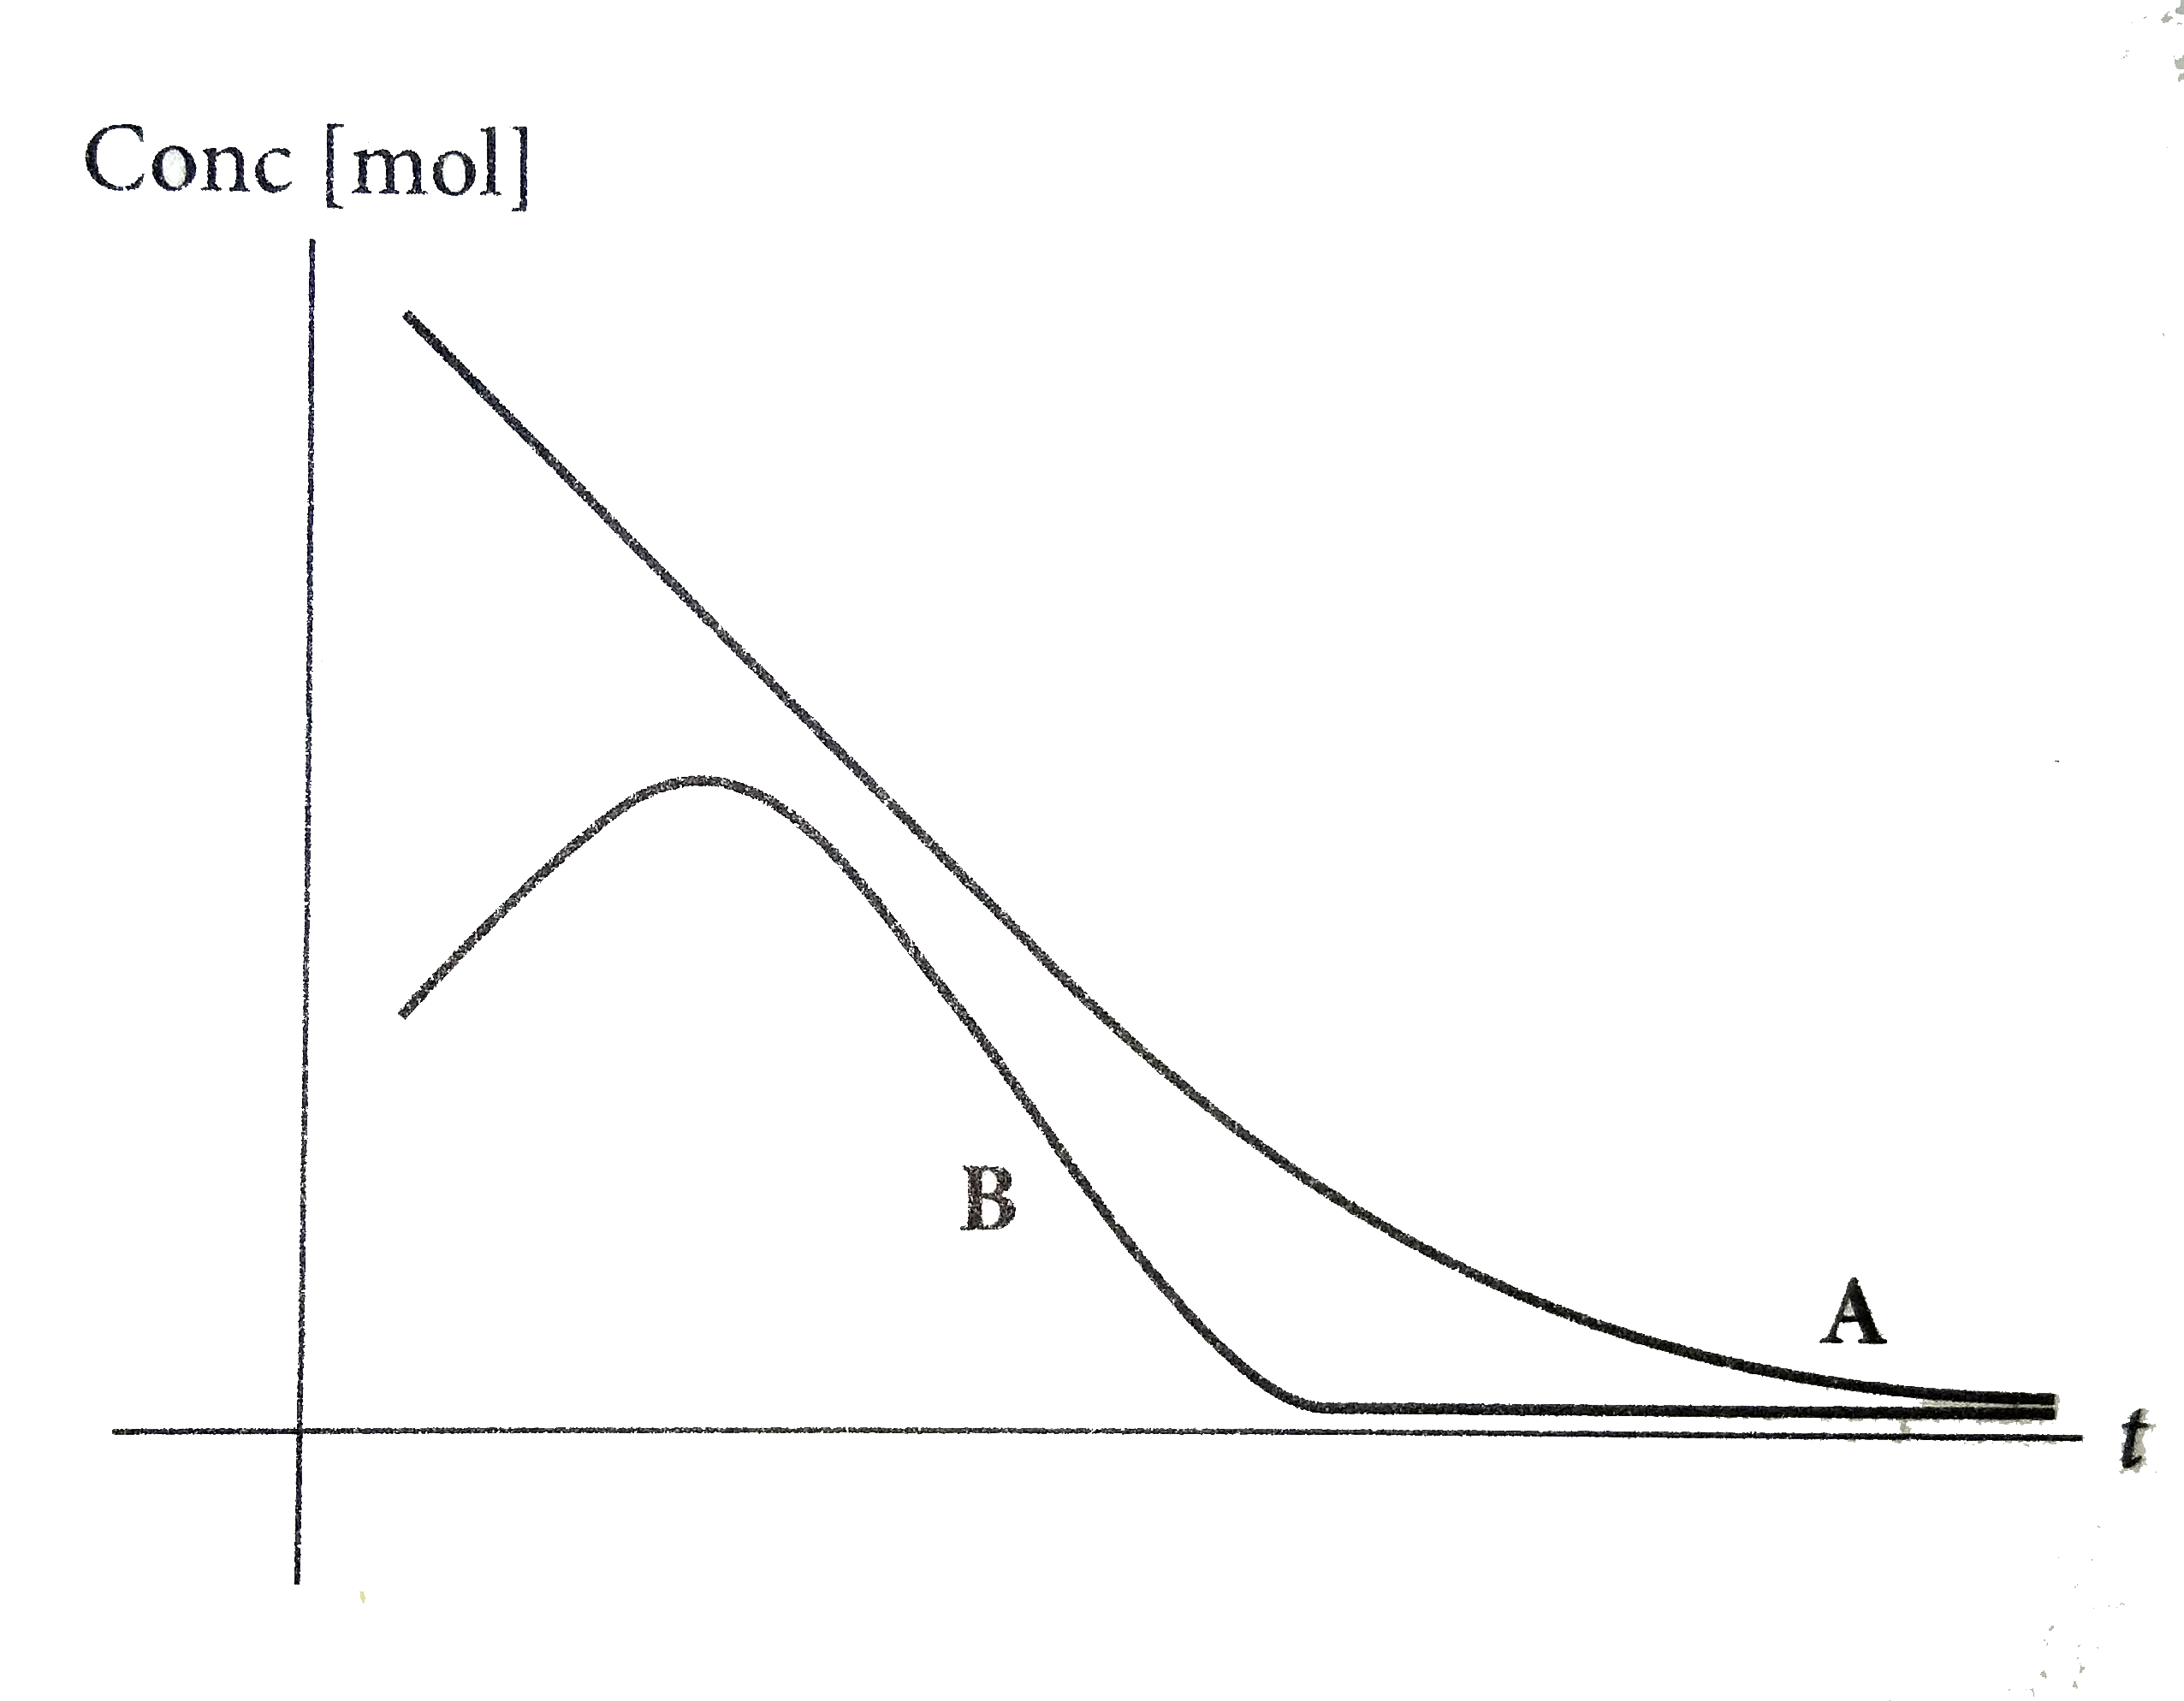
- Graph C: Also shows B increasing and then decreasing, which is a potential candidate.
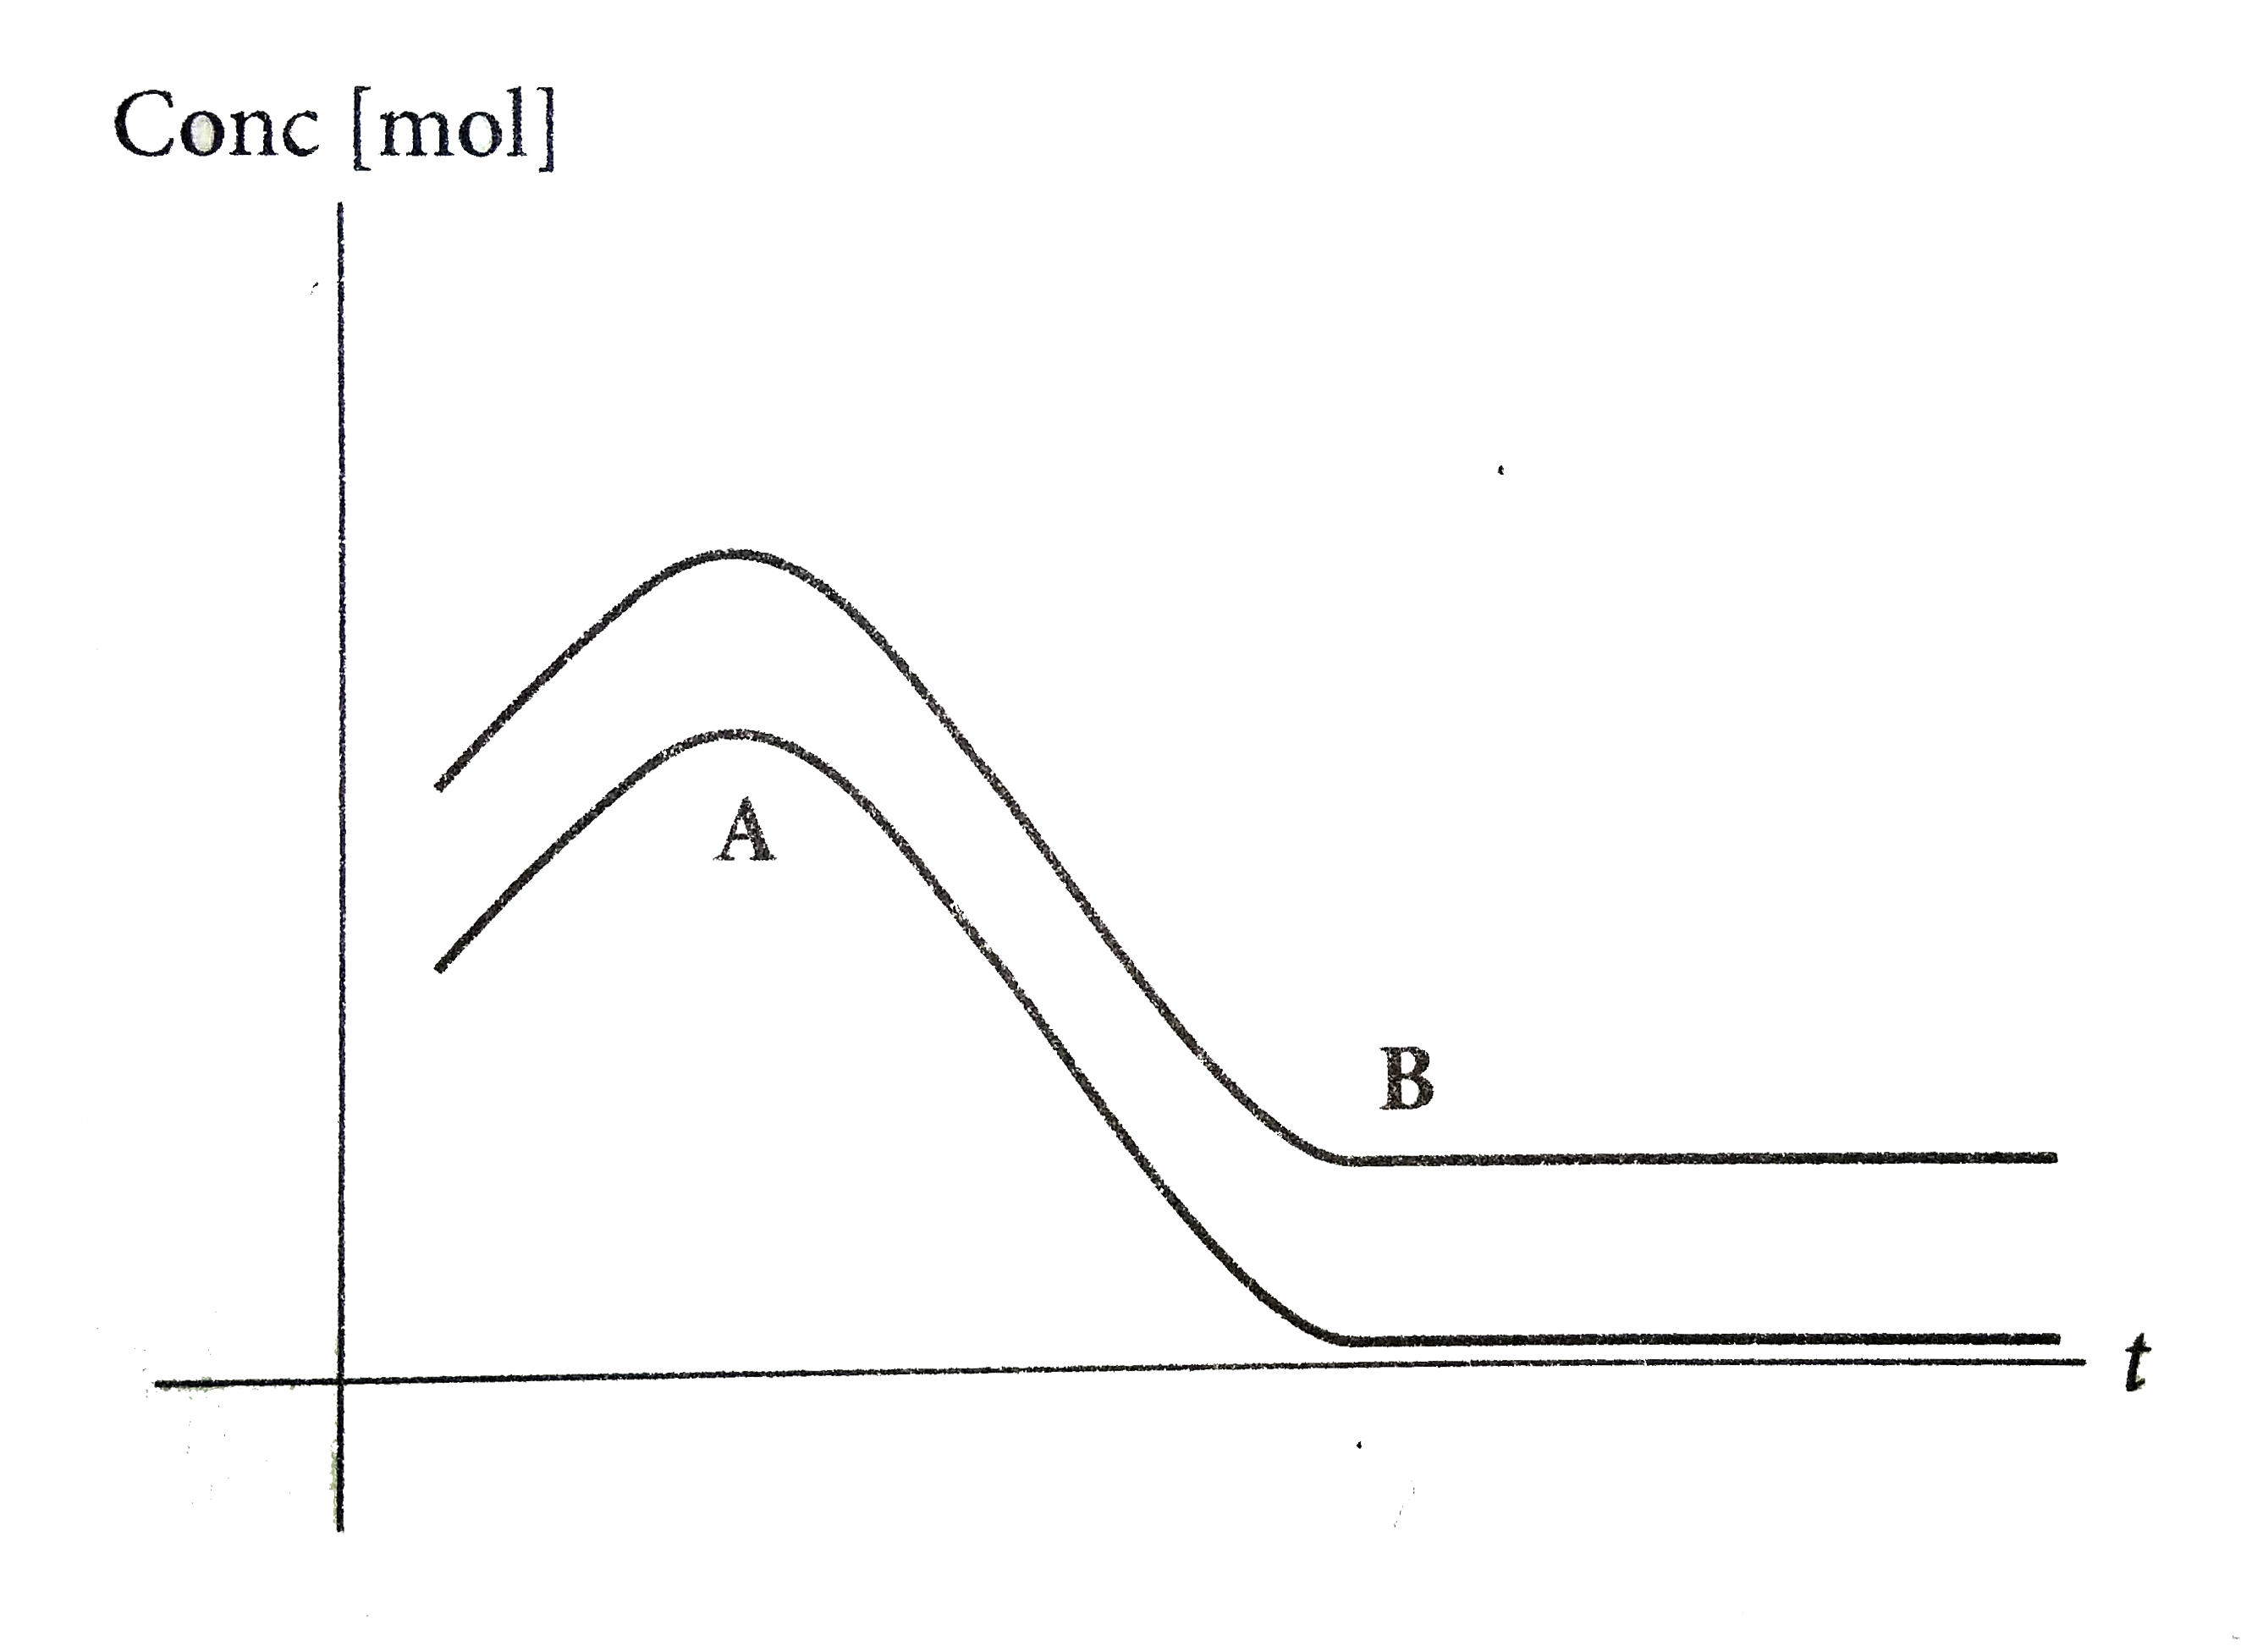
- Graph D: Shows B increasing and then leveling off at a value greater than zero, which means B is not fully consumed. (Eliminate D)
Hint for Step 3: Look for graphs that show B reaching zero after the reaction.
Step 4: Check for Complete Consumption of B
- After the reaction starts, B must be completely consumed, meaning its concentration should reach zero.
- Graph B: B reaches zero, which is consistent with the requirement.
- Graph C: Also shows B reaching zero.
Hint for Step 4: Ensure that the graph shows B decreasing to zero, indicating complete consumption.
Step 5: Consider the Behavior of Reactant A
- Reactant A is constant in volume and concentration until the reaction starts. Therefore, its concentration should not decrease until the reaction begins.
- Graph B: Shows A remaining constant until the reaction starts, which is correct.
- Graph C: Shows A decreasing from the beginning, which is not consistent with the problem statement. (Eliminate C)
Conclusion
Based on the analysis, the correct graph that represents the reaction dynamics of reactants A and B is Graph B.
Final Answer: Graph B is the correct representation of the reaction.
- Reactant A is present in a beaker.
- Reactant B is added but will not react until it reaches a certain concentration.
- Once the reaction starts, both concentrations will decrease until B is completely consumed.
- We need to look for graphs that show the behavior of the concentrations of A and B over time.
- Initially, the concentration of B must increase until it reaches the threshold for the reaction to start.
- Graph A: Shows B as constant initially, which does not match the requirement that B must increase to start the reaction. (Eliminate A)
- Graph B: Shows B increasing to a certain point and then decreasing, which is consistent with the reaction dynamics.
- Graph C: Also shows B increasing and then decreasing, which is a potential candidate.
- Graph D: Shows B increasing and then leveling off at a value greater than zero, which means B is not fully consumed. (Eliminate D)
- After the reaction starts, B must be completely consumed, meaning its concentration should reach zero.
- Graph B: B reaches zero, which is consistent with the requirement.
- Graph C: Also shows B reaching zero.
- Reactant A is constant in volume and concentration until the reaction starts. Therefore, its concentration should not decrease until the reaction begins.
- Graph B: Shows A remaining constant until the reaction starts, which is correct.
- Graph C: Shows A decreasing from the beginning, which is not consistent with the problem statement. (Eliminate C)
Based on the analysis, the correct graph that represents the reaction dynamics of reactants A and B is Graph B.
Topper's Solved these Questions
Similar Questions
Knowledge Check
Consider the reaction A→B. The concentration of both the reactants and the products varies exponentially with time. Which of the following figure correctly describes the change in concentration of reactants and products with time ?
A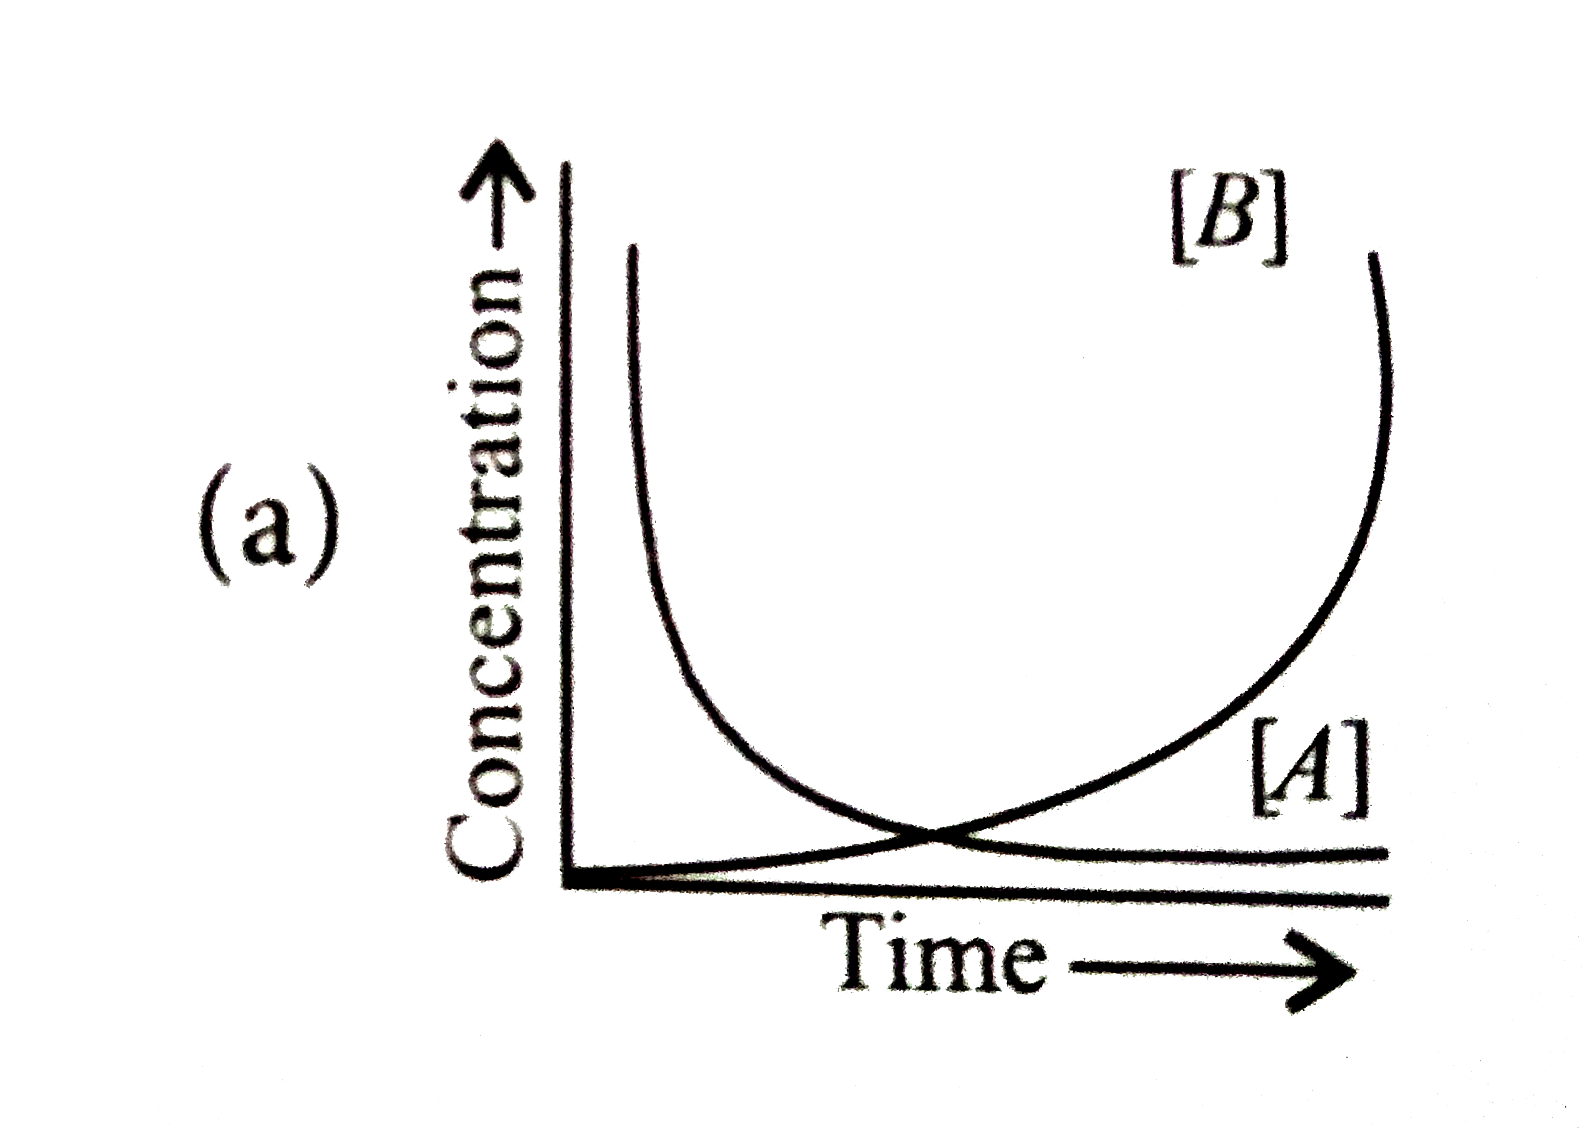 B
B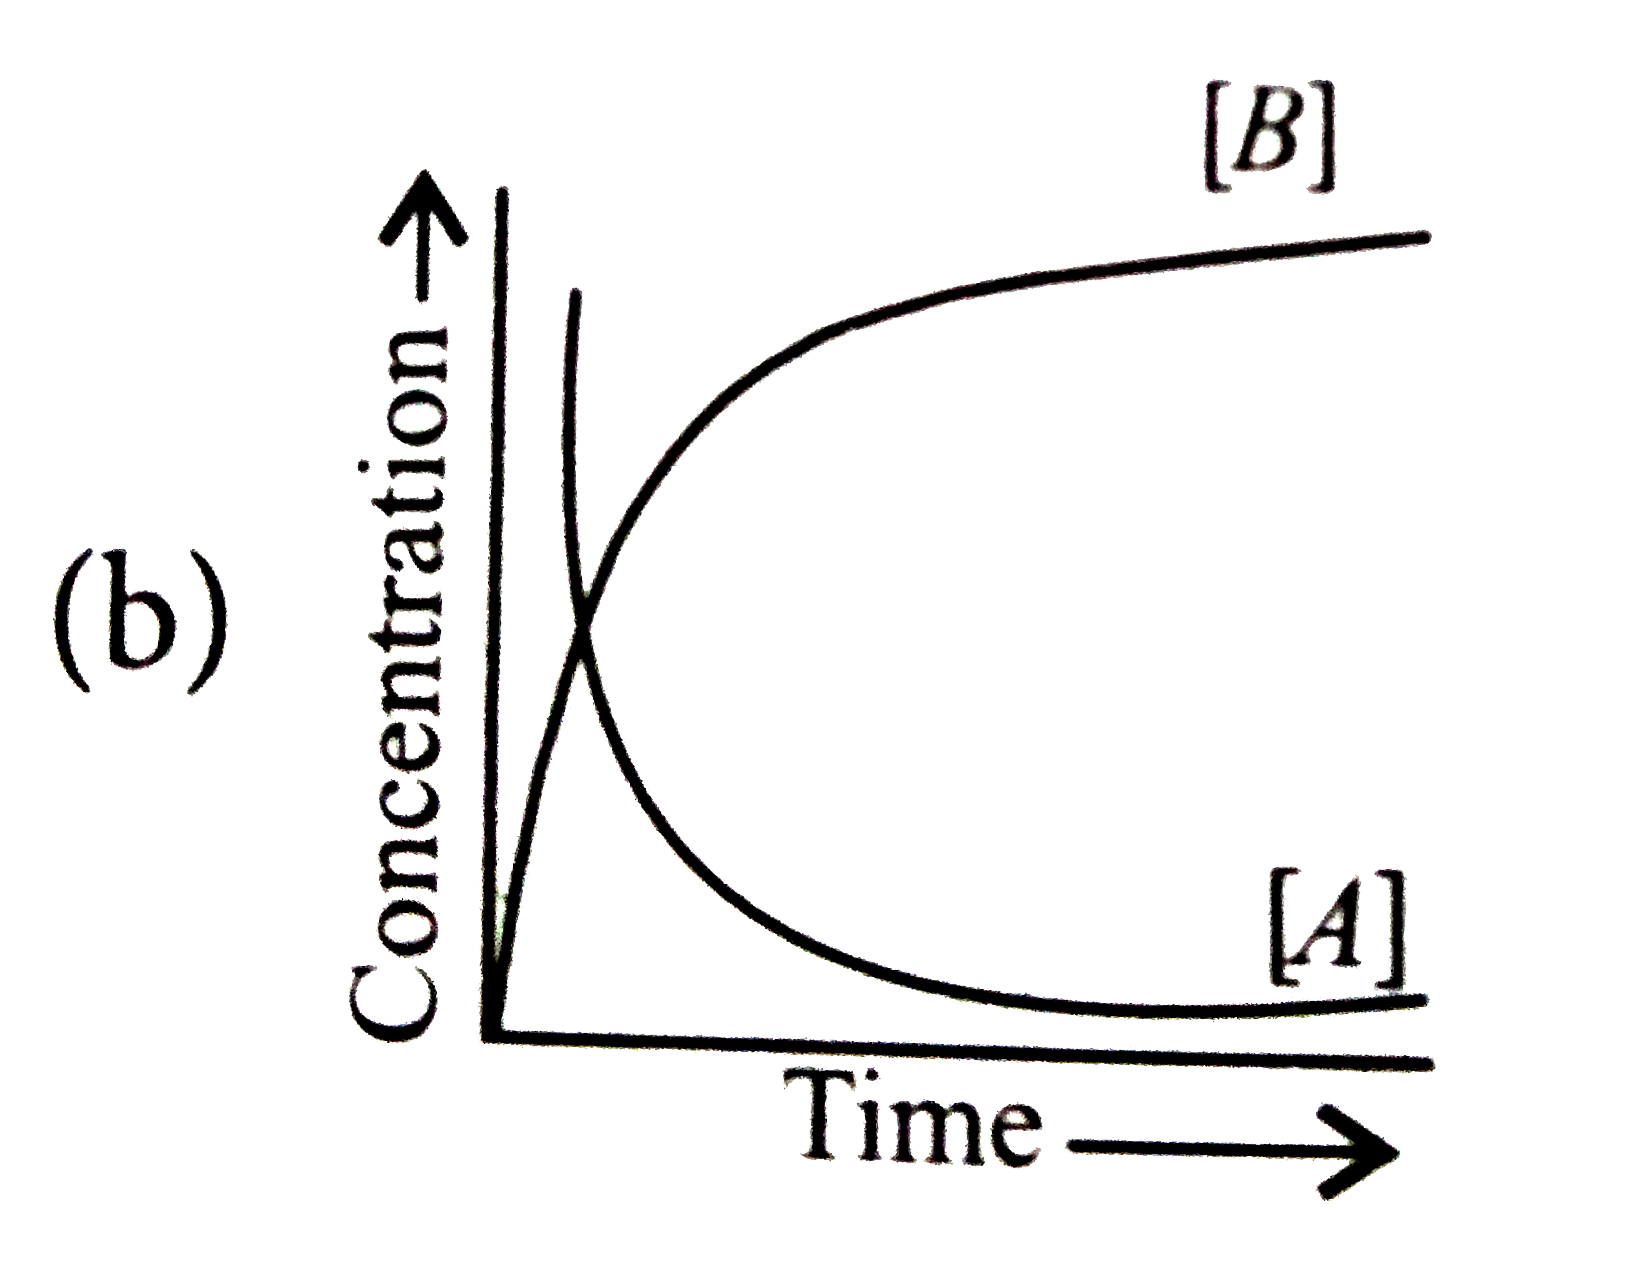 C
C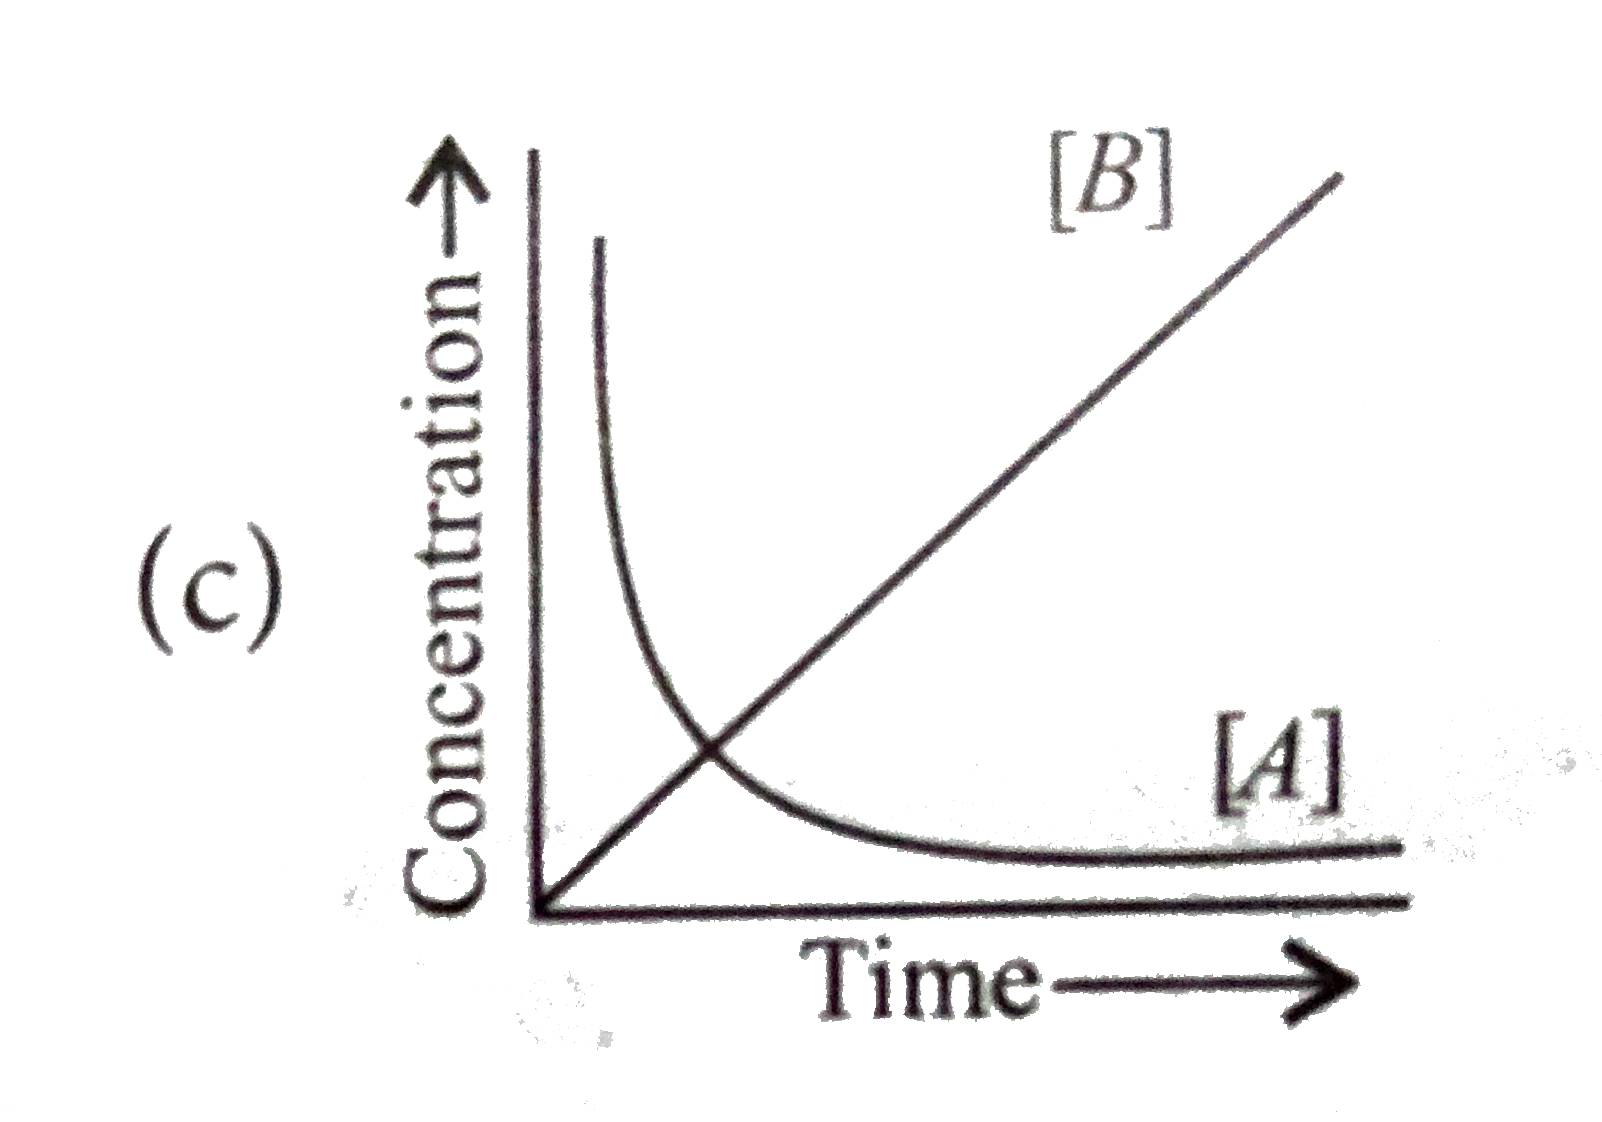 D
D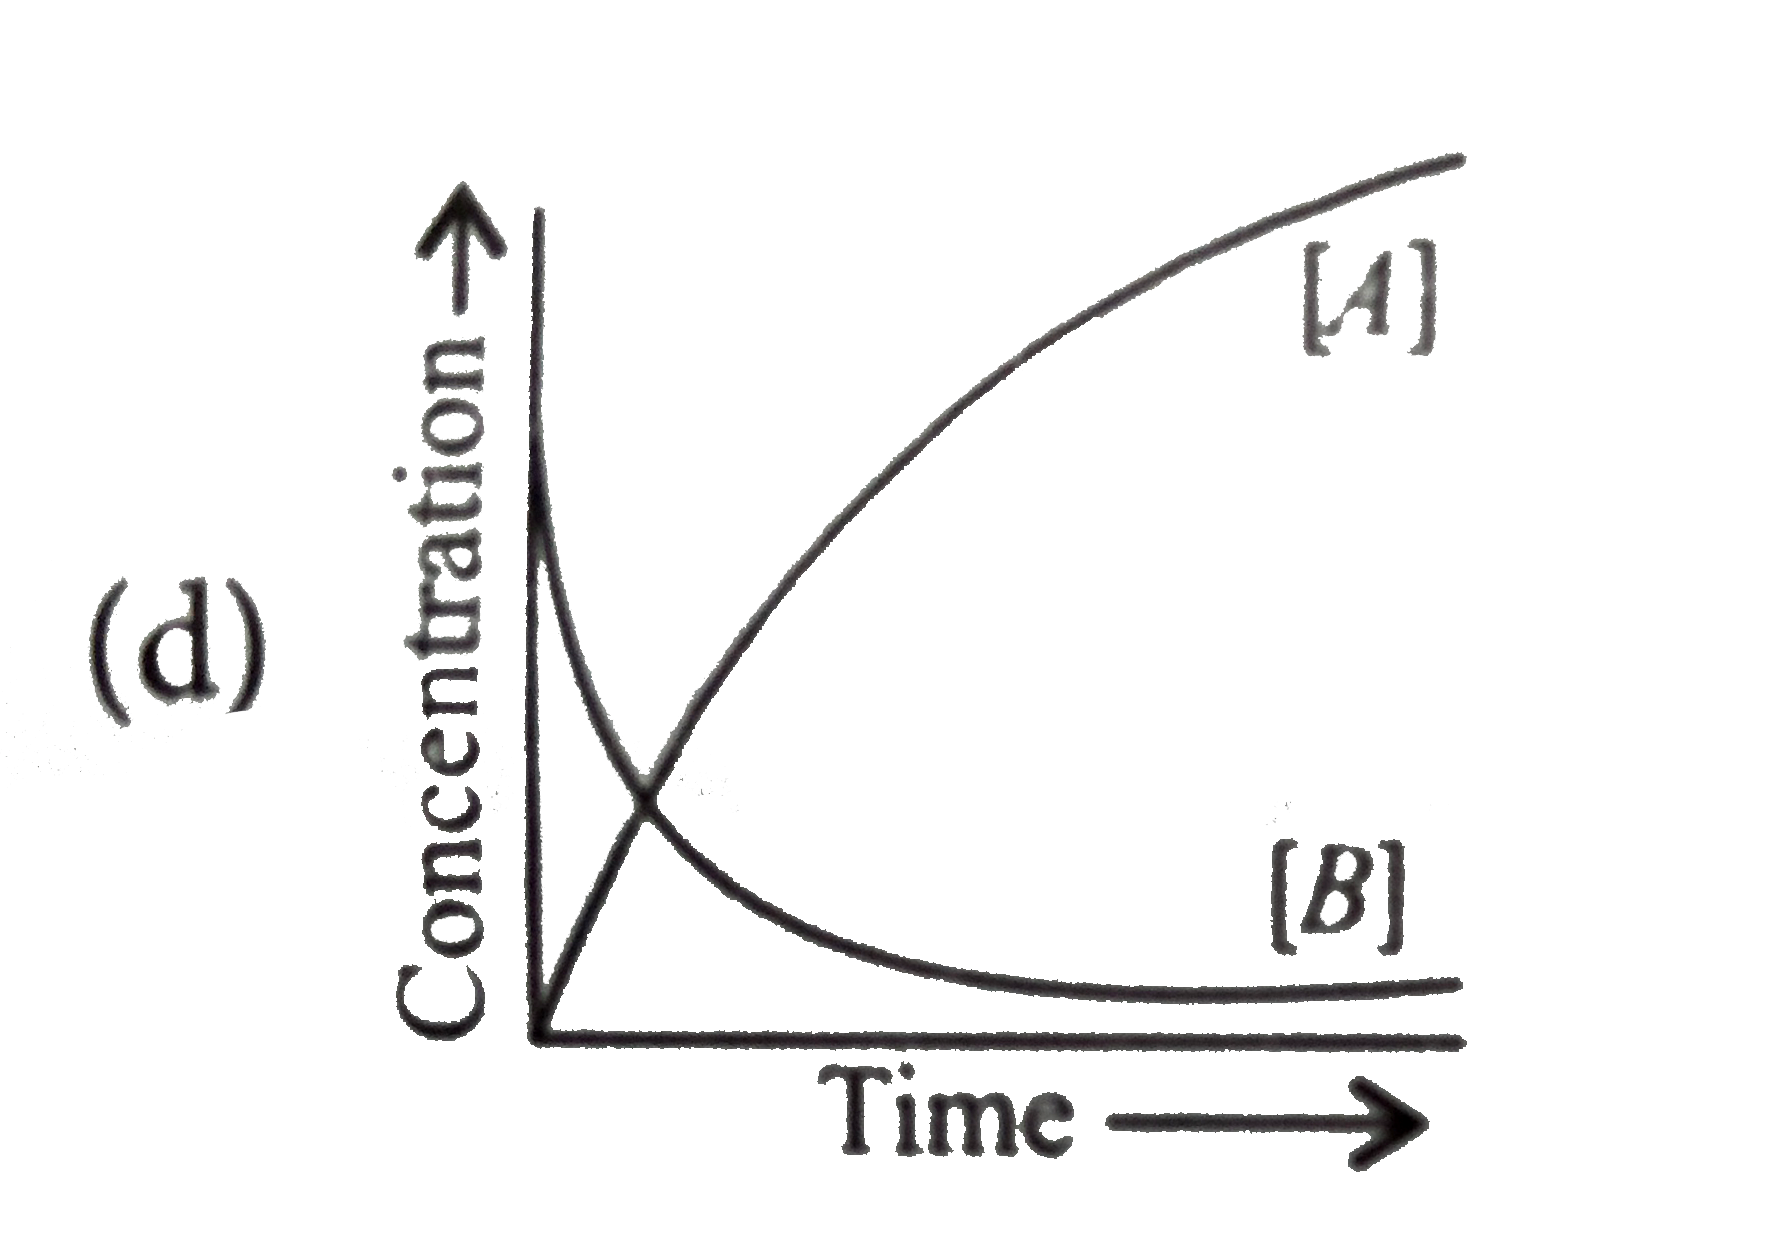
Consider the reaction A→B. The concentration of both the reactants and the products varies exponentially with time. Which of the following figure correctly describes the change in concentration of reactants and products with time ?
A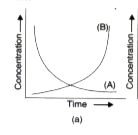 B
B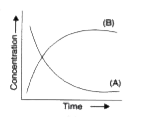 C
C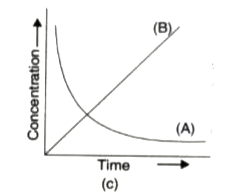 D
D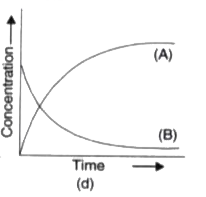
Consider the reaction A→B. The concentration of both the reactants and the products varies exponentially with time. Which of the following figure correctly describes the change in concentration of reactants and products with time ?
A B
B C
C D
D
Initial concentration of reactant for nth order reaction is 'a'. Which of the following relations is correct about t1/2 of the reaction?
View SolutionConsider the reaction A→B. The concentration of both the reactants and the products varies exponentially with time. Which of the following figure correctly describes the change in concentration of reactants and products with time ?
View SolutionA certain reaction A→B follows the given concentration (Molarity)-time graph. Which of the following statements is/are true?
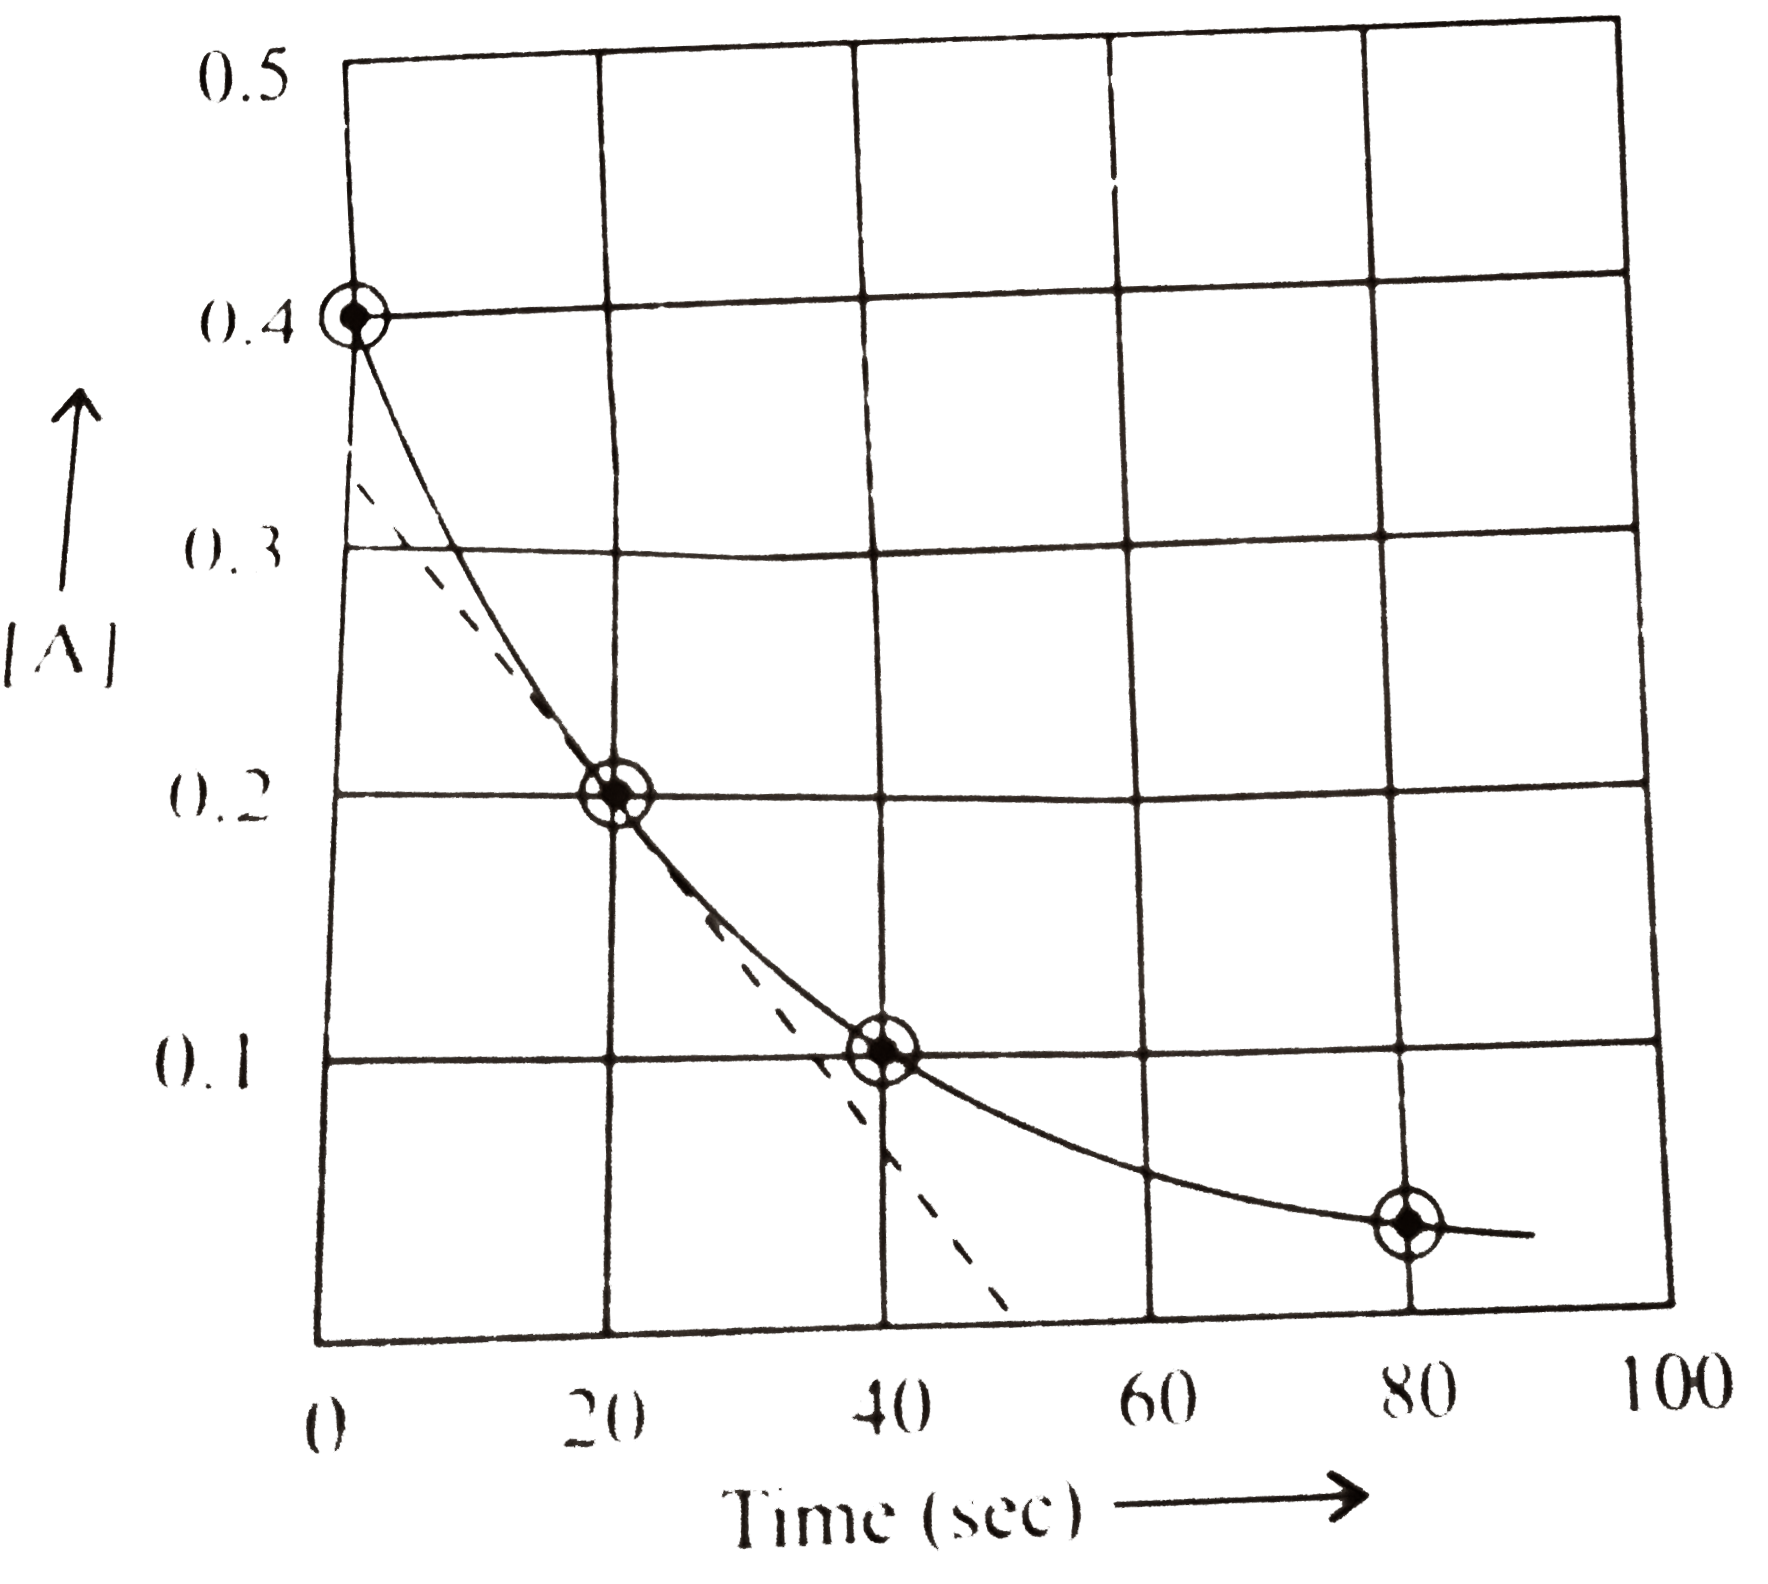
(a)The reaction is second order with respect to A .
(b) The rate for this reaction at 20 s will be 7 × 10 − 3 M s − 1
(c) The rate for this reaction at 80 s will be 1.75 × 10 − 3 M s − 1
(d) The [ B ] will be 0.35 M at t = 60 s .
View SolutionWhich of the following expresison is correct for first order reaction (c0 refers to initial concentration of reactant)
View SolutionConsider the reaction A→B. The concentration of both the reactants and the products varies exponentially with time. Which of the following figure correctly describes the change in concentration of reactants and products with time ?
View Solution
