Read the bar graph (Fig 3.4) and answer the questions that follow:Number of books sold by a bookstore during five consecutive years.(i) About how many books were sold in 1989? 1990? 1992?(ii) In which year were about 475 books sold? About 225 books sold?(iii) In which years were fewer than 250 books sold?(iv) Can you explain how you would estimate the number of books sold in 1989?
To solve the question based on the bar graph showing the number of books sold by a bookstore during five consecutive years, we will analyze the data step by step.
Step 1: Extract Data from the Bar Graph
We need to read the bar graph carefully to extract the number of books sold in each year.
- 1989: Approximately 180 books
- 1990: Approximately 480 books
- 1991: Approximately 300 books
- 1992: Approximately 220 books
- 1993: Approximately 600 books
Step 2: Answer the Questions
(i) About how many books were sold in 1989? 1990? 1992?
- 1989: Approximately 180 books
- 1990: Approximately 480 books
- 1992: Approximately 220 books
(ii) In which year were about 475 books sold? About 225 books sold?
- About 475 books sold: This is closest to 480 books sold in 1990.
- About 225 books sold: This is closest to 220 books sold in 1992.
(iii) In which years were fewer than 250 books sold?
- Fewer than 250 books sold: This occurred in 1989 (180 books) and 1992 (220 books).
(iv) Can you explain how you would estimate the number of books sold in 1989?
To estimate the number of books sold in 1989, you can draw a horizontal line from the top of the bar for 1989 to the y-axis. Where this line intersects the y-axis gives you the approximate number of books sold. From the graph, this intersection shows about 180 books.
Summary of Answers:
1. Books sold in 1989: 180
2. Books sold in 1990: 480
3. Books sold in 1992: 220
4. Year with about 475 books sold: 1990
5. Year with about 225 books sold: 1992
6. Years with fewer than 250 books sold: 1989 and 1992
7. Estimation method for 1989: Draw a horizontal line from the top of the bar to the y-axis.
We need to read the bar graph carefully to extract the number of books sold in each year.
- 1990: Approximately 480 books
- 1991: Approximately 300 books
- 1992: Approximately 220 books
- 1993: Approximately 600 books
- 1989: Approximately 180 books
- 1990: Approximately 480 books
- 1992: Approximately 220 books
- About 475 books sold: This is closest to 480 books sold in 1990.
- About 225 books sold: This is closest to 220 books sold in 1992.
- Fewer than 250 books sold: This occurred in 1989 (180 books) and 1992 (220 books).
To estimate the number of books sold in 1989, you can draw a horizontal line from the top of the bar for 1989 to the y-axis. Where this line intersects the y-axis gives you the approximate number of books sold. From the graph, this intersection shows about 180 books.
1. Books sold in 1989: 180
2. Books sold in 1990: 480
3. Books sold in 1992: 220
4. Year with about 475 books sold: 1990
5. Year with about 225 books sold: 1992
6. Years with fewer than 250 books sold: 1989 and 1992
7. Estimation method for 1989: Draw a horizontal line from the top of the bar to the y-axis.
Topper's Solved these Questions
- DATA HANDLINGBOOK - NCERT ENGLISHCHAPTER - DATA HANDLINGEXERCISE - EXERCISE 3.1
8 Videos
- DATA HANDLINGBOOK - NCERT ENGLISHCHAPTER - DATA HANDLINGEXERCISE - EXERCISE 3.2
5 Videos
- DATA HANDLINGBOOK - NCERT ENGLISHCHAPTER - DATA HANDLINGEXERCISE - EXERCISE 3.4
4 Videos
- CONGRUENCE OF TRIANGLESBOOK - NCERT ENGLISHCHAPTER - CONGRUENCE OF TRIANGLESEXERCISE - SOLVED EXAMPLES
9 Videos
- EXPONENTS AND POWERSBOOK - NCERT ENGLISHCHAPTER - EXPONENTS AND POWERSEXERCISE - EXERCISE 13.2
5 Videos
Similar Questions
Knowledge Check
Raman sold 21 books for Rs.375 each. How must he quickly estimate the amount available with him?
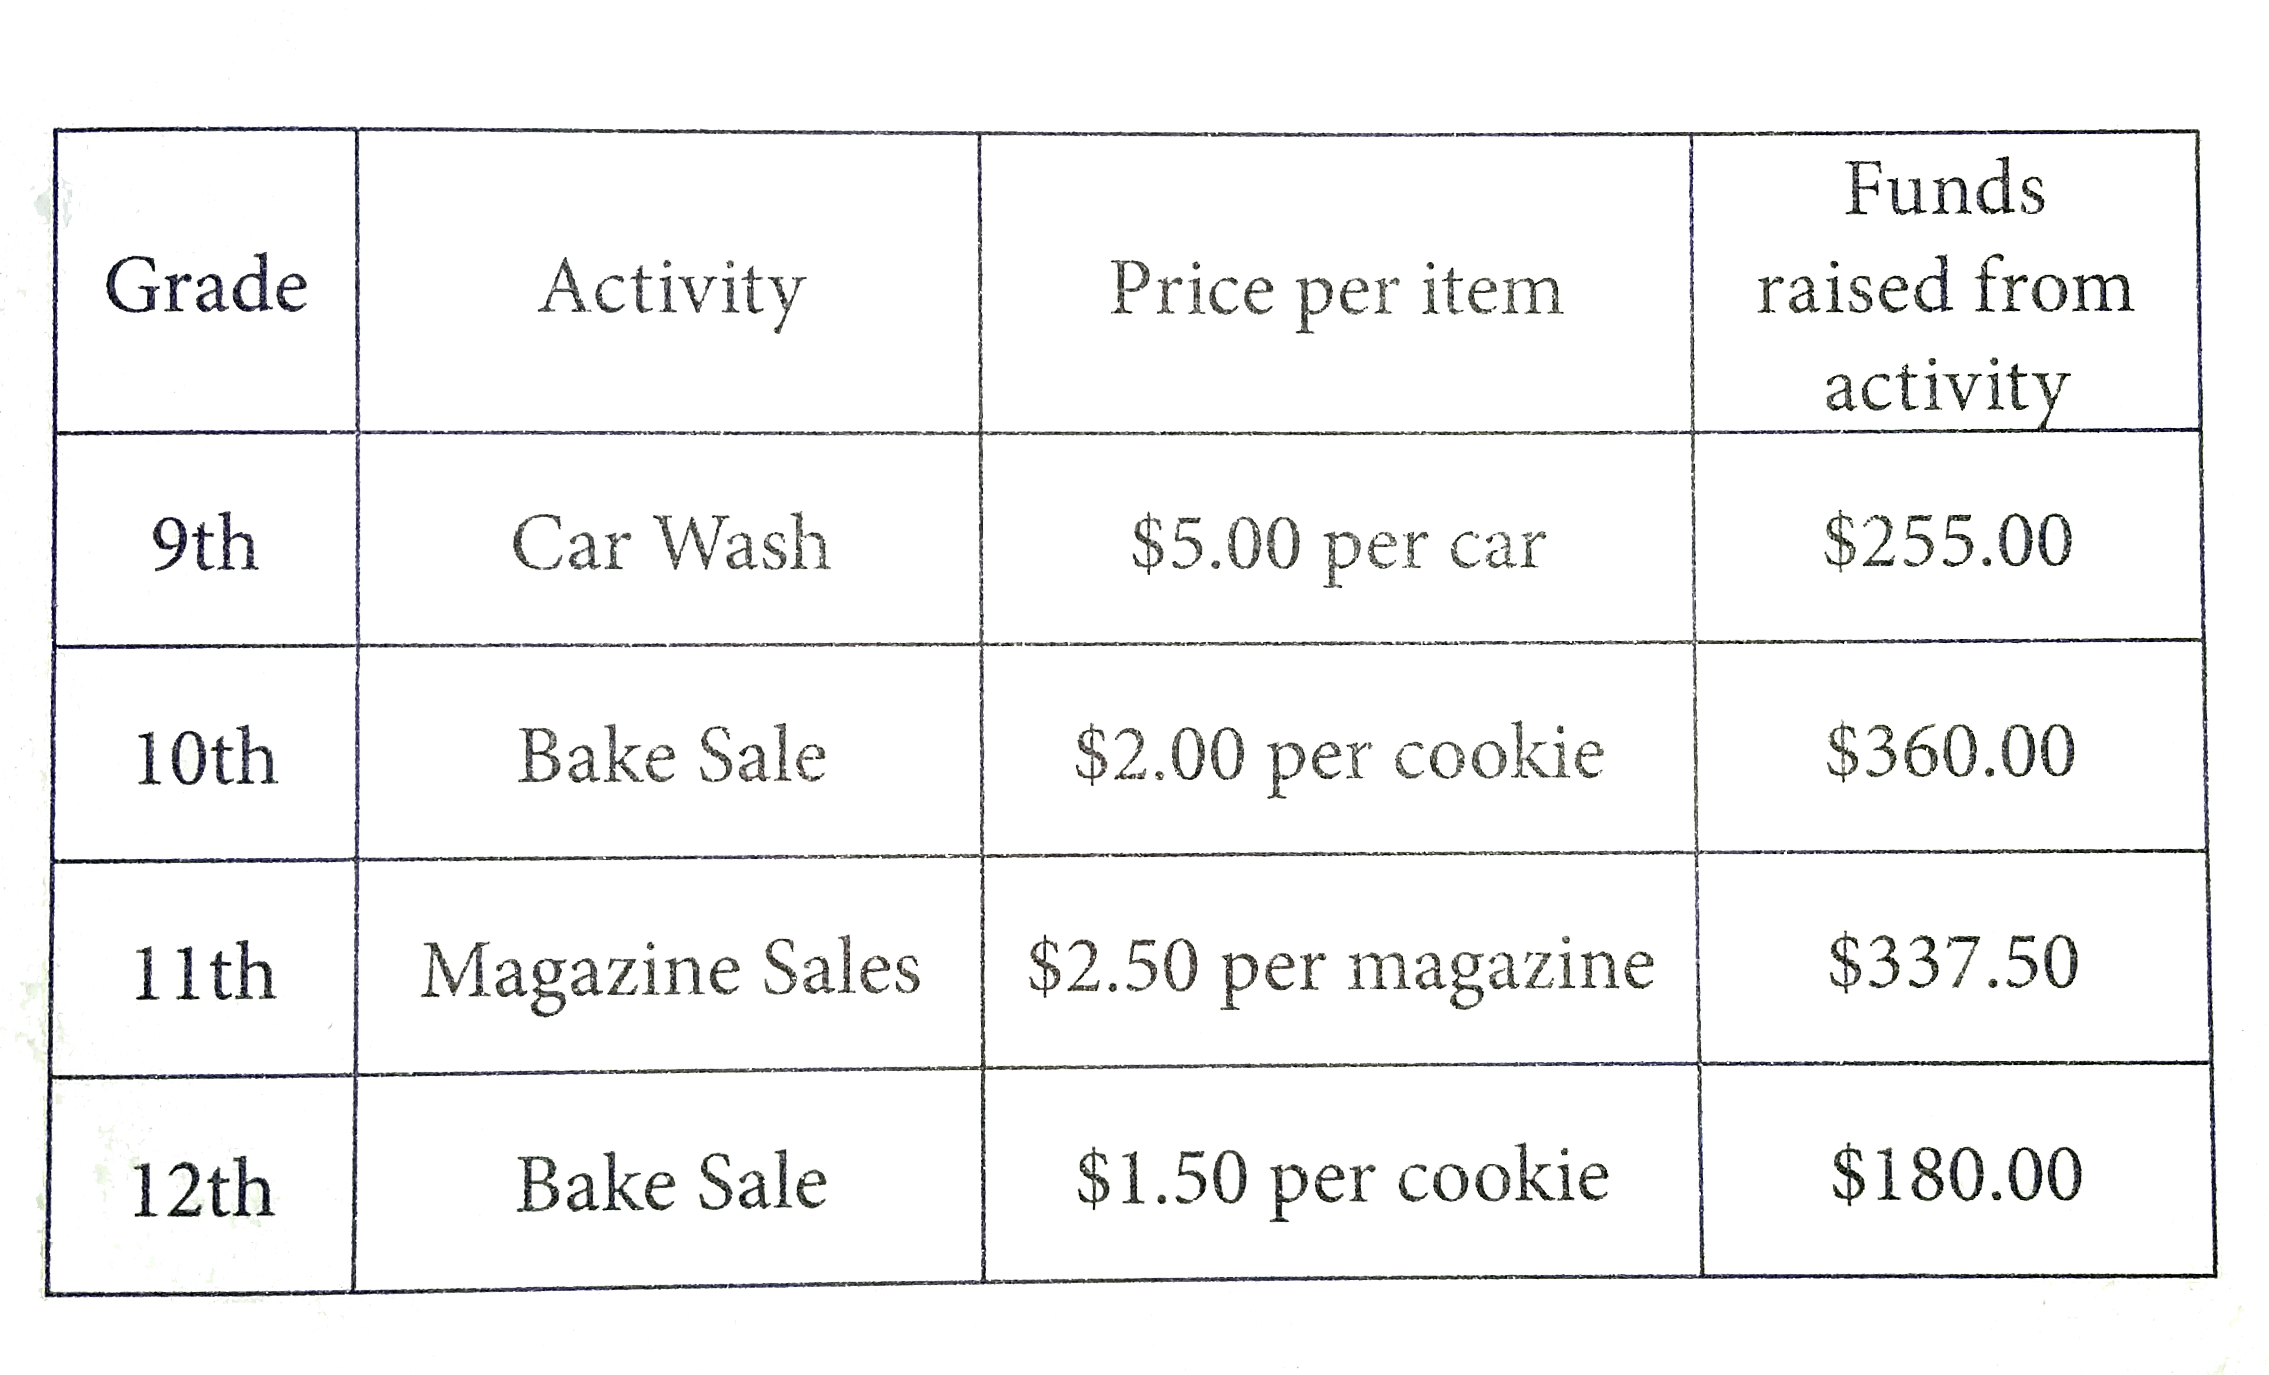
ARs.10000BRs.9000CRs.8000DRs.4000 <>br> How many more cookies were sold by the 10th grade than were sold by the 12th grade?A60B90C120D150
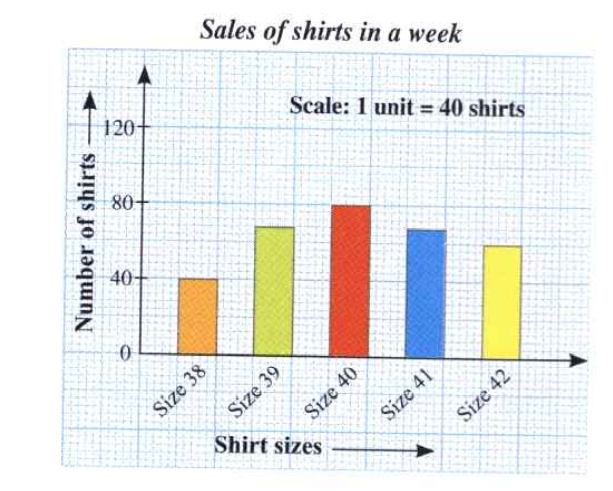
Read the following graph and answer the following question.
What are the different sizes of shirts that are sold?

View SolutionRound the following
I finished reading a book in three hours and five minutes.
View SolutionRead the bar graph shown in Figure and answer the following questions: What is the information given by the bar graph? How many tickets of Assam State Lottery were sold by the agent? Of which state, were the maximum number of tickets sold? State whether true or false. The maximum number of tickets sold is three times the minimum number of tickets sold. Of which state were the minimum number of tickets sold?
View SolutionThe weight of 72 books is 9kg. What is the weight of 80 such books? How many such books weigh 6 kg?
View SolutionThe number of Mathematics books sold by a shopkeeper on six consecutive days is shown below Draw a bar graph to represent the above information choosing the scale of your choice.
View SolutionIn one state the number of bicycles sold in the year 2002-2003 was 7,42,214. In the year 2003-2004, the number of bicycles sold was 8,00,112. In which year were more bicycles sold? And how many more?
View Solution

