Read the
following bar graph (Figure) and answer the following questions:
What
information is given by the bar graph?
What was
the production of cement in the year 1980-81?
What is the minimum and maximum productions of cement and
corresponding years?
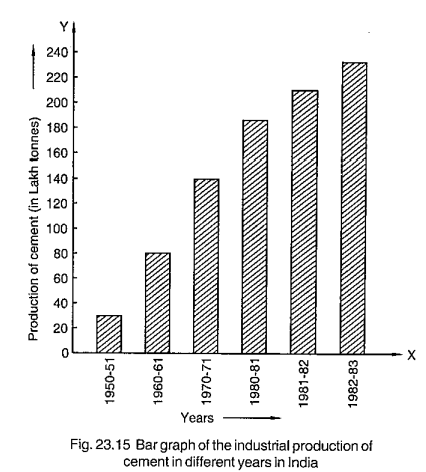
(i)The above bar graph gives information of Industrial production of cement in different years in India
(ii) The production of cement in the year 1980-81 was 186 lakh tonnes
(iii) The minimum production is 30 lakh tonnes in 1950-51 and maximum production is 232 lakh tonnes in 1982-83
Topper's Solved these Questions
Similar Questions
Read the following bar graph given in figure and answer the following questions.
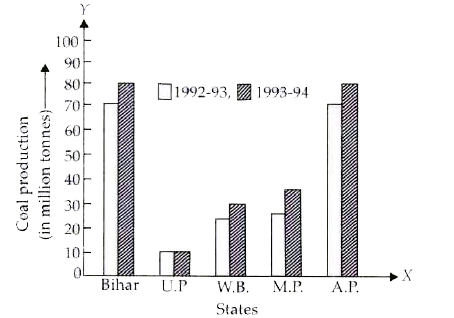
(i) What information is given by this bar graph?
View SolutionRead the graph and answer the following questions
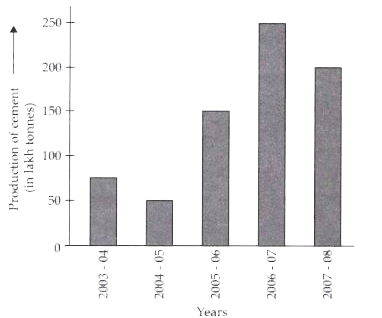
What information is conveyed by the bar graph
View SolutionRead the bar graph given below and answer the following questions:
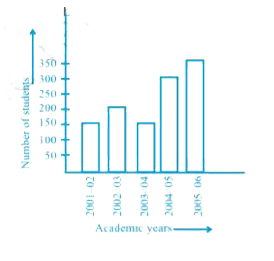
What information is given by the þar graph?
View SolutionRead the bar graph shown in figure and answer the following questions.
What is the information given by the bar graph?
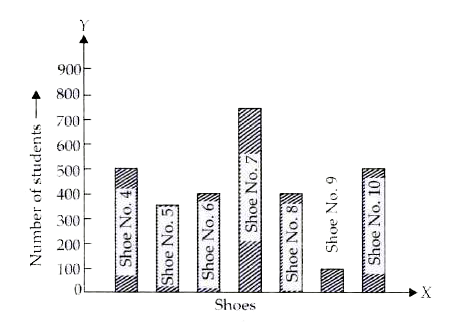
View SolutionRead the bar graph and answer the following questons.
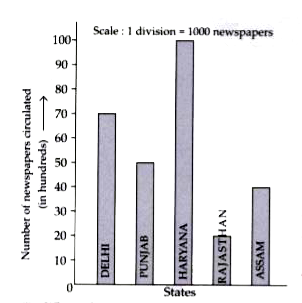
What information is given by graph ?
View SolutionRead the following bar graph given in figure and answer the following questions.
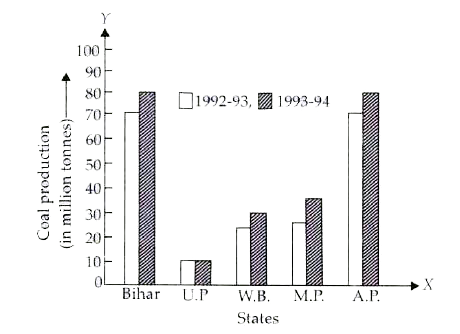
Which state has minimum production?
View SolutionRead the following bar graph and answer the following questions: What information is given by the bar graph? Which state is the largest producer of rice? Which state is the largest producer of wheat? Which state has total production of rice and wheat as its maximum? Which state has the total production of wheat and rice minimum?
View SolutionRead the following bar graph given in Figure and answer the following questions: What information is given by this bar graph? Which two states have same production in 1993-94? Name the state having same production in both the years? Which state has minimum production?
View SolutionRead the following bar graph given in figure and answer the following questions.
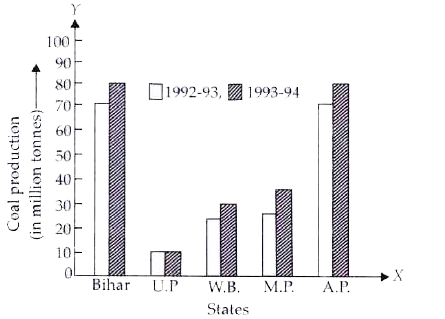
Name the state having same production in both the years?
View SolutionRead the following bar graph given in figure and answer the following questions.
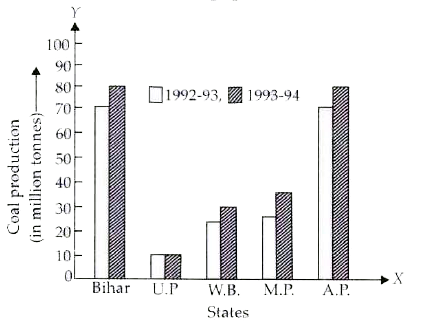
Which two states have same production in 1993-94?
View Solution
