Size of agricultural holding in a survey of 200 families is given in the following table.
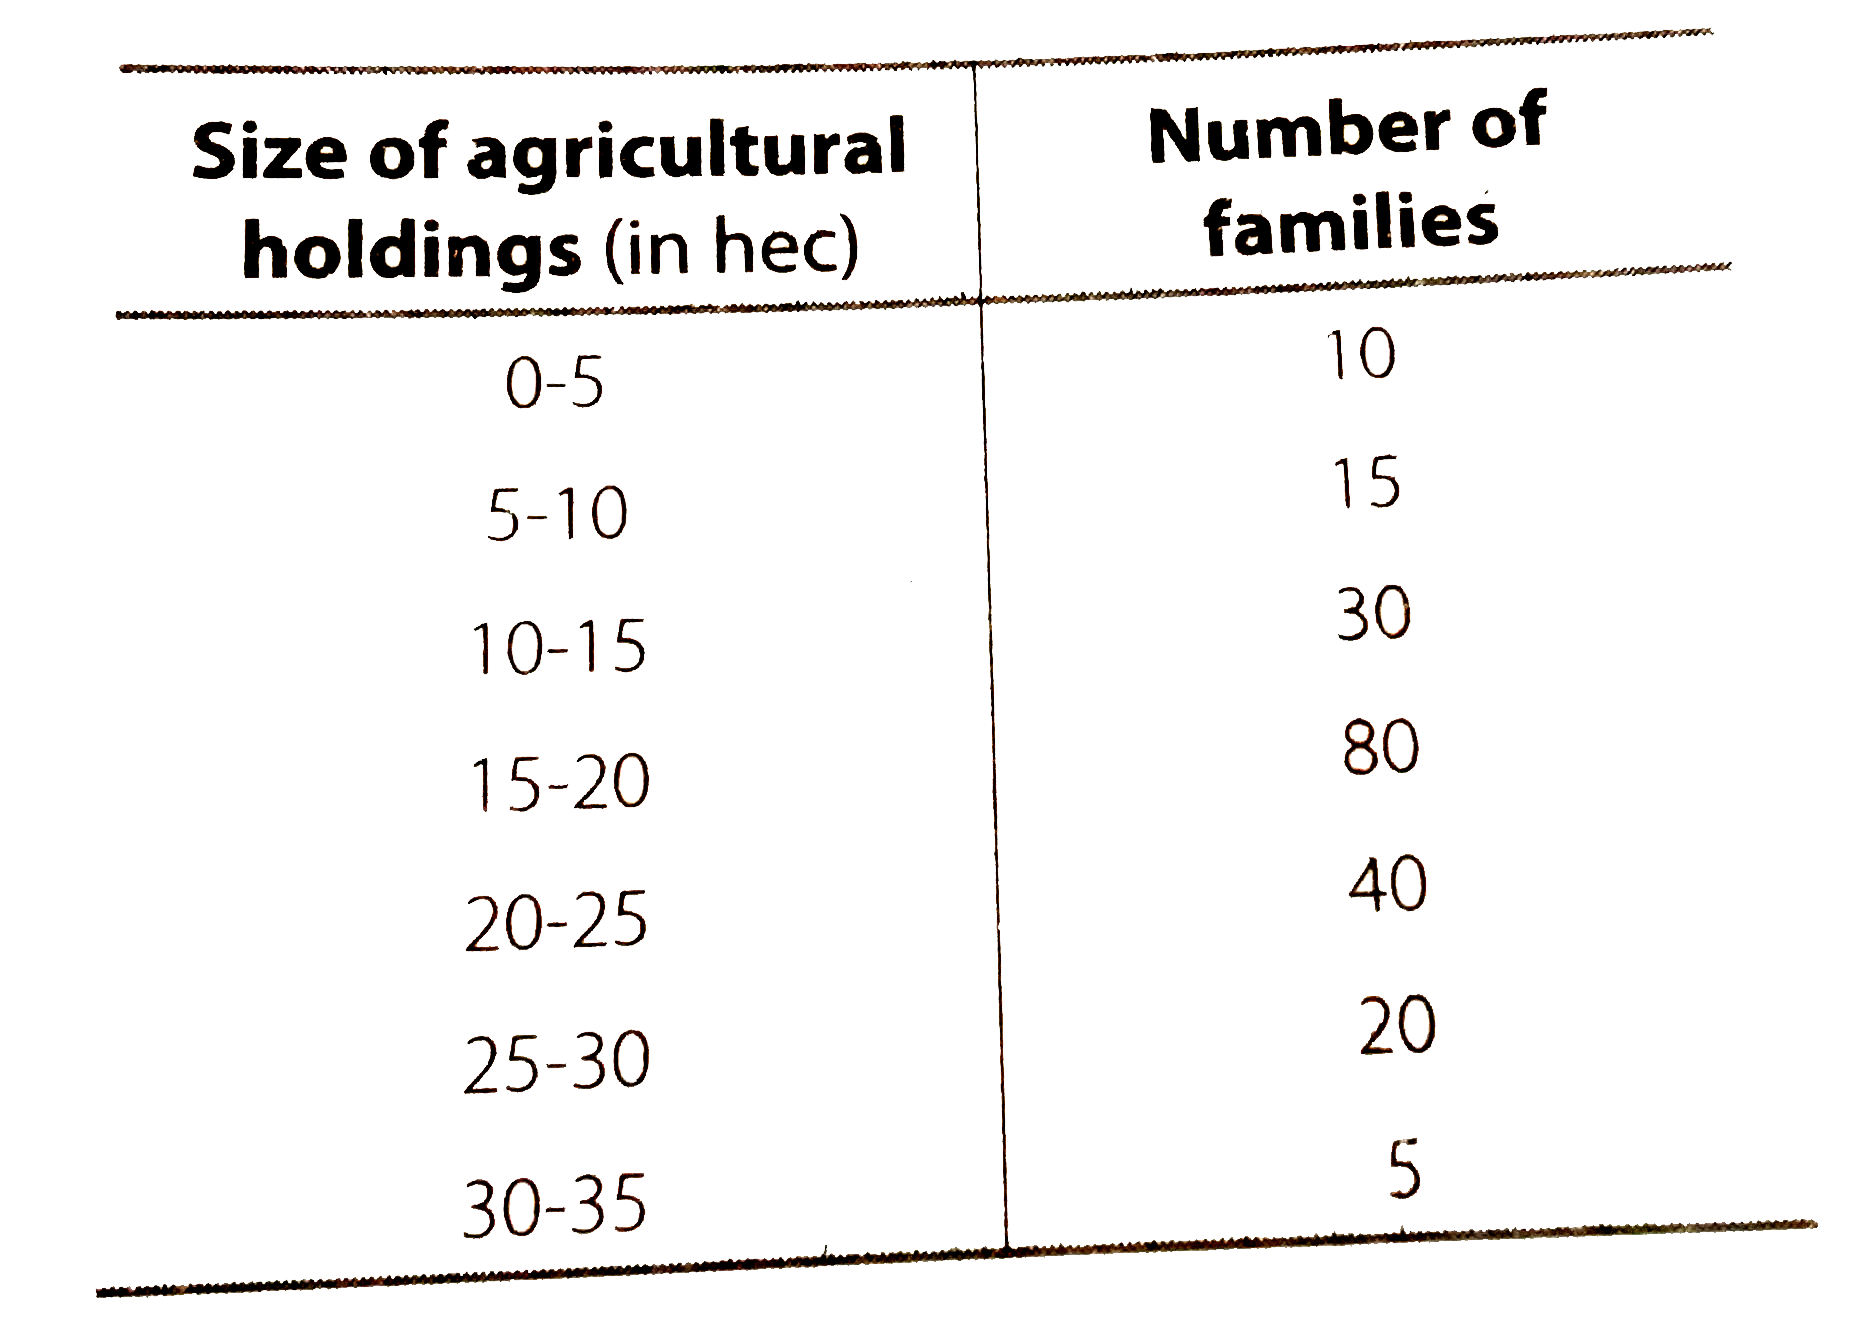
Compute median and mode size of the holdings.
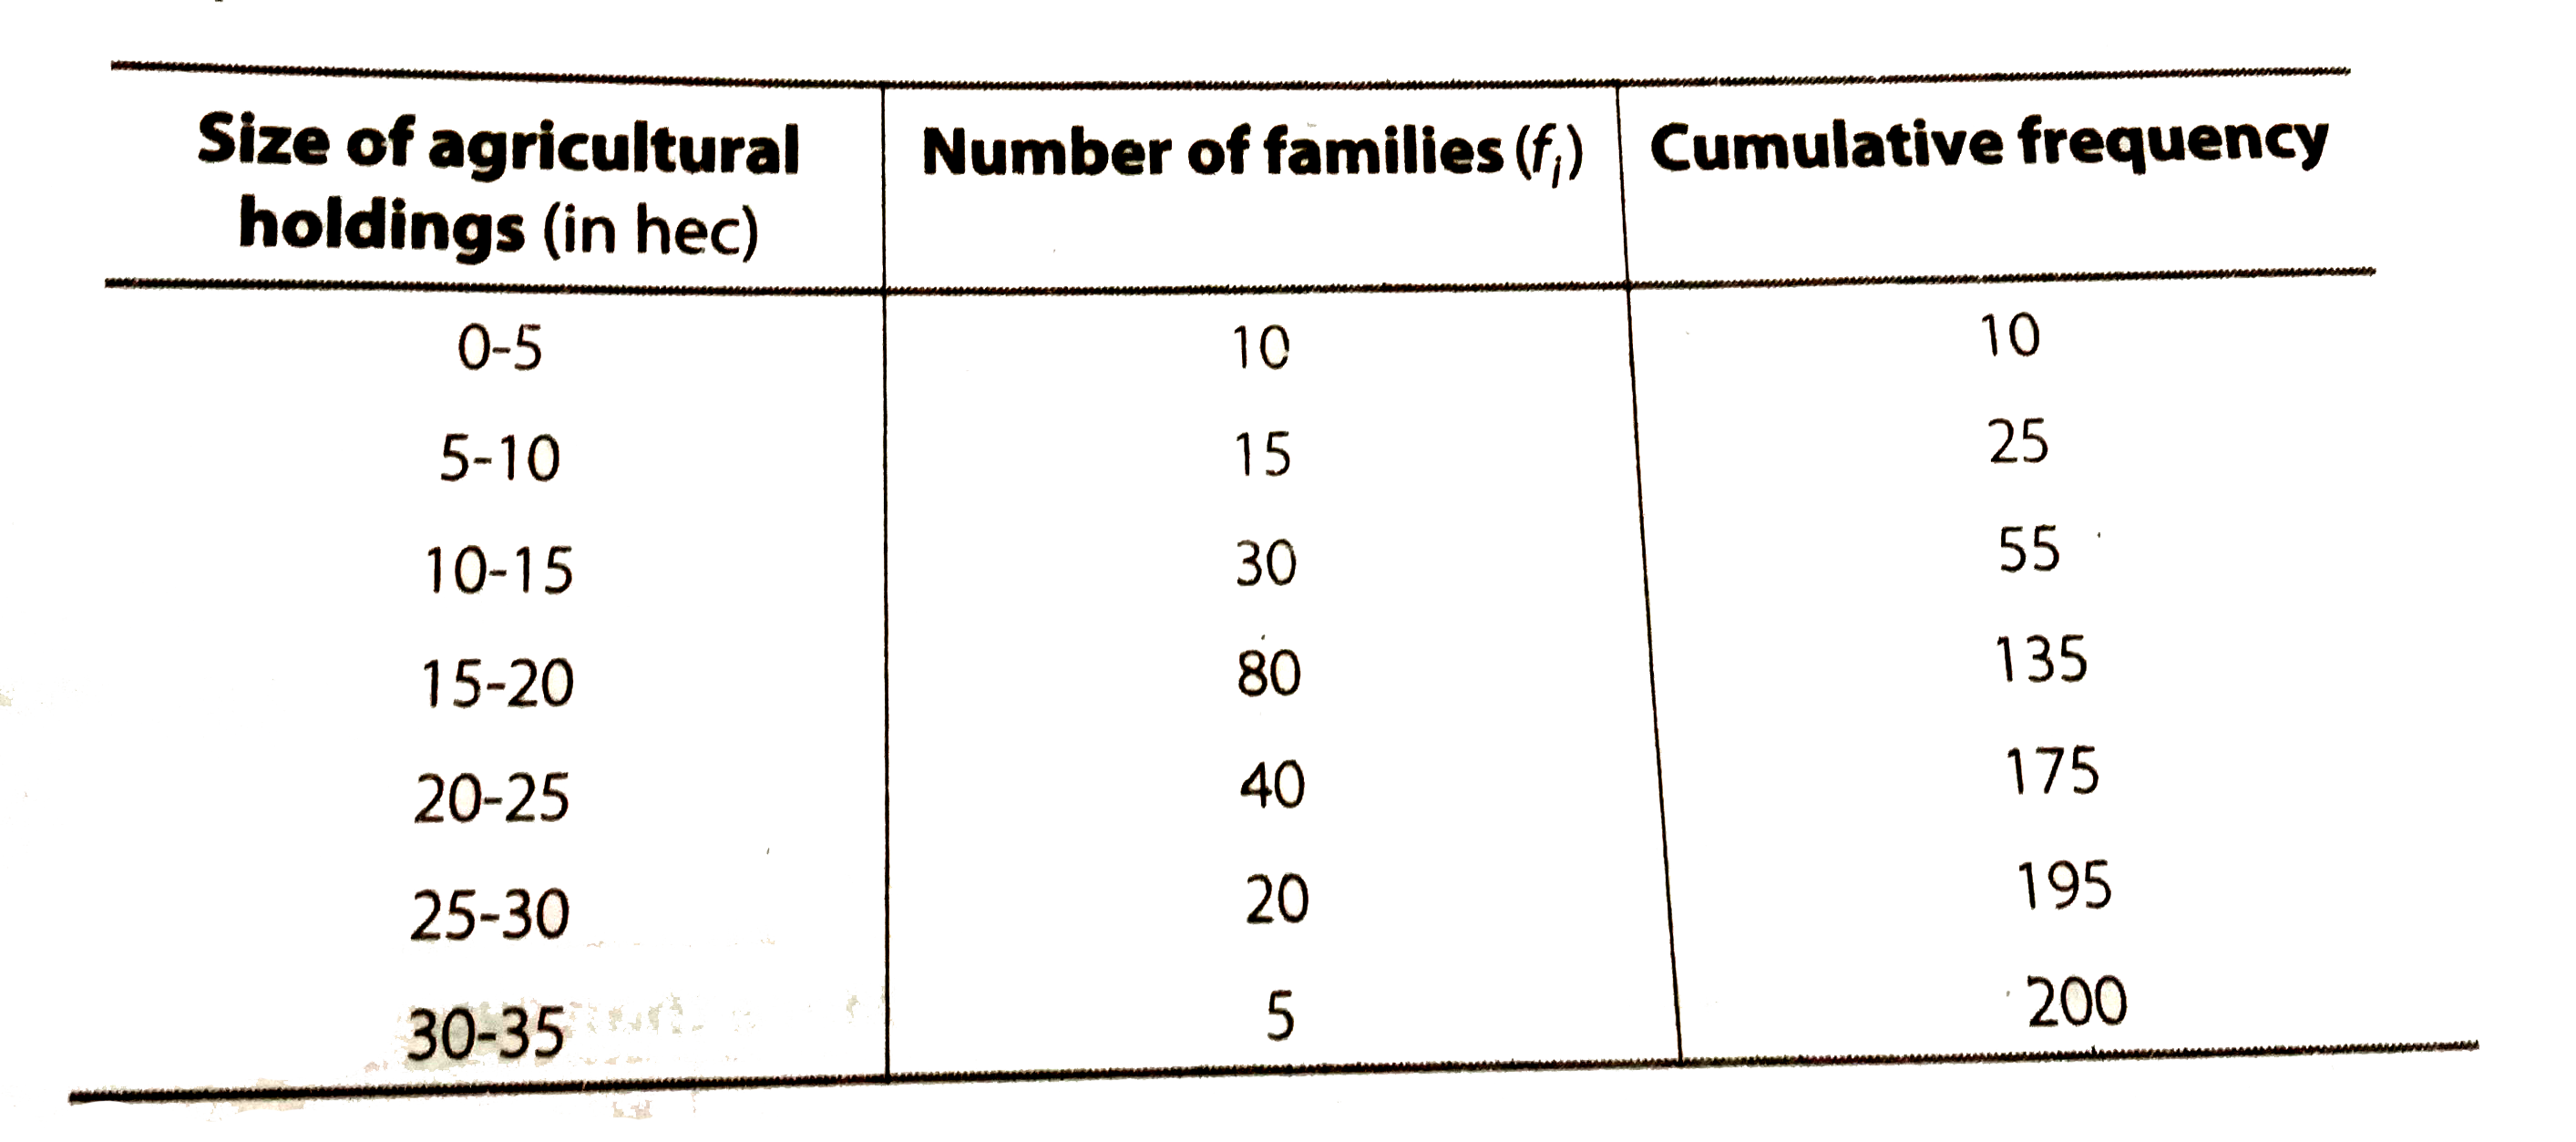
(i) Here, N=200
Now, , which lies in the interval 15-20.
Lower limit, l=15, h=5, f=80 and cf=55
(ii) In a given table 80 is the highest frequency So, the modal class is 15-20
Here,
=15+2.77=17.77 hec
Topper's Solved these Questions
- STATISTICS AND PROBABILITYBOOK - NCERT EXEMPLAR ENGLISHCHAPTER - STATISTICS AND PROBABILITYEXERCISE - SHORT ANSWERS QUESTIONS
42 Videos
- REAL NUMBERSBOOK - NCERT EXEMPLAR ENGLISHCHAPTER - REAL NUMBERSEXERCISE - LONG ANSWER TYPE QUESTIONS
5 Videos
- SURFACE AREAS AND VOLUMESBOOK - NCERT EXEMPLAR ENGLISHCHAPTER - SURFACE AREAS AND VOLUMESEXERCISE - LONG ANSWER TYPE QUESTIONS
20 Videos
Similar Questions
Knowledge Check
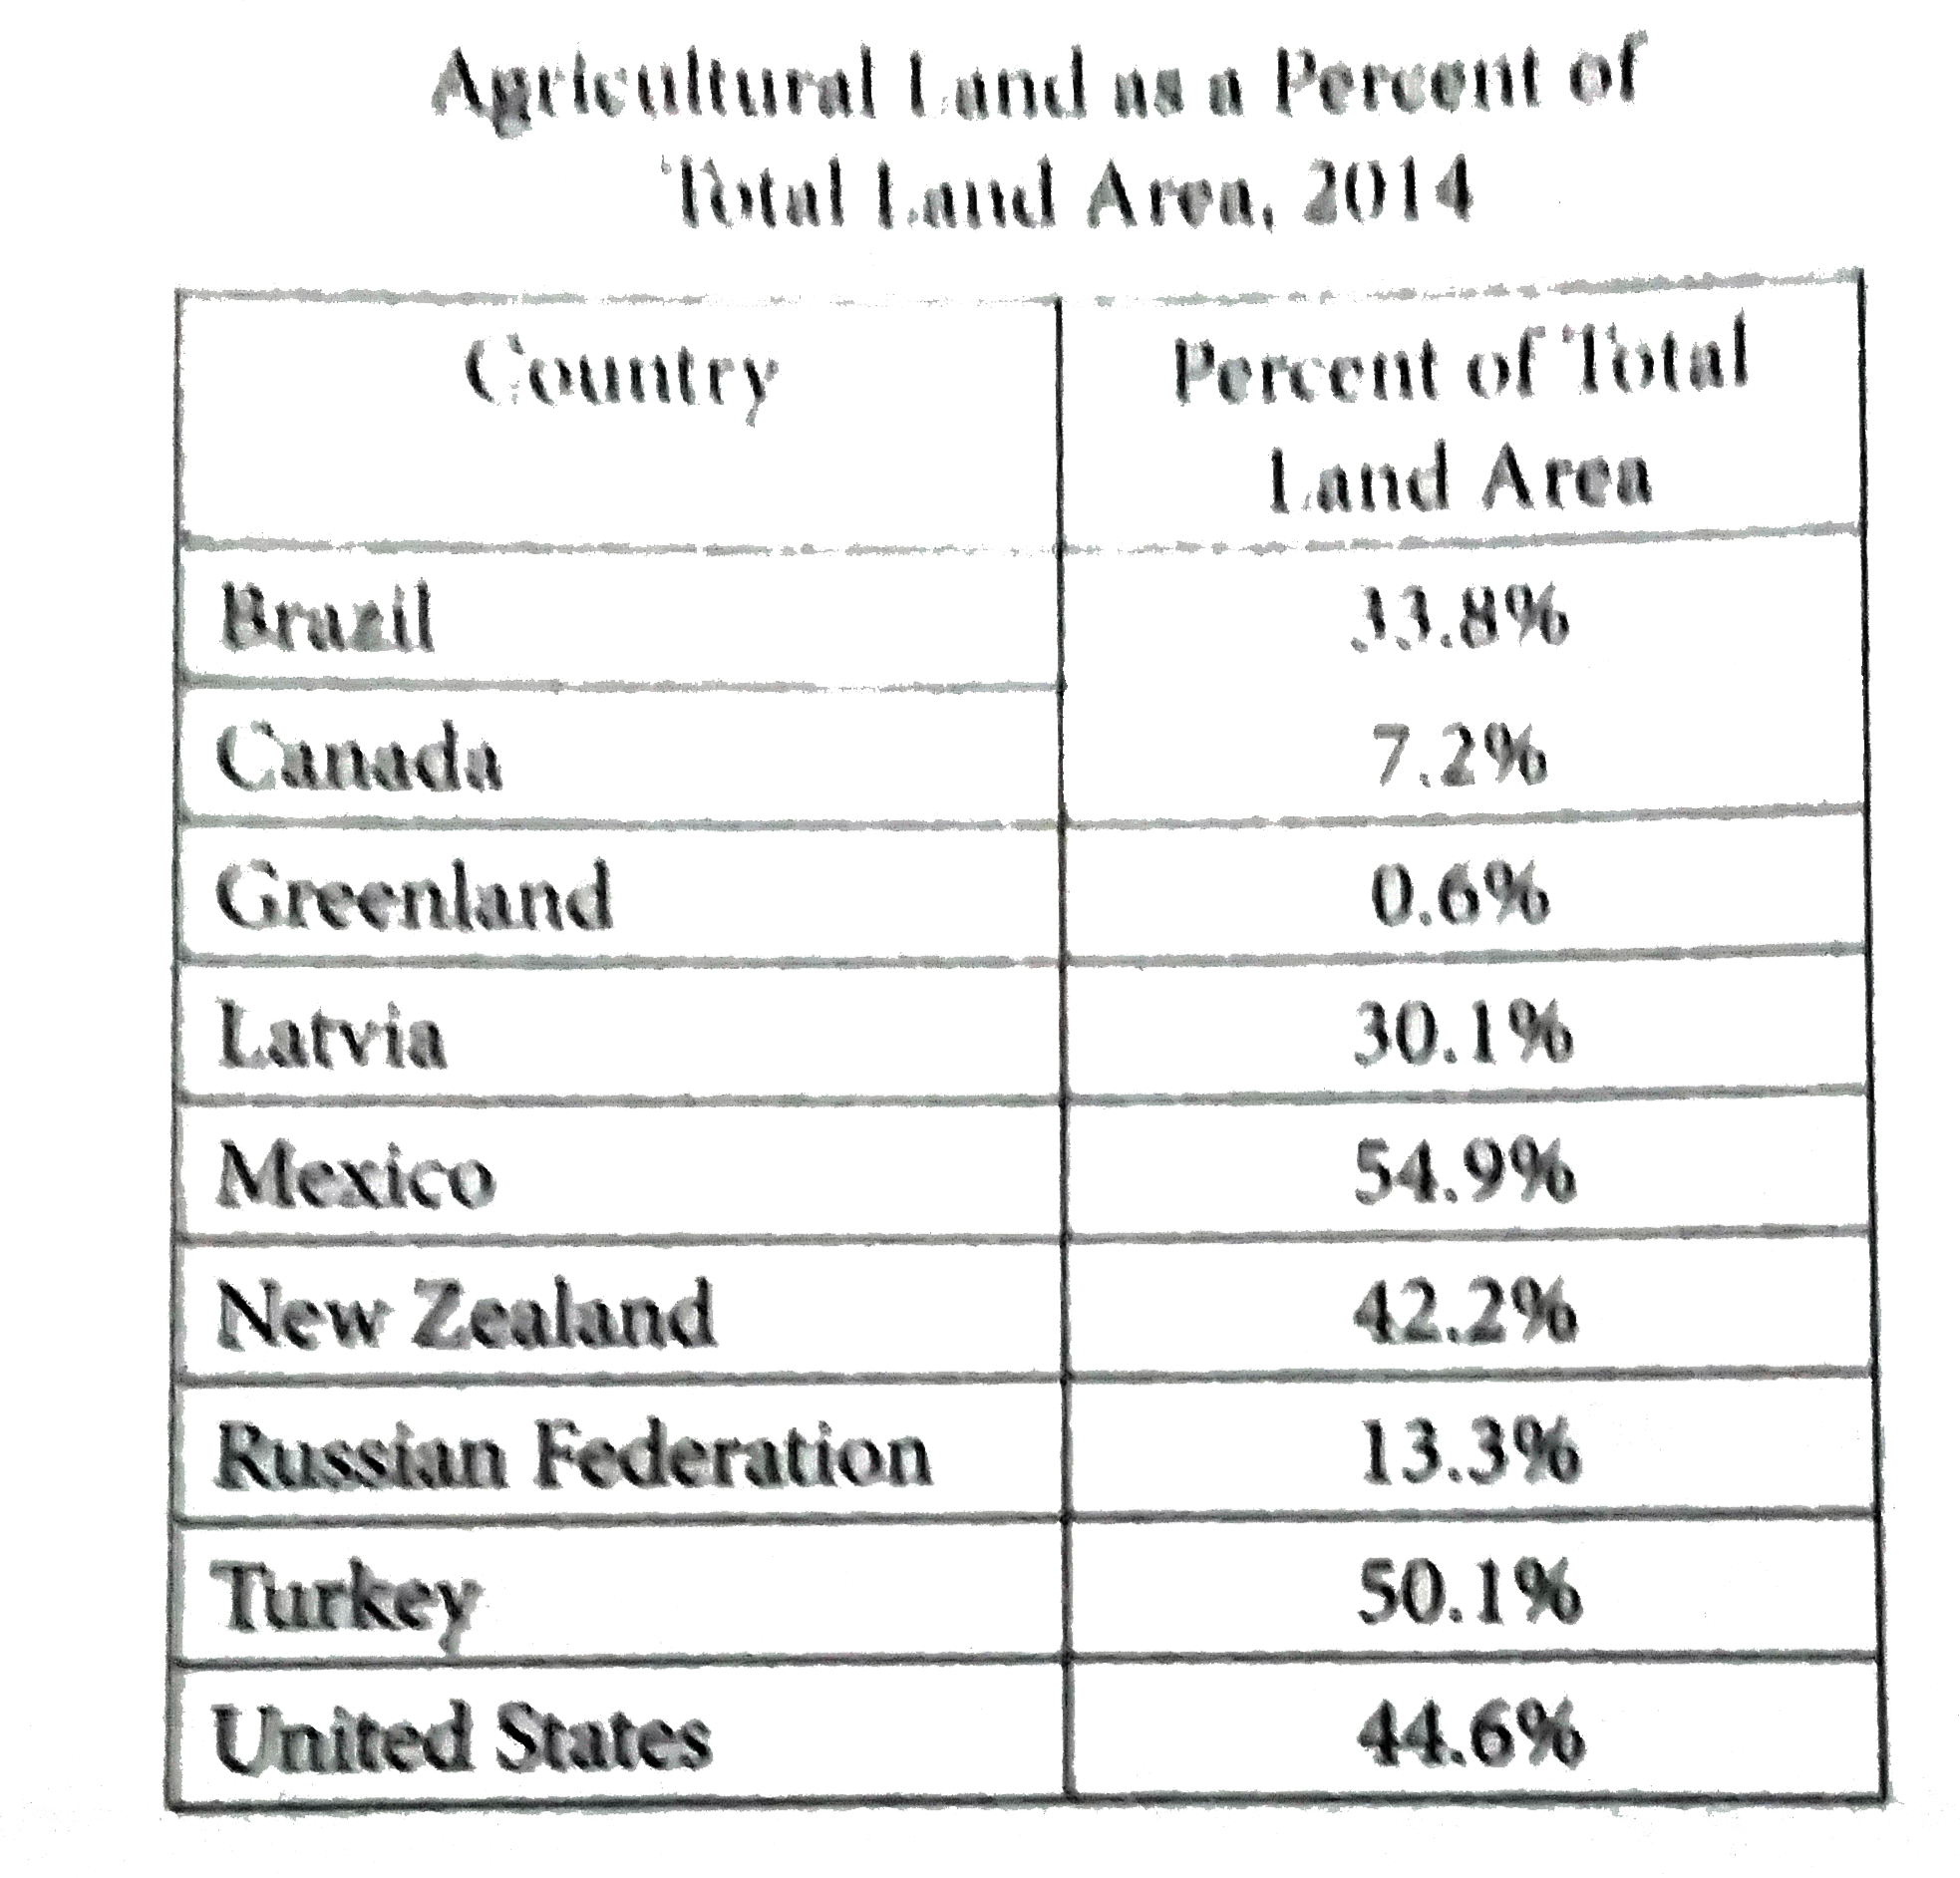
The world bank measures the amount of land devoted to agriculture among all 196 countries in the world. The results from 9 of the countries are given in the table above. The median percent of of agrilcultural land for all 196 countries in 34.95%. What is the difference between the median percent of agricultural land for these 9 countries and the median for all 196 countries?A0.0115B0.0419C0.0965D0.1995
A die is thrown 12 times and the source are recorded in the following table.

Find the range, mean and mode of the given scores.
View SolutionAges of 20 Students Enrolled in a College Class
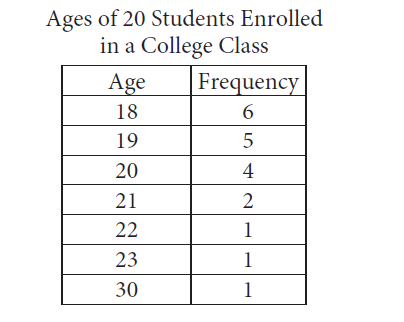
The table above shows the distribution of ages of the 20 students enrolled in a college class. Which of the following gives the correct order of the mean, median, and mode of the ages?
View SolutionGiven the following table

Compute i) E(4X+5) ii) E(X2)
iii) V(X) iv) V(2X±3)
View SolutionThe following table gives the marks of 5 students in Science and Maths.

Find the mean, median, and mode of the marks scored in Science
View SolutionTo know the opinion of the students about Mathematics, a survey of 200 students was conducted. The data is recorded in the following table: Opinion: Like Dislike No. of students 135 65 Find the probability that a student chosen at random (i) like Mathematics (ii) does not like it.
View SolutionA survey conducted on 20 households in a locality by a group of students resulted in the following frequency table for the number of family members in a household:Find the mode of this data.
View SolutionThe percentages of various categories of workers in a state are given in the following table. Categories, Cultivators, Agricultural Labourers, Industrial Workers, Commercial Workers, Others % of workers, 40, 25, 12.5, 10, 12.5 Present the information in the form a pie-chart.
View Solution

