Study the graph and answer the questions that follow.
(a) What information does the graph give?
(b) On which day was the temperature the least?
(c) On which day was the temperature 31∘C?
(d) Which was the hottest day?
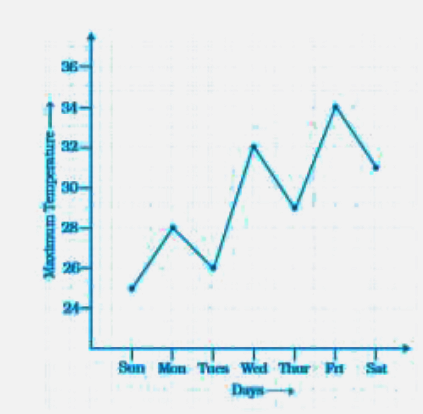
Step by step video & image solution for Study the graph and answer the questions that follow. (a) What information does the graph give? (b) On which day was the temperature the least? (c) On which day was the temperature 31^(@)C? (d) Which was the hottest day? by Maths experts to help you in doubts & scoring excellent marks in Class 8 exams.
Updated on:21/07/2023Topper's Solved these Questions
- INTRODUCTION TO GRAPHS BOOK - NCERT EXEMPLARCHAPTER - INTRODUCTION TO GRAPHS EXERCISE - THINK AND DISCUSS
4 Videos
- EXPONENTS AND POWERSBOOK - NCERT EXEMPLARCHAPTER - EXPONENTS AND POWERSEXERCISE - EXERCISE
195 Videos
- LINEAR EQUATIONS IN ONE VARIABLEBOOK - NCERT EXEMPLARCHAPTER - LINEAR EQUATIONS IN ONE VARIABLEEXERCISE - THINK AND DISCUSS
3 Videos
Similar Questions
The graph shows the maximum temperatures recorded for two consecutive weeks of a town. Study the graph and answer the questions that follow.
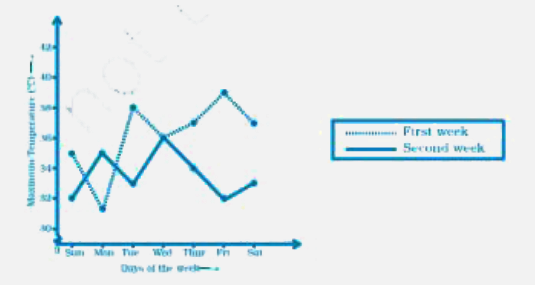
(a) What information is given by the two axes?
(b) In which week was the temperature higher on most of the days?
(c) On which day was the temperature same in both the weeks?
(d) On which day was the difference in temperatures the maximum for both the weeks?
(e) What were the temperatures for both the weeks on Thursday?
(f) On which day was the temperature 35°C for the first week?
(g) On which day was the temperature highest for the second week?
View SolutionRead the graph and answer the following questions
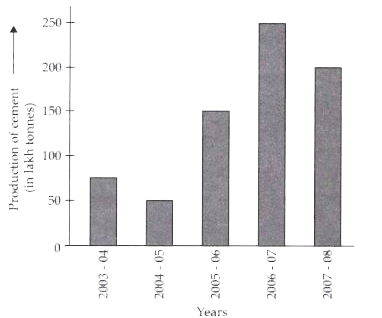
What information is conveyed by the bar graph
View Solution
Knowledge Check
Study the following graph carefully and answer the questions that follow
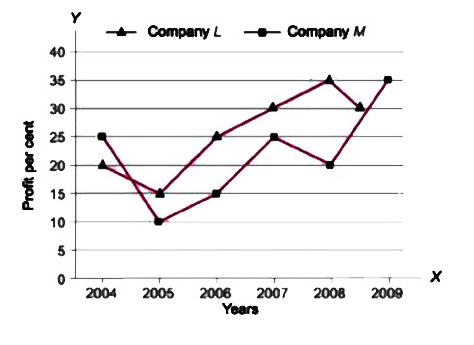
Which of the following statements is true with respect to the above graph ?ACompany M made the highest profit in the year 2009BCompany L made the least profit in the year 2005CThe ratio of the profits earned by company L and company M in the year 2006 was 6:5DCompany L made the highest profit in the year 2008
Study the bar graph and answer the following questions.
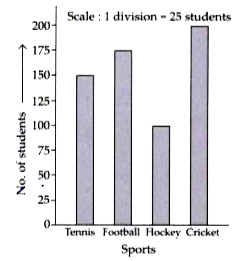
Which sport is preferred least ?
View SolutionStudy the following graph and answer the question based on the graph.
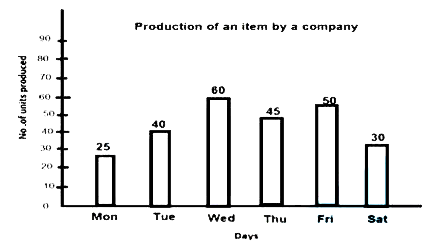
On which day the production was 1/5th of the total production?
View SolutionThe graph given below compares the sales of ice creams of two vendors for a week.
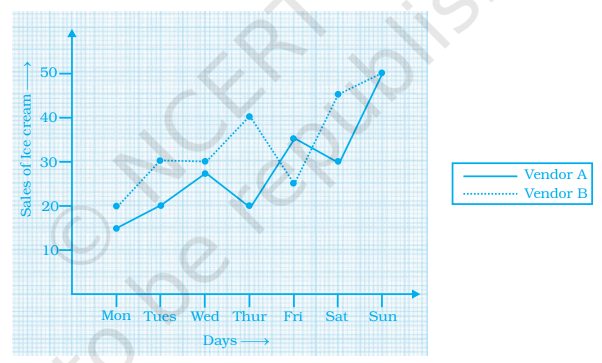
Observe the graph and answer the following questions.
(a) Which vendor has sold more icecreams on Friday?
(b) For which day was the sales same for both the vendors?
(c) On which day did the sale of vendor A increase the most as compared to the previous day?
(d) On which day was the difference in sales the maximum?
(e) On which two days was the sales same for vendor B?
View SolutionStudy the bar graph and answer the following questions.
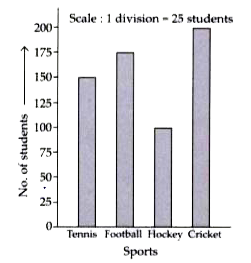
Which is the most popular sport ?
View SolutionThe following graph shows the number of people present at a certain shop at different times. Observe the graph and answer the following questions.
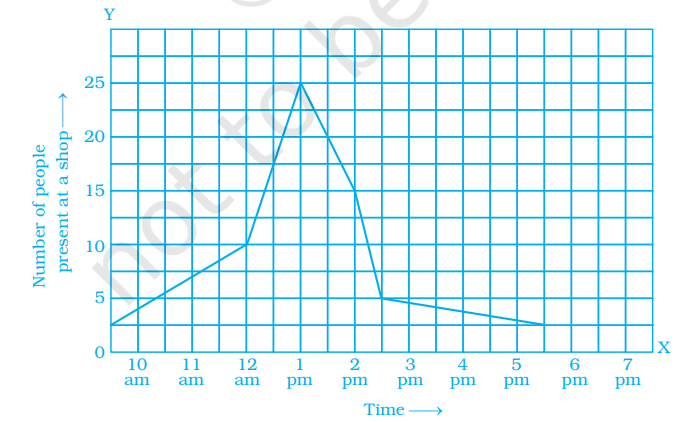
(a) What type of a graph is this?
(b) What information does the graph give?
(c) What is the busiest time of day at the shop?
(d) How many people enter the shop when it opens?
(e) About how many people are there in the shop at 1:30 pm?
View SolutionThe table given below shows the temperatures recorded on a day at different times.
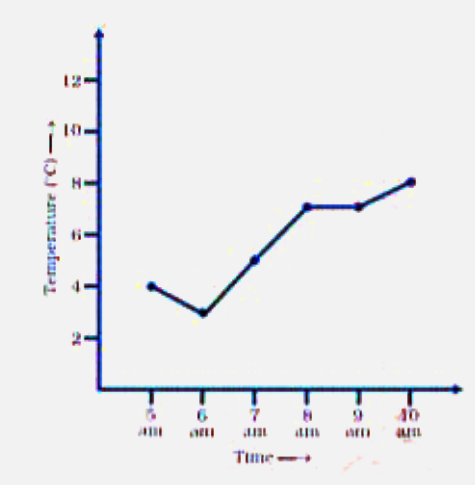
Observe the table and answer the following questions.
(a) What is the temperature at 8 am?
(b) At what time is the temperature 3∘C?
(c) During which hour did the temperature fall?
(d) What is the change in temperature between 7 am and 10 am?
(e) During which hour was there a constant temperature?
View SolutionStudy the double bar graph given below and answer the questions that follow:
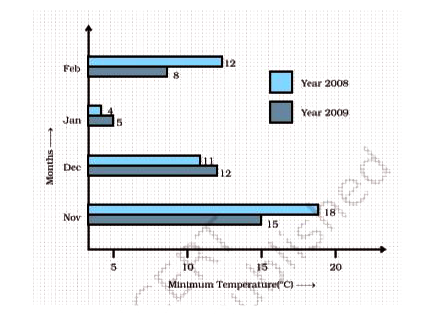
(a) What information is compared in the above given double bar graph?
(b) Calculate the ratio of minimum temperatures in the year 2008 to the year 2009 for the month of November.
(c) For how many months was the minimum temperature in the year 2008 greater than that of year 2009? Name those months.
(d) Find the average minimum temperature for the year 2008 for the four months.
(e) In which month is the variation in the two temperatures maximum?
View Solution