The following chart gives the growth in height in terms of percentage of full height of boys and girls with their respective ages.

Draw the line graph of above data on the same sheet and answer the following questions.
(a) In which year both the boys and the girls achieve their maximum height?
(b) Who grows faster at puberty (14 years to 16 years of age)?
Step by step video & image solution for The following chart gives the growth in height in terms of percentage of full height of boys and girls with their respective ages. Draw the line graph of above data on the same sheet and answer the following questions. (a) In which year both the boys and the girls achieve their maximum height? (b) Who grows faster at puberty (14 years to 16 years of age)? by Maths experts to help you in doubts & scoring excellent marks in Class 8 exams.
Updated on:21/07/2023Topper's Solved these Questions
- INTRODUCTION TO GRAPHS BOOK - NCERT EXEMPLARCHAPTER - INTRODUCTION TO GRAPHS EXERCISE - THINK AND DISCUSS
4 Videos
- EXPONENTS AND POWERSBOOK - NCERT EXEMPLARCHAPTER - EXPONENTS AND POWERSEXERCISE - EXERCISE
195 Videos
- LINEAR EQUATIONS IN ONE VARIABLEBOOK - NCERT EXEMPLARCHAPTER - LINEAR EQUATIONS IN ONE VARIABLEEXERCISE - THINK AND DISCUSS
3 Videos
Similar Questions
The following chart gives the growth in height in terms of percentage of full height of boys and girls with their respective ages.

Draw the line graph of above data on the same sheet and answer the following questions.
(a) In which year both the boys and the girls achieve their maximum height?
(b) Who grows faster at puberty (14 years to 16 years of age)?
View SolutionHow does the height of boys and girl change during puberty ?
View Solution
Knowledge Check
The given double graph shows the average heights of boys and girls at specific ages. Which conclusion is supported by the graph ?
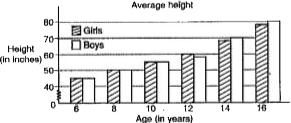 AGirls are taller than boys until the age of 14BGirls and boys grow the same amount each year.CAfter the ago of 14 , boys grow faster than girlsDBoys are always taller than girls
Refer the following data table and answer the question.
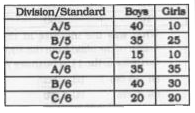
What is the ratio of boys to girls?A26:37B39:28C28:39D37:26Study the table and answer the questions.
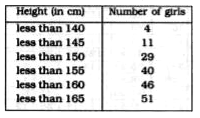
Average height (in cm) of the girls whose heights are 155cm and above is aboutA158.7B159.8C160.4D162.6
Read the following graph carefully and answer the questions given below:
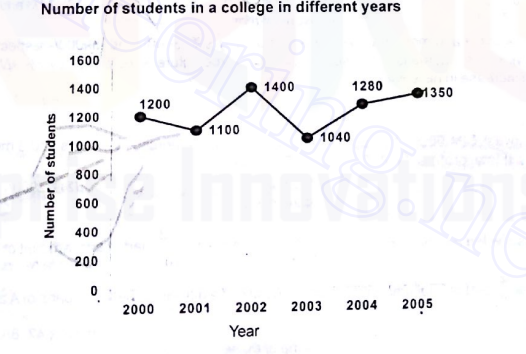
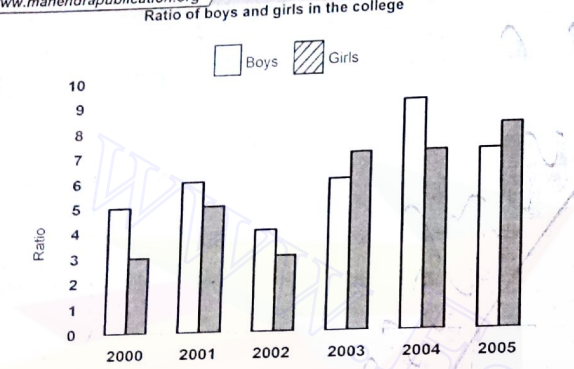
In which two years the number of girls is equal ?
View SolutionThe table below shows the data on likely heights of boys and girls as they grow in age. Draw graphs of height and age for both boys and girls on the same graph paper. What conclusions can be drawn from these graphs?
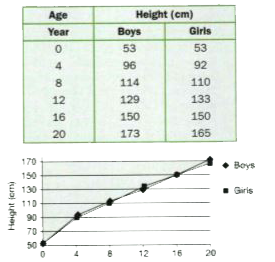
View SolutionRead the following graph carefully and answer the questions given below:


What is the difference between the number of boys and girls in the year 2004 ?
View SolutionStudy the following graph carefully and answer the questions that follow
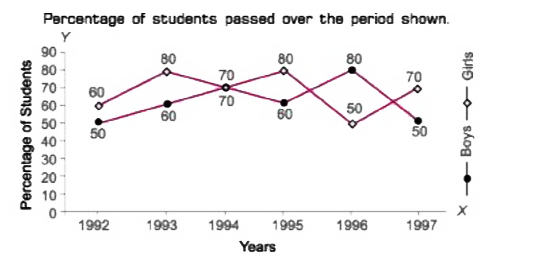
In which of the following years was the improvement of girls maximum as compared to that of previous years ?
View SolutionStudy the following graph and answer the questions given below -----
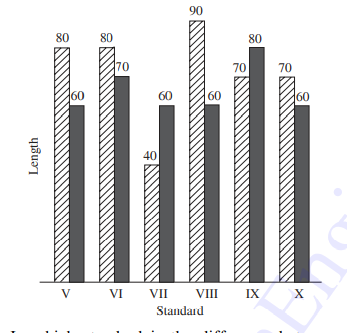
In which standard is the difference between the results of girls and boys maximum ?
View Solution
