The following graph shows the number of people present at a certain shop at different times. Observe the graph and answer the following questions.
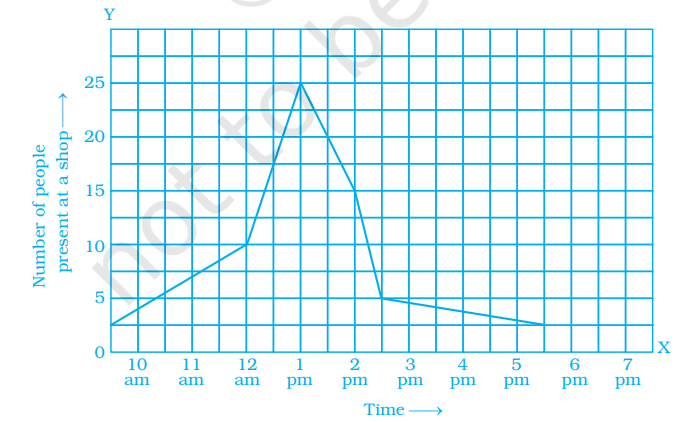
(a) What type of a graph is this?
(b) What information does the graph give?
(c) What is the busiest time of day at the shop?
(d) How many people enter the shop when it opens?
(e) About how many people are there in the shop at 1:30 pm?
Step by step video & image solution for The following graph shows the number of people present at a certain shop at different times. Observe the graph and answer the following questions. (a) What type of a graph is this? (b) What information does the graph give? (c) What is the busiest time of day at the shop? (d) How many people enter the shop when it opens? (e) About how many people are there in the shop at 1:30 pm? by Maths experts to help you in doubts & scoring excellent marks in Class 8 exams.
Updated on:21/07/2023Topper's Solved these Questions
- INTRODUCTION TO GRAPHS BOOK - NCERT EXEMPLARCHAPTER - INTRODUCTION TO GRAPHS EXERCISE - THINK AND DISCUSS
4 Videos
- EXPONENTS AND POWERSBOOK - NCERT EXEMPLARCHAPTER - EXPONENTS AND POWERSEXERCISE - EXERCISE
195 Videos
- LINEAR EQUATIONS IN ONE VARIABLEBOOK - NCERT EXEMPLARCHAPTER - LINEAR EQUATIONS IN ONE VARIABLEEXERCISE - THINK AND DISCUSS
3 Videos
Similar Questions
Observe the graph and answer the following questions.
The information given by the graph is:
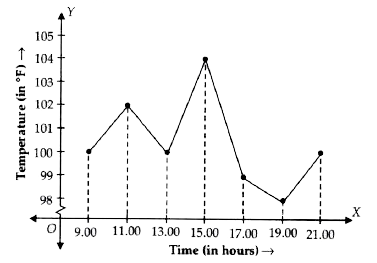
View SolutionRead the graph and answer the following questions
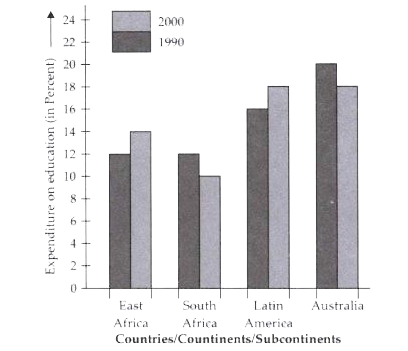
Give a suitable title to bar graph
View SolutionRead the bar graph and answer the following questons.
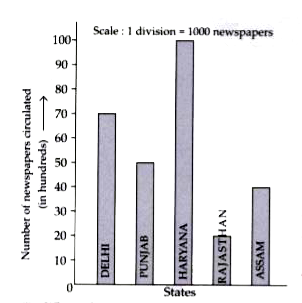
What information is given by graph ?
View SolutionObserve the bar graph and answer the following questions.
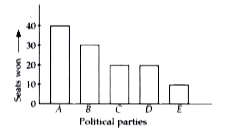
What is the total number of seats won by party A and party B?
View SolutionRead the graph and answer the following questions
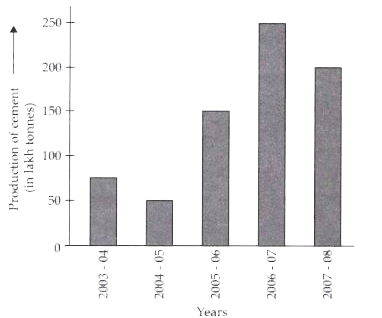
What information is conveyed by the bar graph
View SolutionRead the bar graph shown in figure and answer the following questions.
What is the information given by the bar graph?
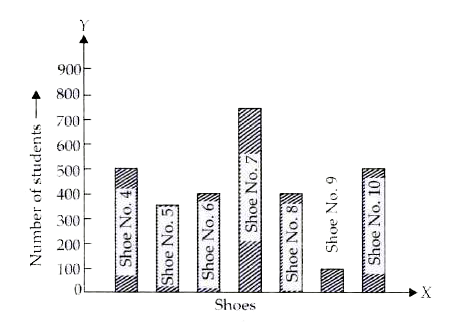
View SolutionThe figure shows position time graph of two riders C and D. Based on the information represented by the graph, answer the following questions.
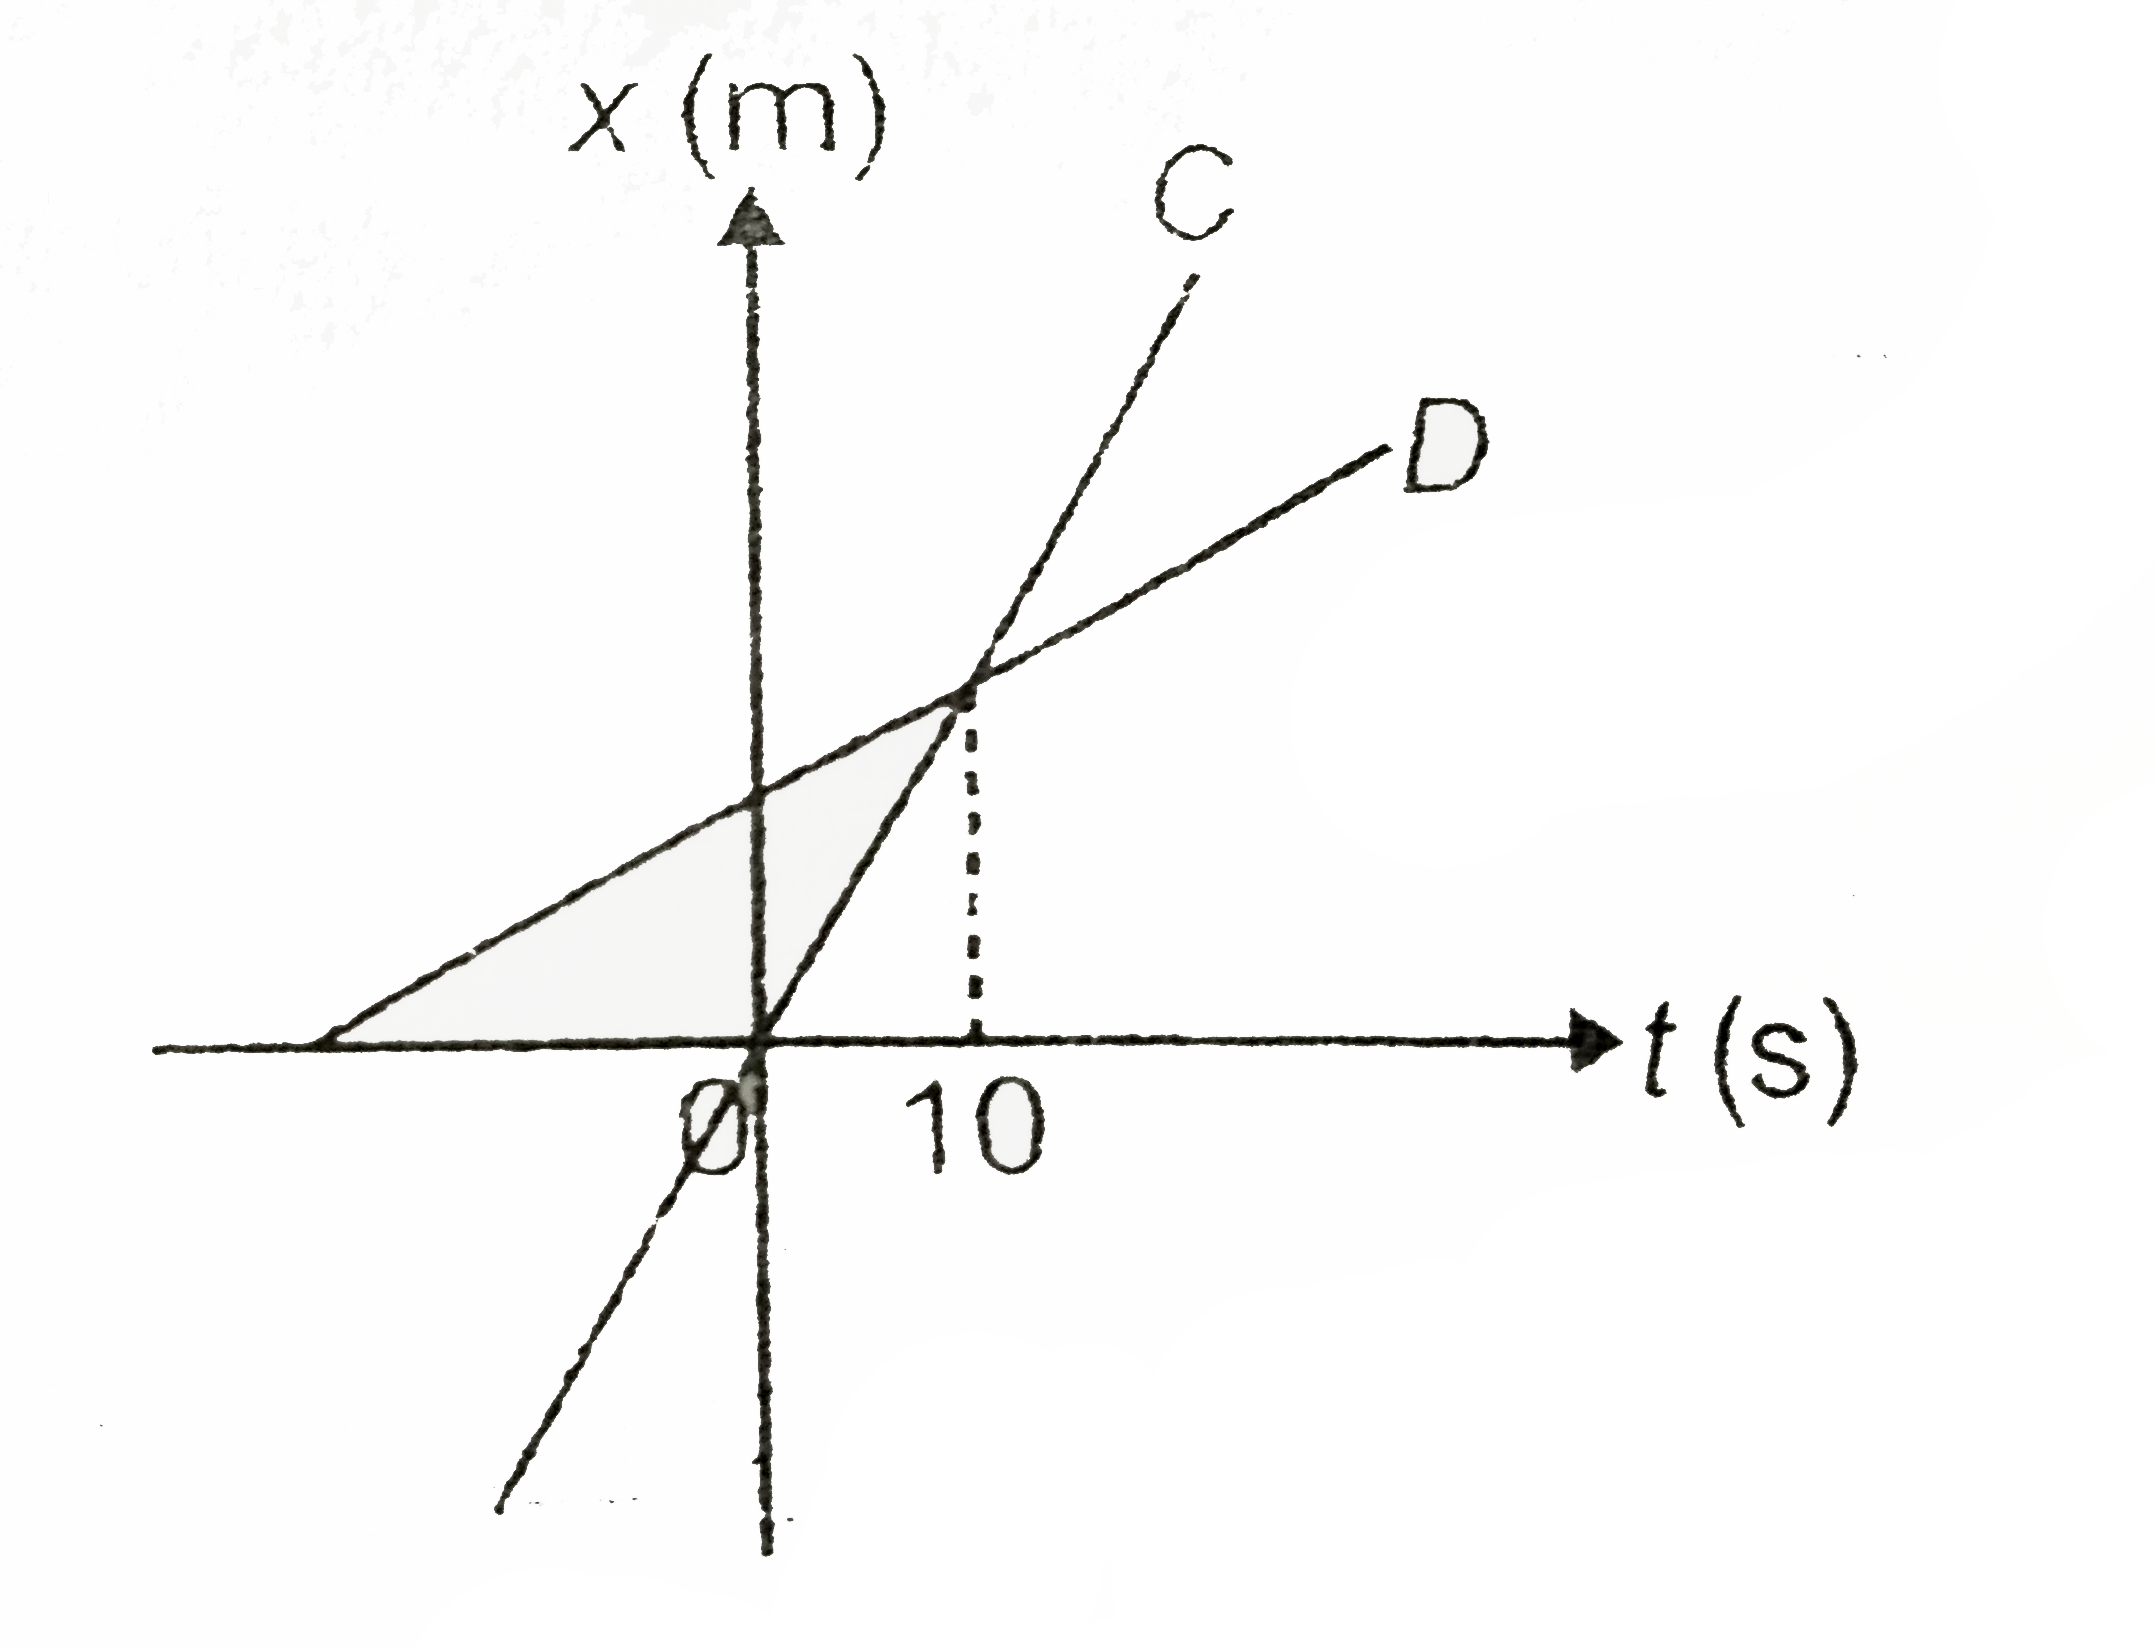
At t = 0 s
View SolutionThe figure shows position time graph of two riders C and D. Based on the information represented by the graph, answer the following questions.
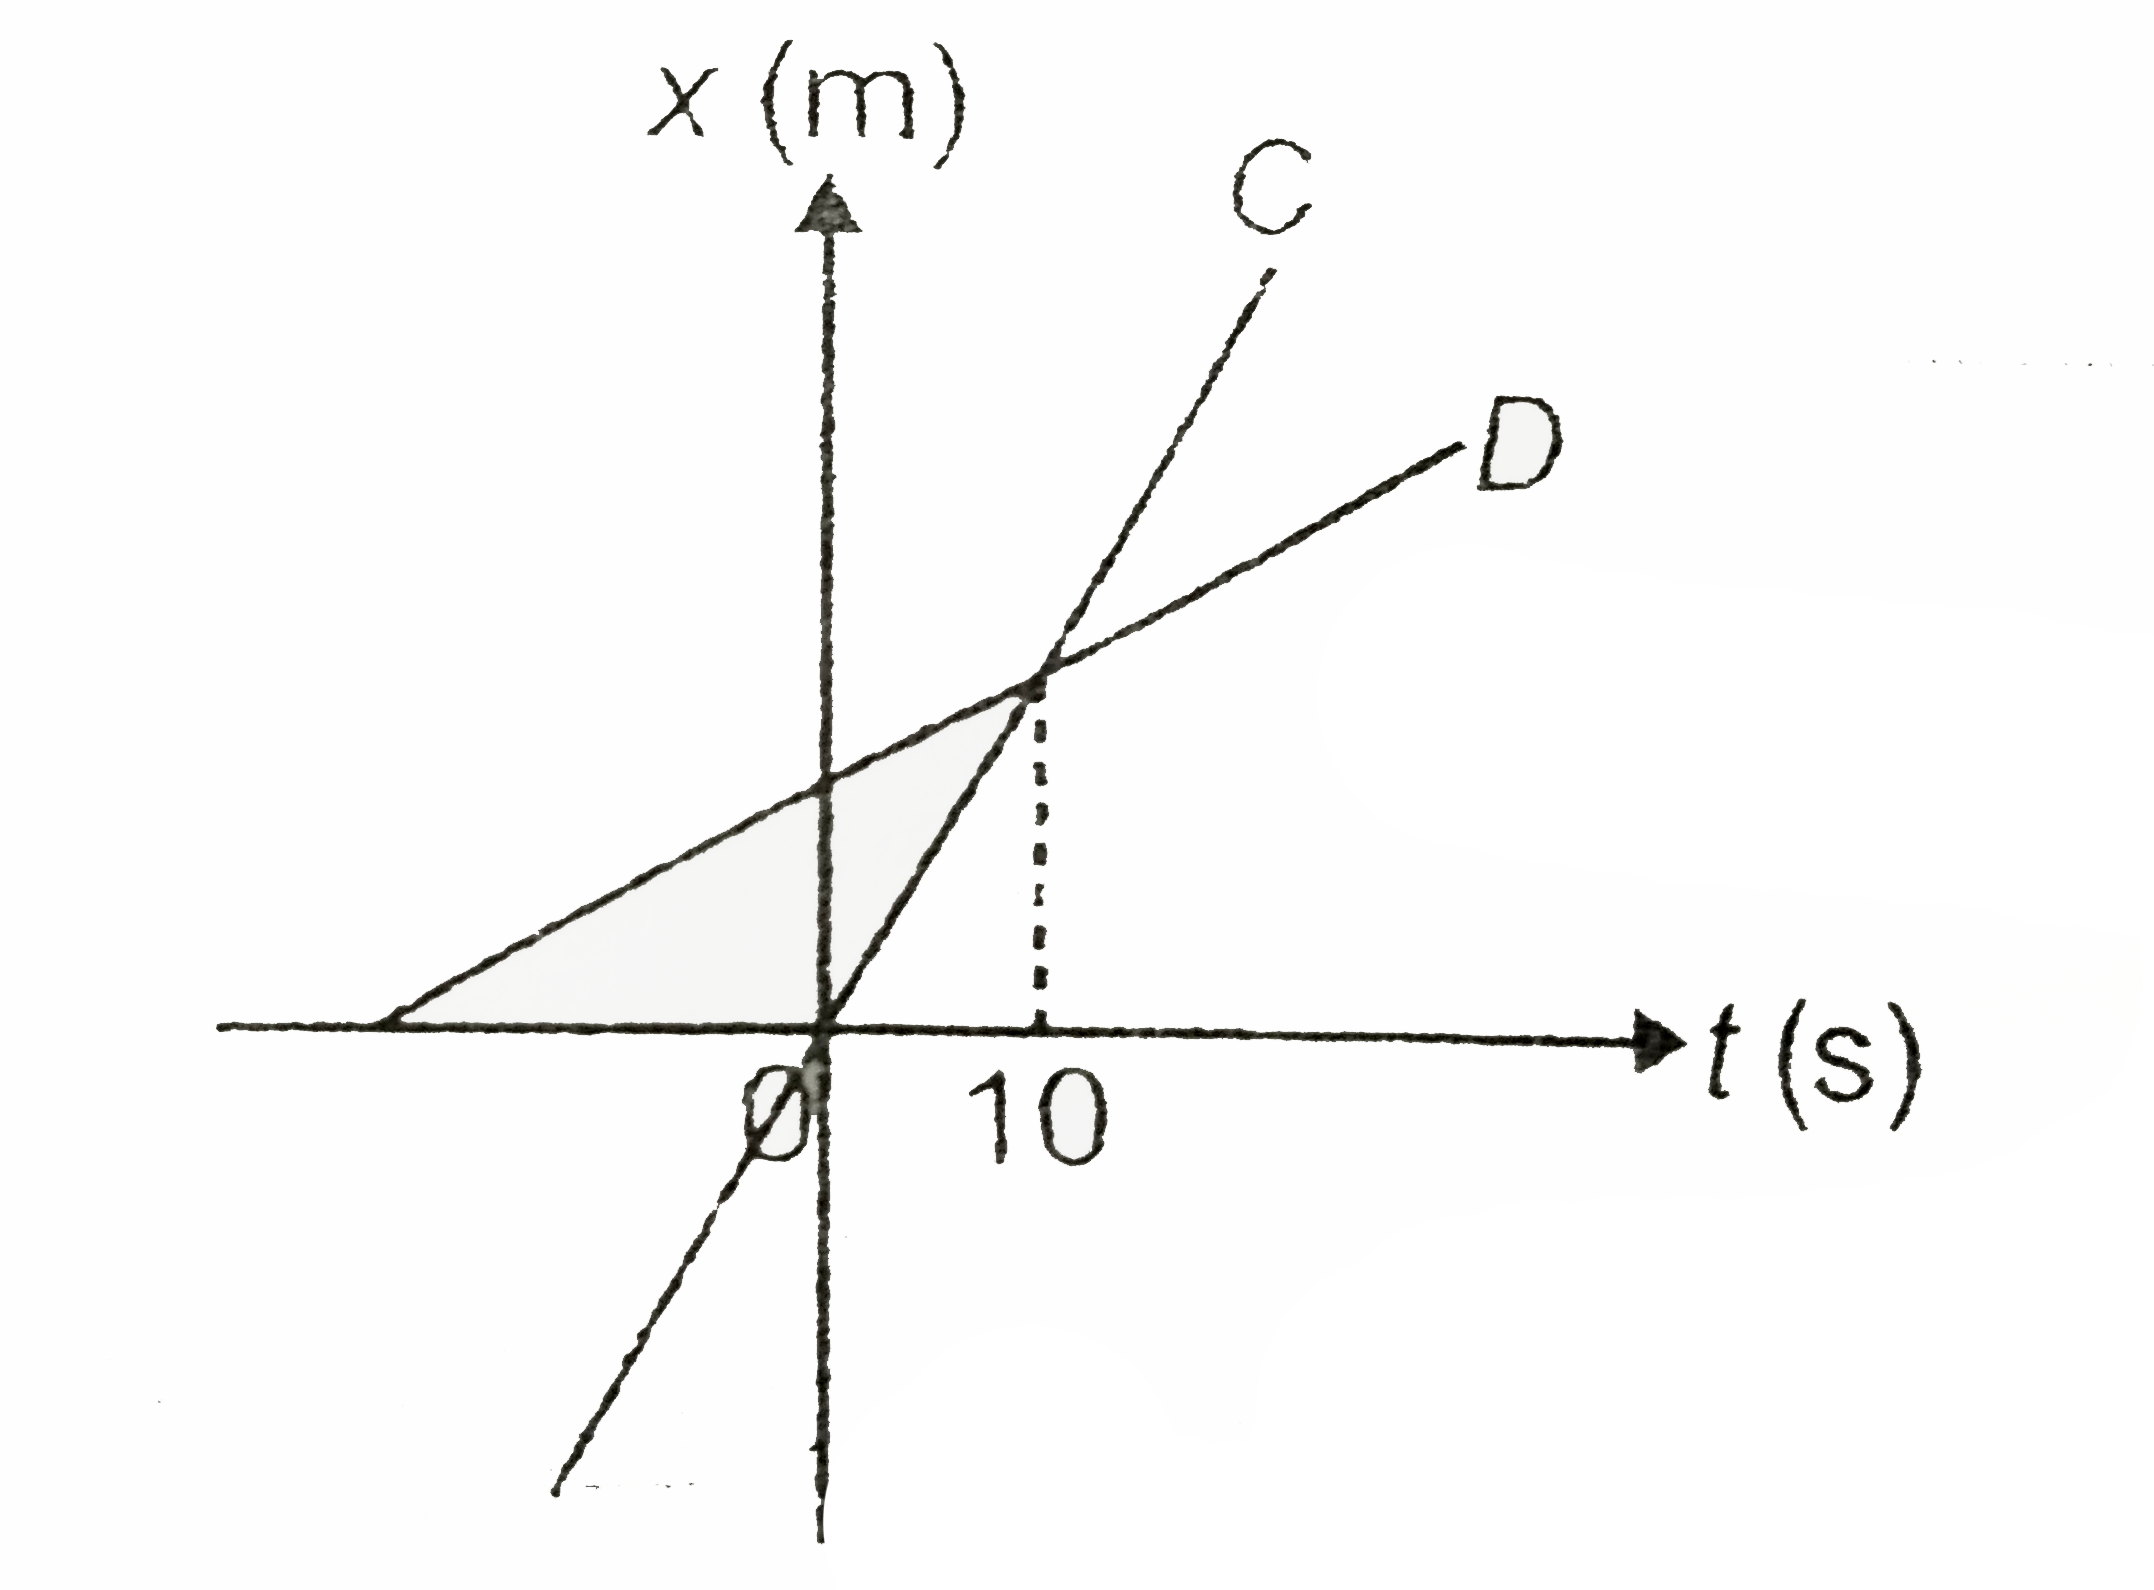
At t = 0 s
View SolutionThe figure shows position time graph of two riders C and D. Based on the information represented by the graph, answer the following questions.
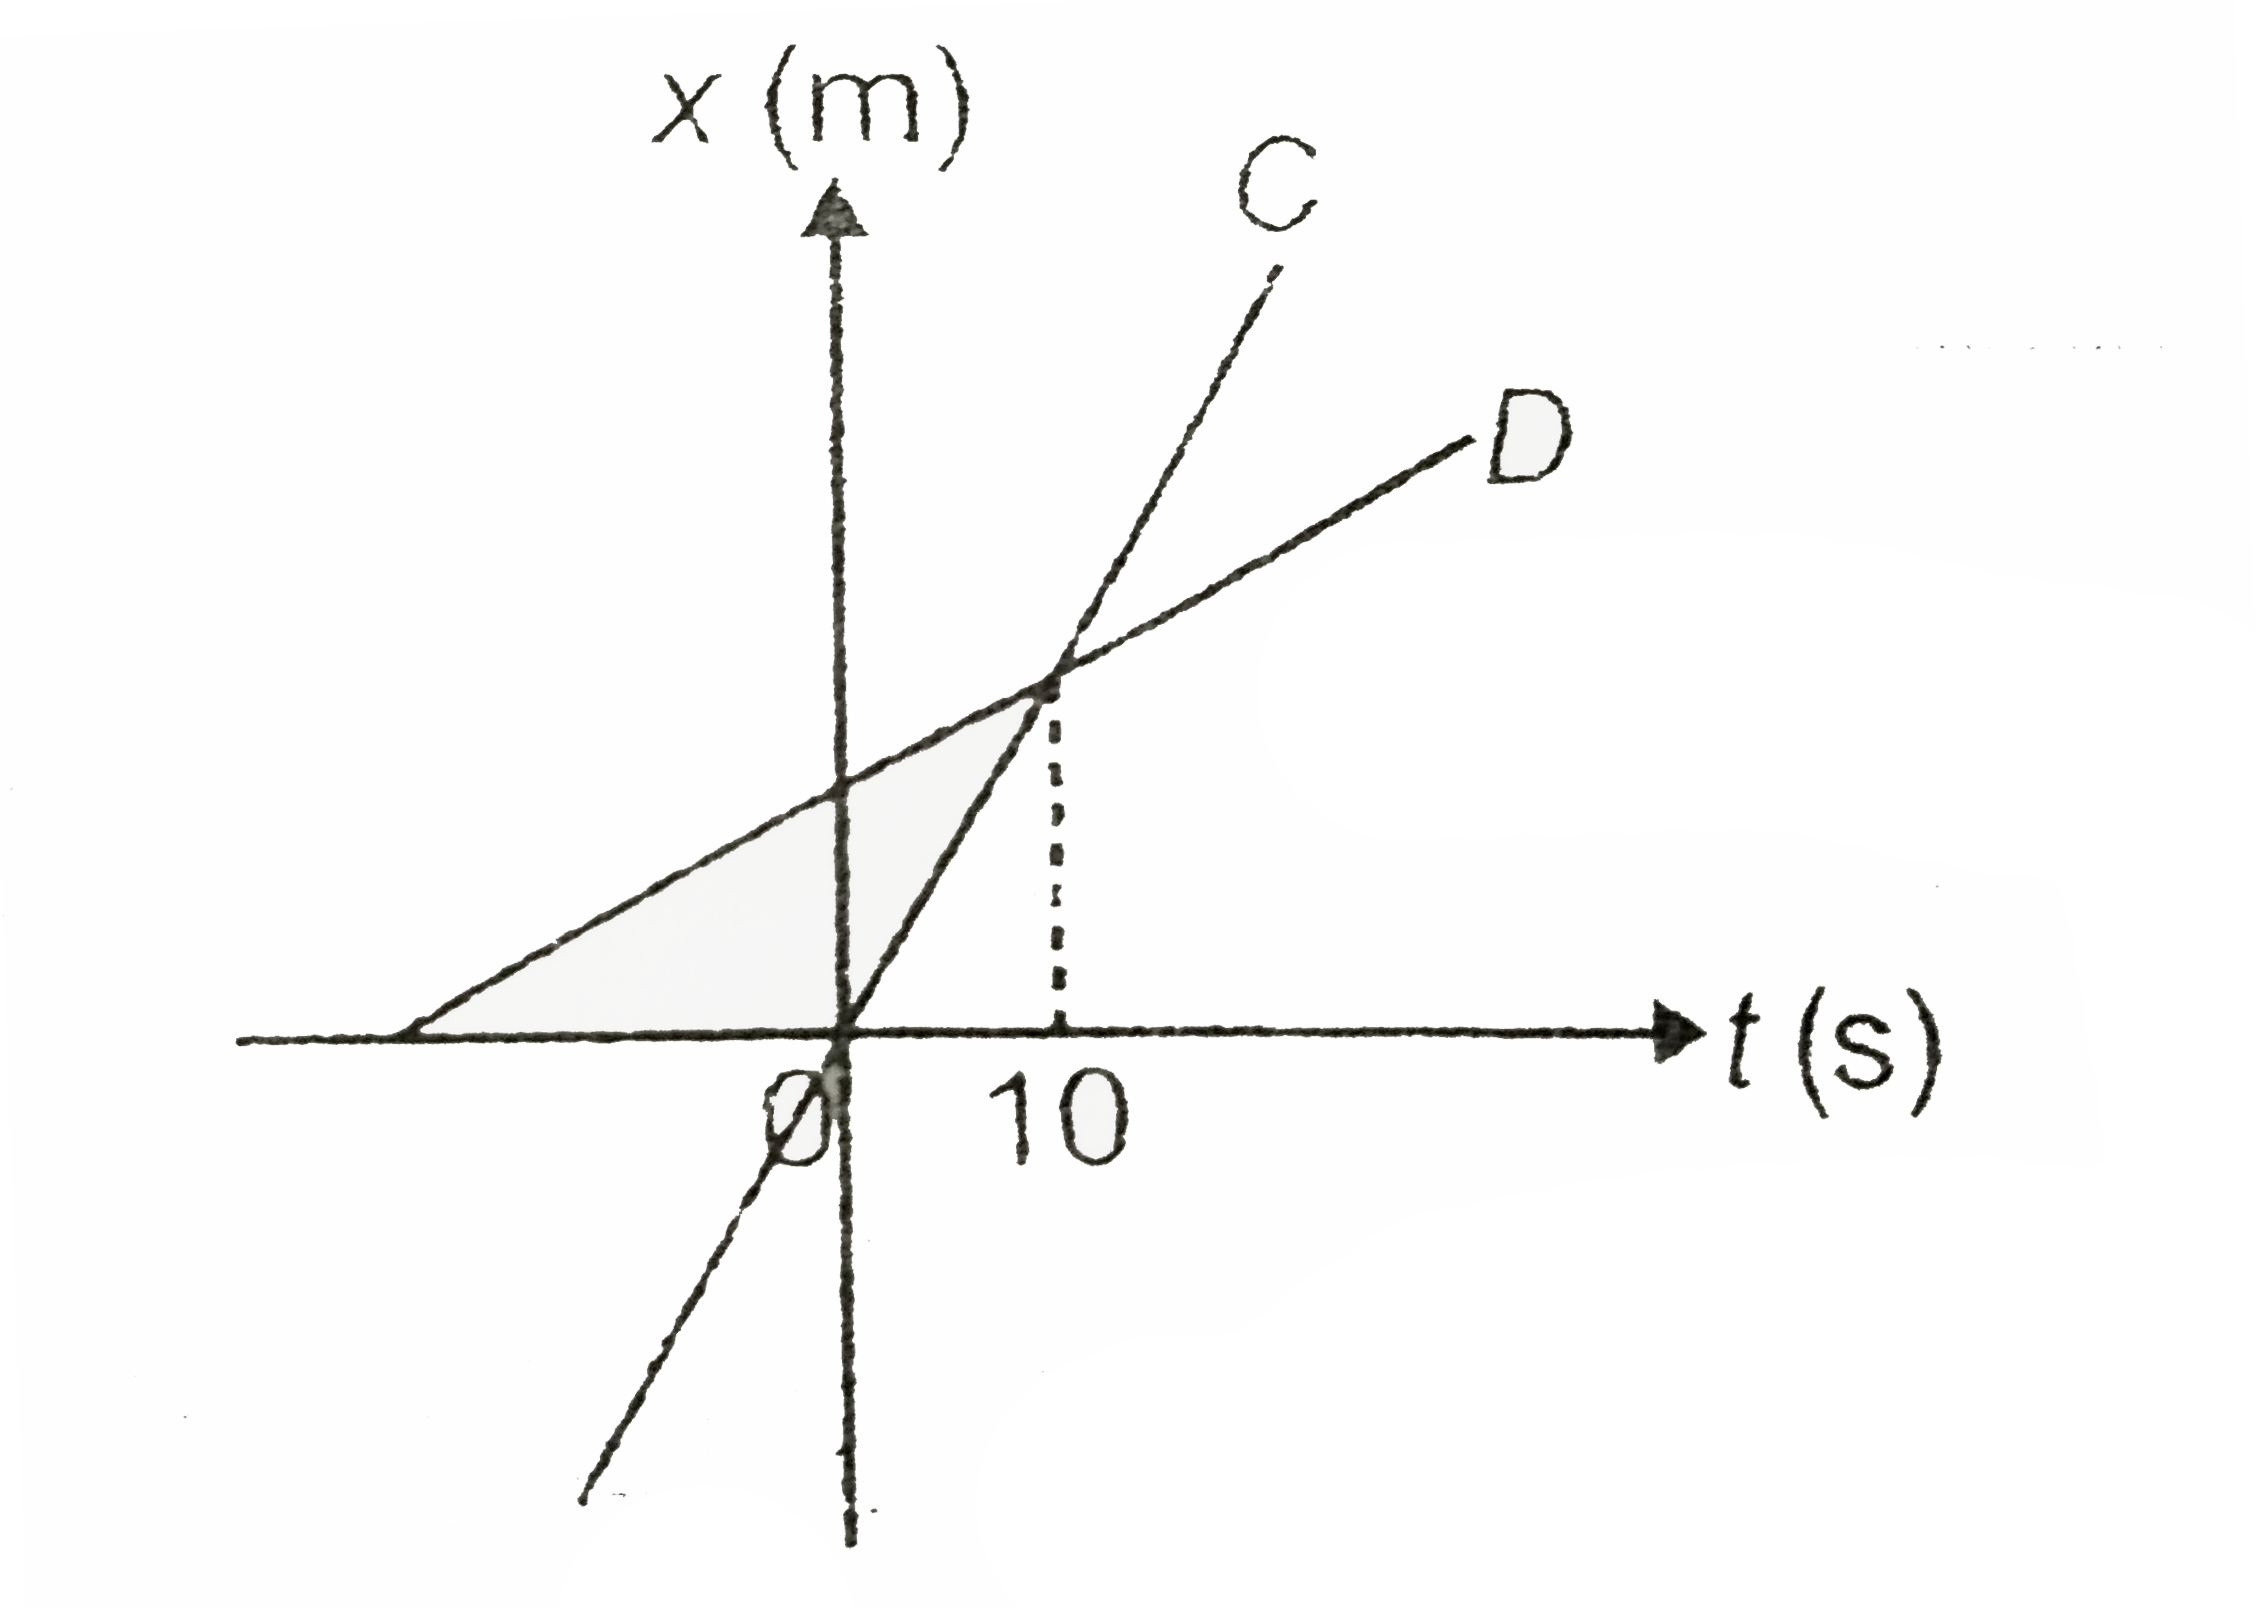
At t = 0 s
View SolutionThe following bar graph shows the number of houses (out of 100) in a town using different types of fuels for cooking.
Read the bar graph and answer the following questions:
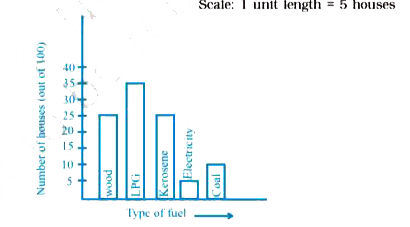
How many houses are using coal as fuel?
View Solution
