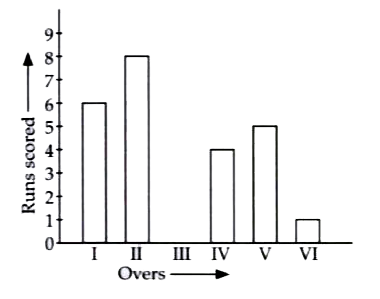
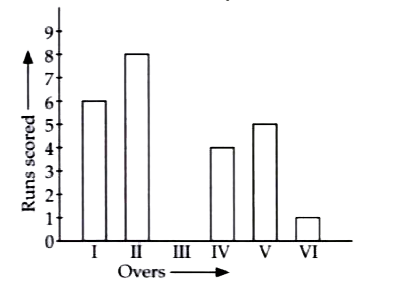
The bar-graph given below shows the runs scored in six overs by a batsman.
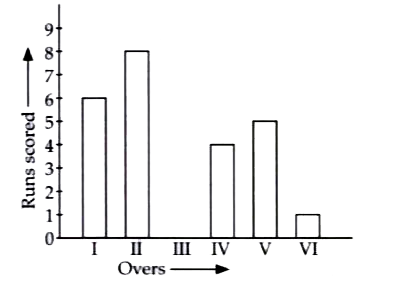
How many overs were there in which less than 3 runs were scored?
Step by step video & image solution for The bar-graph given below shows the runs scored in six overs by a batsman. How many overs were there in which less than 3 runs were scored? by Maths experts to help you in doubts & scoring excellent marks in Class 6 exams.
Topper's Solved these Questions
- BOOK - MTG IIT JEE FOUNDATIONCHAPTER - DATA HANDLING EXERCISE - Exercise (Multiple Choice Questions) Level -216videos
DATA HANDLING
- BOOK - MTG IIT JEE FOUNDATIONCHAPTER - DATA HANDLING EXERCISE - Exercise (Match the following)2videos
DATA HANDLING
- BOOK - MTG IIT JEE FOUNDATIONCHAPTER - DATA HANDLING EXERCISE - NCERT Section (Exercise 9.4)4videos
DATA HANDLING
- BOOK - MTG IIT JEE FOUNDATIONCHAPTER - BASIC GEOMETRICAL IDEASEXERCISE - OLYMPIAD/HOTS CORNER10videos
BASIC GEOMETRICAL IDEAS
- BOOK - MTG IIT JEE FOUNDATIONCHAPTER - DECIMALSEXERCISE - OLYMPIAD/HOTS CORNER20videos
DECIMALS
Similar Questions
Knowledge Check
- Question 1 - Select One
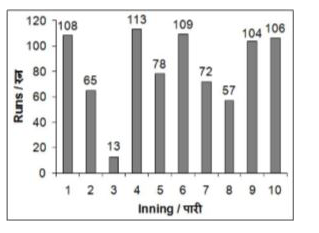
The bar chart given below showsthe runs scored by a batsman in 10different innings
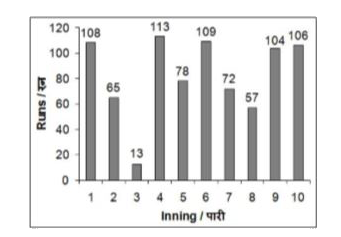
What are the average runs per innings?Aa .78.5Bb. 82.5Cc. 80.6Dd. 85 - Question 2 - Select One
The bar chart given below shwos the runs scored by a bastsman in 10 different innings
Runs scored in inning 1 is what percent of runs scored in inning 5?Aa. 131.29%Bb. 138.46%Cc. 126.17%Dd. 142.93% - Question 3 - Select One
The bar chart given below shows the runs scored by a batsman in 10 different images
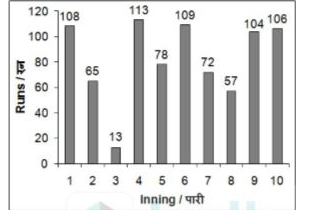
In how many innings has the batsman scored more than the average runs?Aa. 5Bb. 7Cc. 6Dd. 8
The given bar graph presents the runs scored and strike rate of a batsman in five matches , Strike rate is the number of runs scored per 100 balls faced. The strike rate is taken on record only when the batsmen scores at least 30 runs in a match
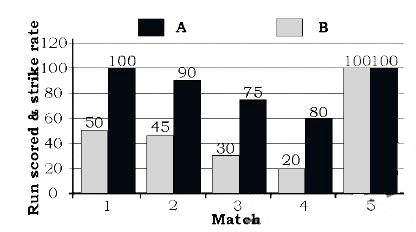
What is the average strike rate of the batsmanView SolutionThe table given below shows the runs scored by 5 players in four matches .
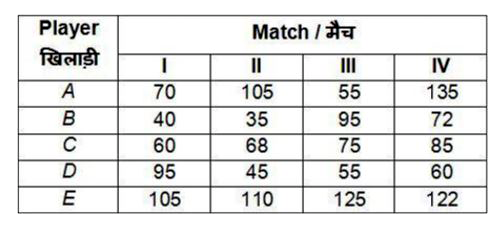
Runs scored by A in match II is what percent of the total runs scored by these five players in match II?View SolutionThe given pie chart shows the runs scored by 5 players in a match.
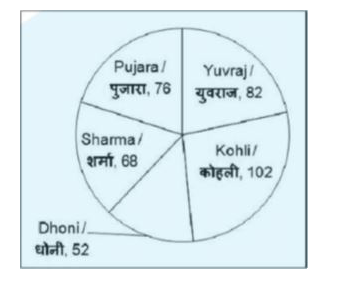
The runs scored by Kohli are how much percent more than the runs scored by Sharma ?View SolutionThe given pie-chart shows the runs scored by 5 players in a match.
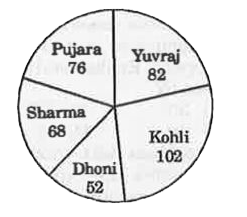
The runs scored by Kohli are how much per cent more than the runs scored by Sharma?View SolutionThe given pie-chart shows the runs scored by 5 players in a match.
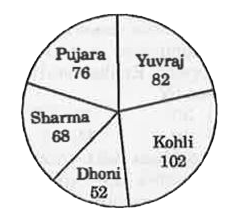
Runs scored by Kohli is what per cent of runs scored by Yuvraj?View Solution

