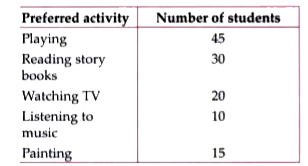
A survey of 120 school students was done to find which activity they prefer to do in their free time.

Draw a bar graph to illustrate the above data taking scale of 1 unit length = 5 students.
Step by step video & image solution for A survey of 120 school students was done to find which activity they prefer to do in their free time. Draw a bar graph to illustrate the above data taking scale of 1 unit length = 5 students. by Maths experts to help you in doubts & scoring excellent marks in Class 6 exams.
Updated on:21/07/2023Topper's Solved these Questions
- DATA HANDLING BOOK - MTG IIT JEE FOUNDATIONCHAPTER - DATA HANDLING EXERCISE - Exercise (Multiple Choice Questions) Level -1
35 Videos
- DATA HANDLING BOOK - MTG IIT JEE FOUNDATIONCHAPTER - DATA HANDLING EXERCISE - Exercise (Multiple Choice Questions) Level -2
16 Videos
- DATA HANDLING BOOK - MTG IIT JEE FOUNDATIONCHAPTER - DATA HANDLING EXERCISE - NCERT Section (Exercise 9.3)
11 Videos
- BASIC GEOMETRICAL IDEASBOOK - MTG IIT JEE FOUNDATIONCHAPTER - BASIC GEOMETRICAL IDEASEXERCISE - OLYMPIAD/HOTS CORNER
10 Videos
- DECIMALSBOOK - MTG IIT JEE FOUNDATIONCHAPTER - DECIMALSEXERCISE - OLYMPIAD/HOTS CORNER
20 Videos
Similar Questions
Given below is the data of school going students (boys and girls):

Draw the bar graph to represent the above data.
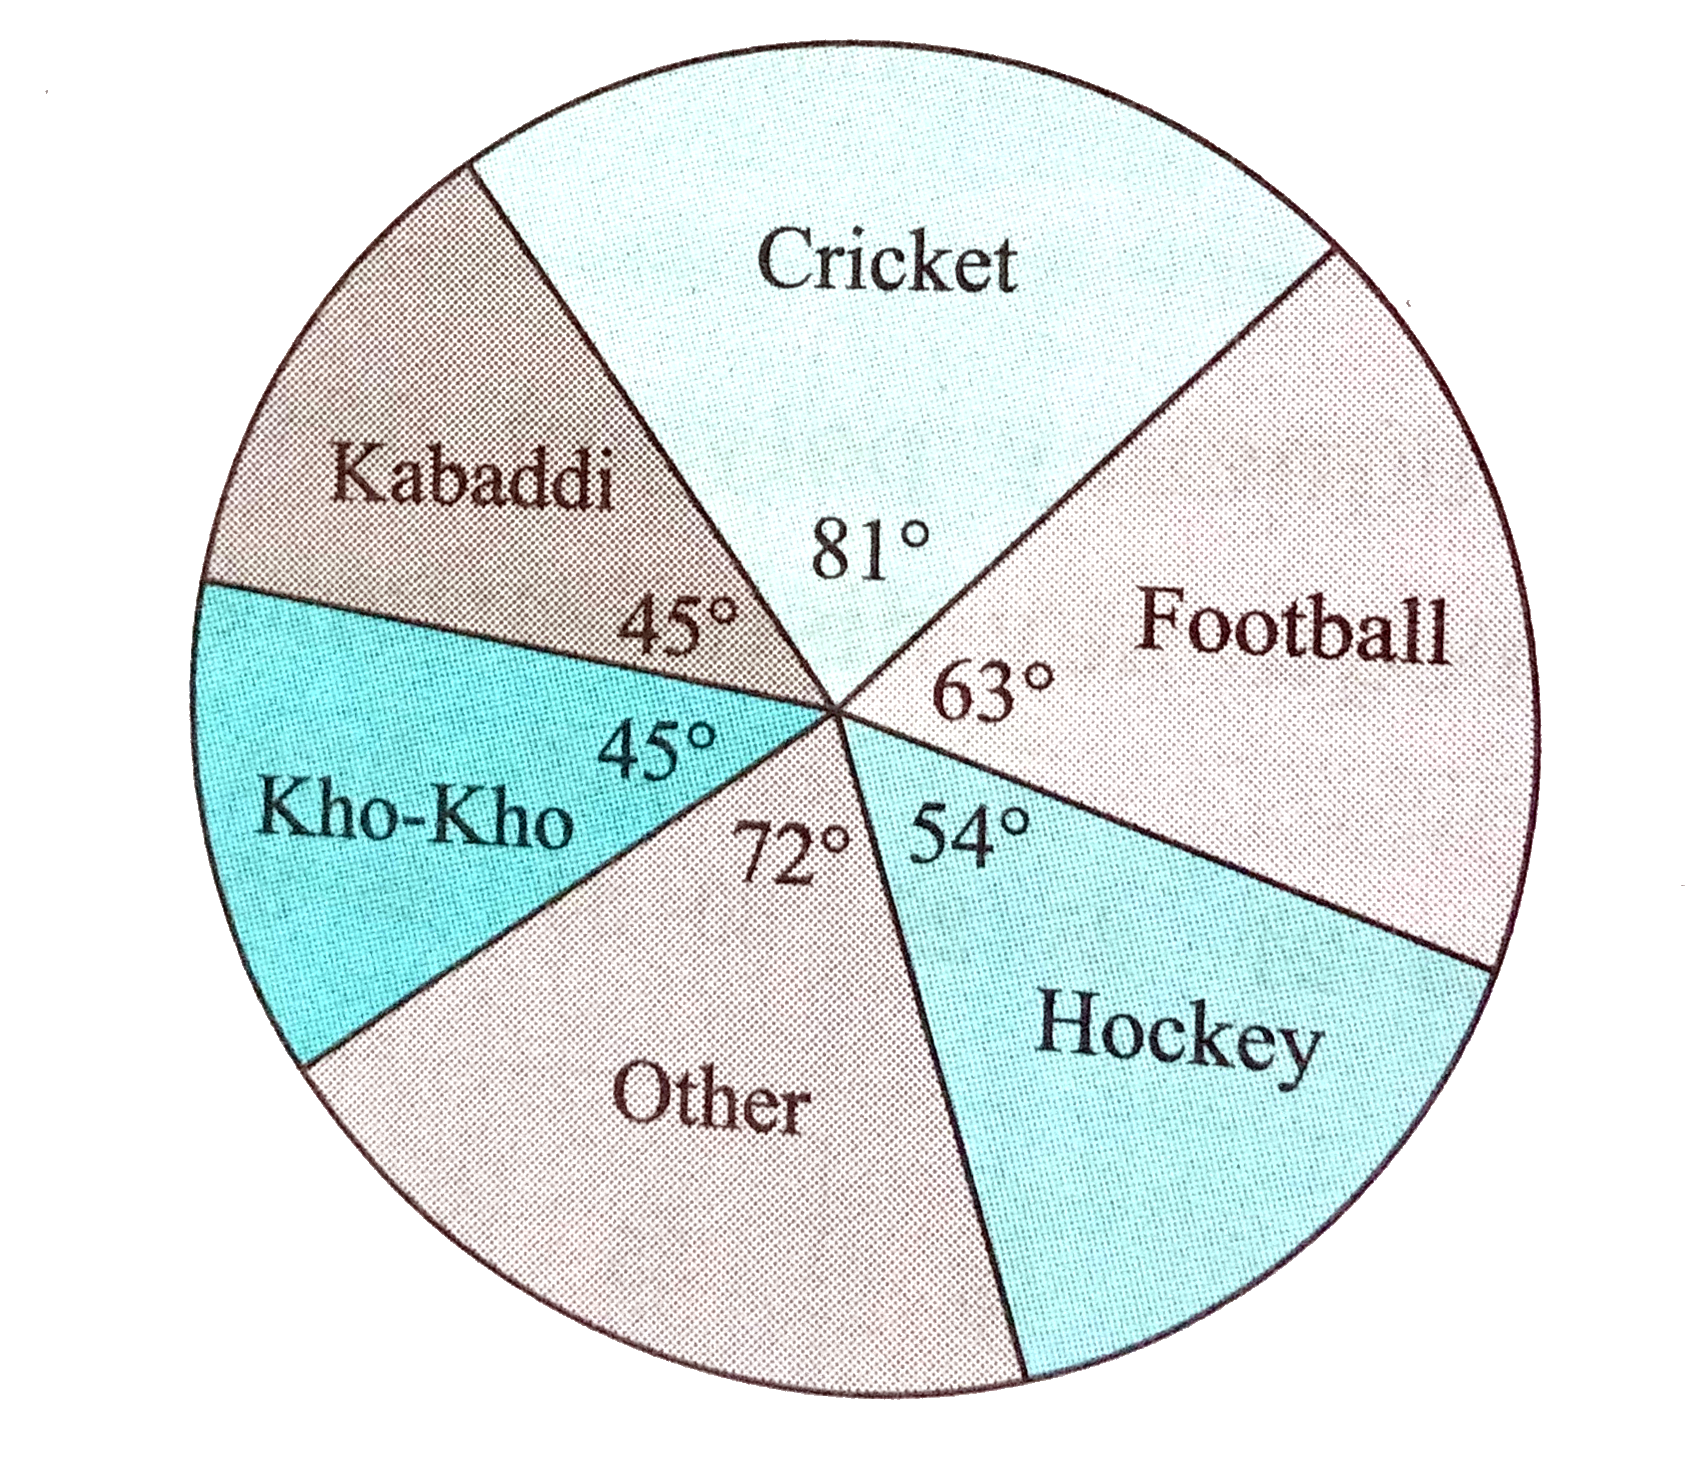
View SolutionA survey of students was made to know which game they like. The data obtained in the survey is presented in the following pie diagram. If the total number of students are 1000,

(1) how many students like cricket ?
(2) how many studetns like football ?
(3) how many students prefer other games ?
View Solution
Knowledge Check
There are total 200 students in a schooL of which 15 a are boys . Find the number of girls in the school
A160B16C140D40
Number of persons in various age groups in a town is given in the following tableDraw a bar graph to represent the above information and answer the following questions. (take 1 unit length = 20 thousands)(a) Which two age groups have same population?(b) All persons in the age group of 60 and above are called senior citizens. How many senior citizens are there in the town?
View Solution70 students from a locality use different modes of transport to go to school as given below:

Draw the bar graph representing the above data.
View Solution70 students from a locality use different modes of transport to go to school as given below:
 Draw the bar graph representing the above data.
View SolutionThe table below gives the data of tourists visiting 5 hill stations over two consecutive years. Study the table and answer the questions that follow:

(a) Draw a double bar graph to depict the above information using appropriate scale.
(b) Which hill station was visited by the maximum number of tourists in 2008?
(c) Which hill station was visited by the least number of tourists in 2009?
(d) In which hill stations was there increase in number of tourists in the year 2009?
View SolutionThe following data shows the number of students who attended the school on weekdays. Draw a bar graph to represent information by using appropriate scale.

View SolutionOn a particular day in a school, the attendance in each of the classes from VI to X has been recorded as under
Draw a double bar graph, choosing an appropriate scale. Using the bar graph, answer the questions given below

(i) Which class has the maximum number of students (ii) Find the ratio of number of students present to the total number of students in Class VII. (iii) What percent of Class IX students were absent
View SolutionThe students of Class VII have to choose one club from Music, Dance, Yoga, Dramatics, Fine arts and Electronics clubs. The data given below shows the choices made by girls and boys of the class. Study the table and answer the questions that follow:

(a) Draw a double bar graph using appropriate scale to depict the above data.
(b) How many students are there in Class VII?
(c) Which is the most preferred club by boys?
(d) Which is the least preferred club by girls?
(e) For which club the difference between boys and girls is the least?
(f) For which club is the difference between boys and girls the maximum?
View Solution
