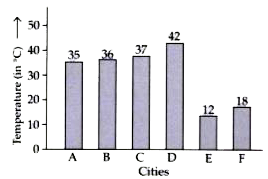
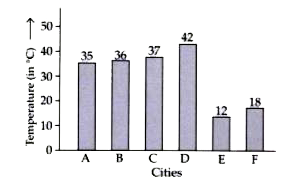
The bar graph shows the temperatures in 6 cities.
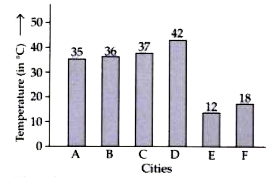
If a place with temperature equal to or above is considered to be hot, then the number of cold places is
1
2
4
3
The correct Answer is:B
Step by step video & image solution for The bar graph shows the temperatures in 6 cities. If a place with temperature equal to or above 35^(@)C is considered to be hot, then the number of cold places is by Maths experts to help you in doubts & scoring excellent marks in Class 6 exams.
Updated on:21/07/2023Topper's Solved these Questions
- DATA HANDLING BOOK - MTG IIT JEE FOUNDATIONCHAPTER - DATA HANDLING EXERCISE - Exercise (Multiple Choice Questions) Level -2
16 Videos
- DATA HANDLING BOOK - MTG IIT JEE FOUNDATIONCHAPTER - DATA HANDLING EXERCISE - Exercise (Match the following)
2 Videos
- DATA HANDLING BOOK - MTG IIT JEE FOUNDATIONCHAPTER - DATA HANDLING EXERCISE - NCERT Section (Exercise 9.4)
4 Videos
- BASIC GEOMETRICAL IDEASBOOK - MTG IIT JEE FOUNDATIONCHAPTER - BASIC GEOMETRICAL IDEASEXERCISE - OLYMPIAD/HOTS CORNER
10 Videos
- DECIMALSBOOK - MTG IIT JEE FOUNDATIONCHAPTER - DECIMALSEXERCISE - OLYMPIAD/HOTS CORNER
20 Videos
Similar Questions
Knowledge Check
If the temperature is increased (above 35∘C)
ARate of decline of respiration will be earlier than decline of photosynthesisBRate of decline of phosoynthesis will be earlier than decline of respirationCBoth decline simultaneouslyDBoth do not show any fixed patternIt the temperature is increased above 35∘C,
ARate of decline of respiration will be earlier than decline of photosynthesisBRate of decline of phosynthesis will be earlier than decline of respirationCBoth decline simultaneouslyDBoth do not show any fixed patternAt a temperature above 35∘C
Arate of photsynthesis will decline earlier than that of respirationBrate of respiration will decline earlier than that of photosynthesisCboth decline simultaneouslyDthere is no fixed pattern
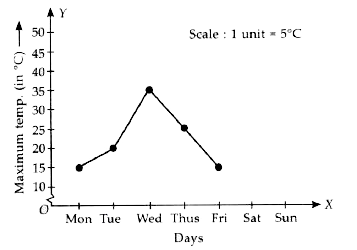
The graph given below shows the maximum temperature during the last week of April. The maximum temperature 35∘ C was on ___
View SolutionThe line graph shows the temperature on four sundays of three cities
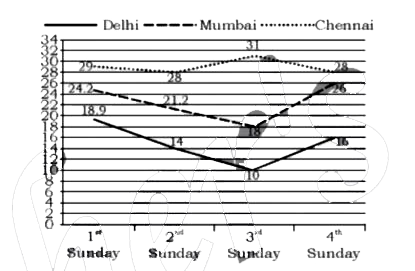
In the given graph when was the maximum temperature recorded in delhi
View SolutionThe line graph shows the temperature on four Sundays of three cities.
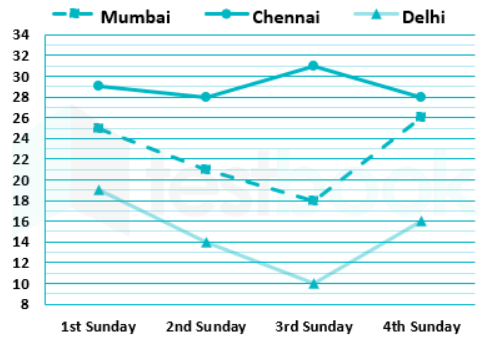
In the given line graph. what was the average temperature on the 1st Sunday in all the three cities? (rounded to first decimal)
View SolutionThe line graph shows the temperature on four Sundays of three cities
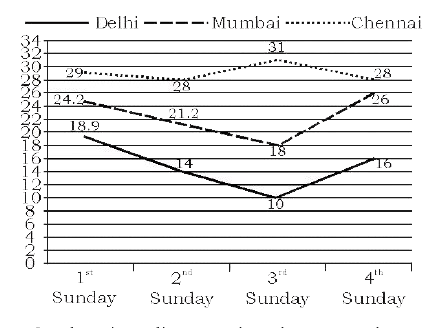 In the given line graph , when was the maximum temperature recorded in Chennai
View SolutionThe line graph shows the temperature on four Sundays of three cities.
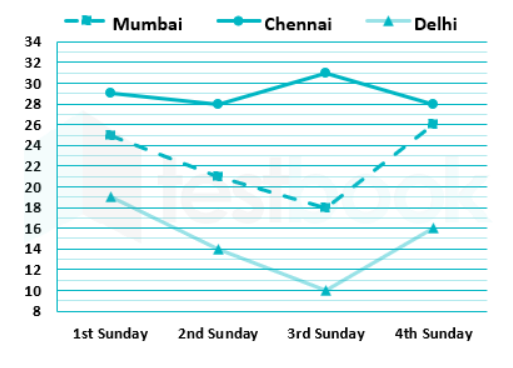
In the given line graph, when was the maximum temperature recorded in Delhi?
View Solution

