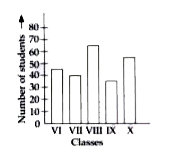
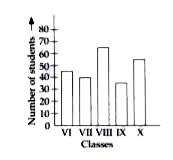
The given bar graph, shows the number of students in different classes.
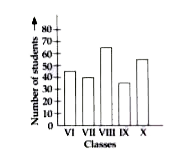
Arrange the classes in descending order of student population.
VIII, VI, VII, IX, X
VIII, VII, VI, X, IX
VIII, X, VI, VII, IX
IX, VII, VI, X, VIII
The correct Answer is:C
Step by step video & image solution for The given bar graph, shows the number of students in different classes. Arrange the classes in descending order of student population. by Maths experts to help you in doubts & scoring excellent marks in Class 6 exams.
Updated on:21/07/2023Topper's Solved these Questions
- DATA HANDLING BOOK - MTG IIT JEE FOUNDATIONCHAPTER - DATA HANDLING EXERCISE - Exercise (Multiple Choice Questions) Level -2
16 Videos
- DATA HANDLING BOOK - MTG IIT JEE FOUNDATIONCHAPTER - DATA HANDLING EXERCISE - Exercise (Match the following)
2 Videos
- DATA HANDLING BOOK - MTG IIT JEE FOUNDATIONCHAPTER - DATA HANDLING EXERCISE - NCERT Section (Exercise 9.4)
4 Videos
- BASIC GEOMETRICAL IDEASBOOK - MTG IIT JEE FOUNDATIONCHAPTER - BASIC GEOMETRICAL IDEASEXERCISE - OLYMPIAD/HOTS CORNER
10 Videos
- DECIMALSBOOK - MTG IIT JEE FOUNDATIONCHAPTER - DECIMALSEXERCISE - OLYMPIAD/HOTS CORNER
20 Videos
Similar Questions
Knowledge Check
The following bar graph shows the number of students in a particular class of school. Then, answer the following questions.
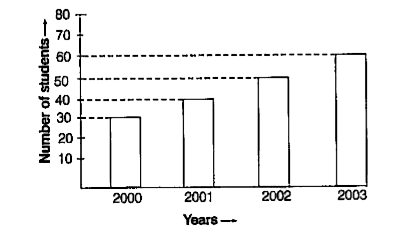
Is the number of students in the year 2002 is twice that in the year 2000?AYesBNoCCannot sayDNone of theseDirection: Study the graph and answer the following question. The graph shows the total number of boys and girls in different classes of a school.
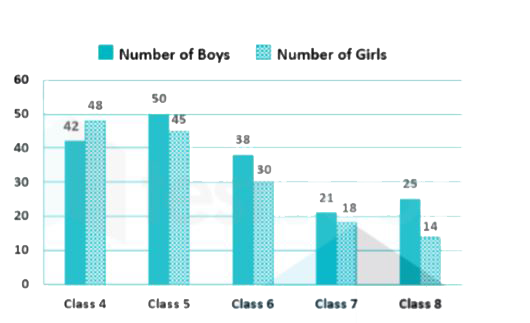
What is the ratio between total number of students in class 4 and number of boys in Class 6 and 7 together?A59:90B59:70C90:59D90:49The Pie-graph given here shows the number of students opting different subjects in a school. If there are a total of 720 students, then by studying the pie-graph answer the questions.
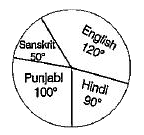
The difference in the number of students studying Hindi and Sanskrit subjects isA40B80C120D140
The following bar graph shows the number of students in different classes of a school.
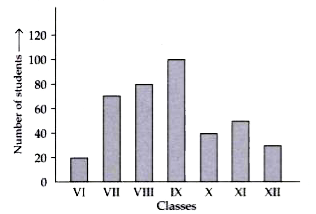
How many more students are there in Class IX than in Class VIII ?
View SolutionThe following table shows the number of students in different classes of a high school. Draw a histogram to represent the given data.
ClassesVIVIIVIIIIXXNumber of students3742355048
View SolutionThe following bar graph shows the number of students in a particular class of school. Then, answer the following questions.
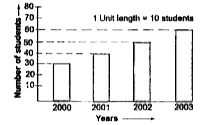
What is the number of students in the year 2003?
View SolutionThe distribution given below show the marks of 100 students of a class:
then find Ogive medium of data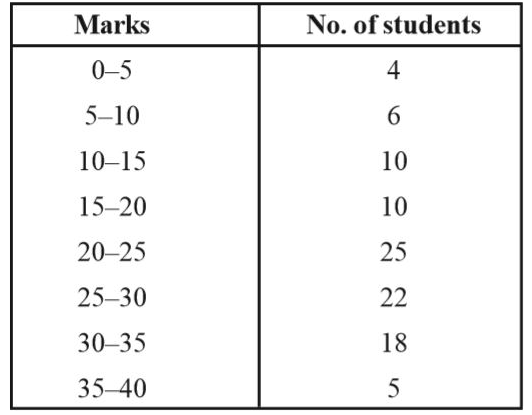
View SolutionThe following bar graph shows the number of students in a particular class of school. Then, answer the following questions.
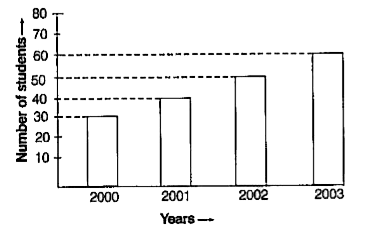
What is the number of students in the year 2003?
View Solution

