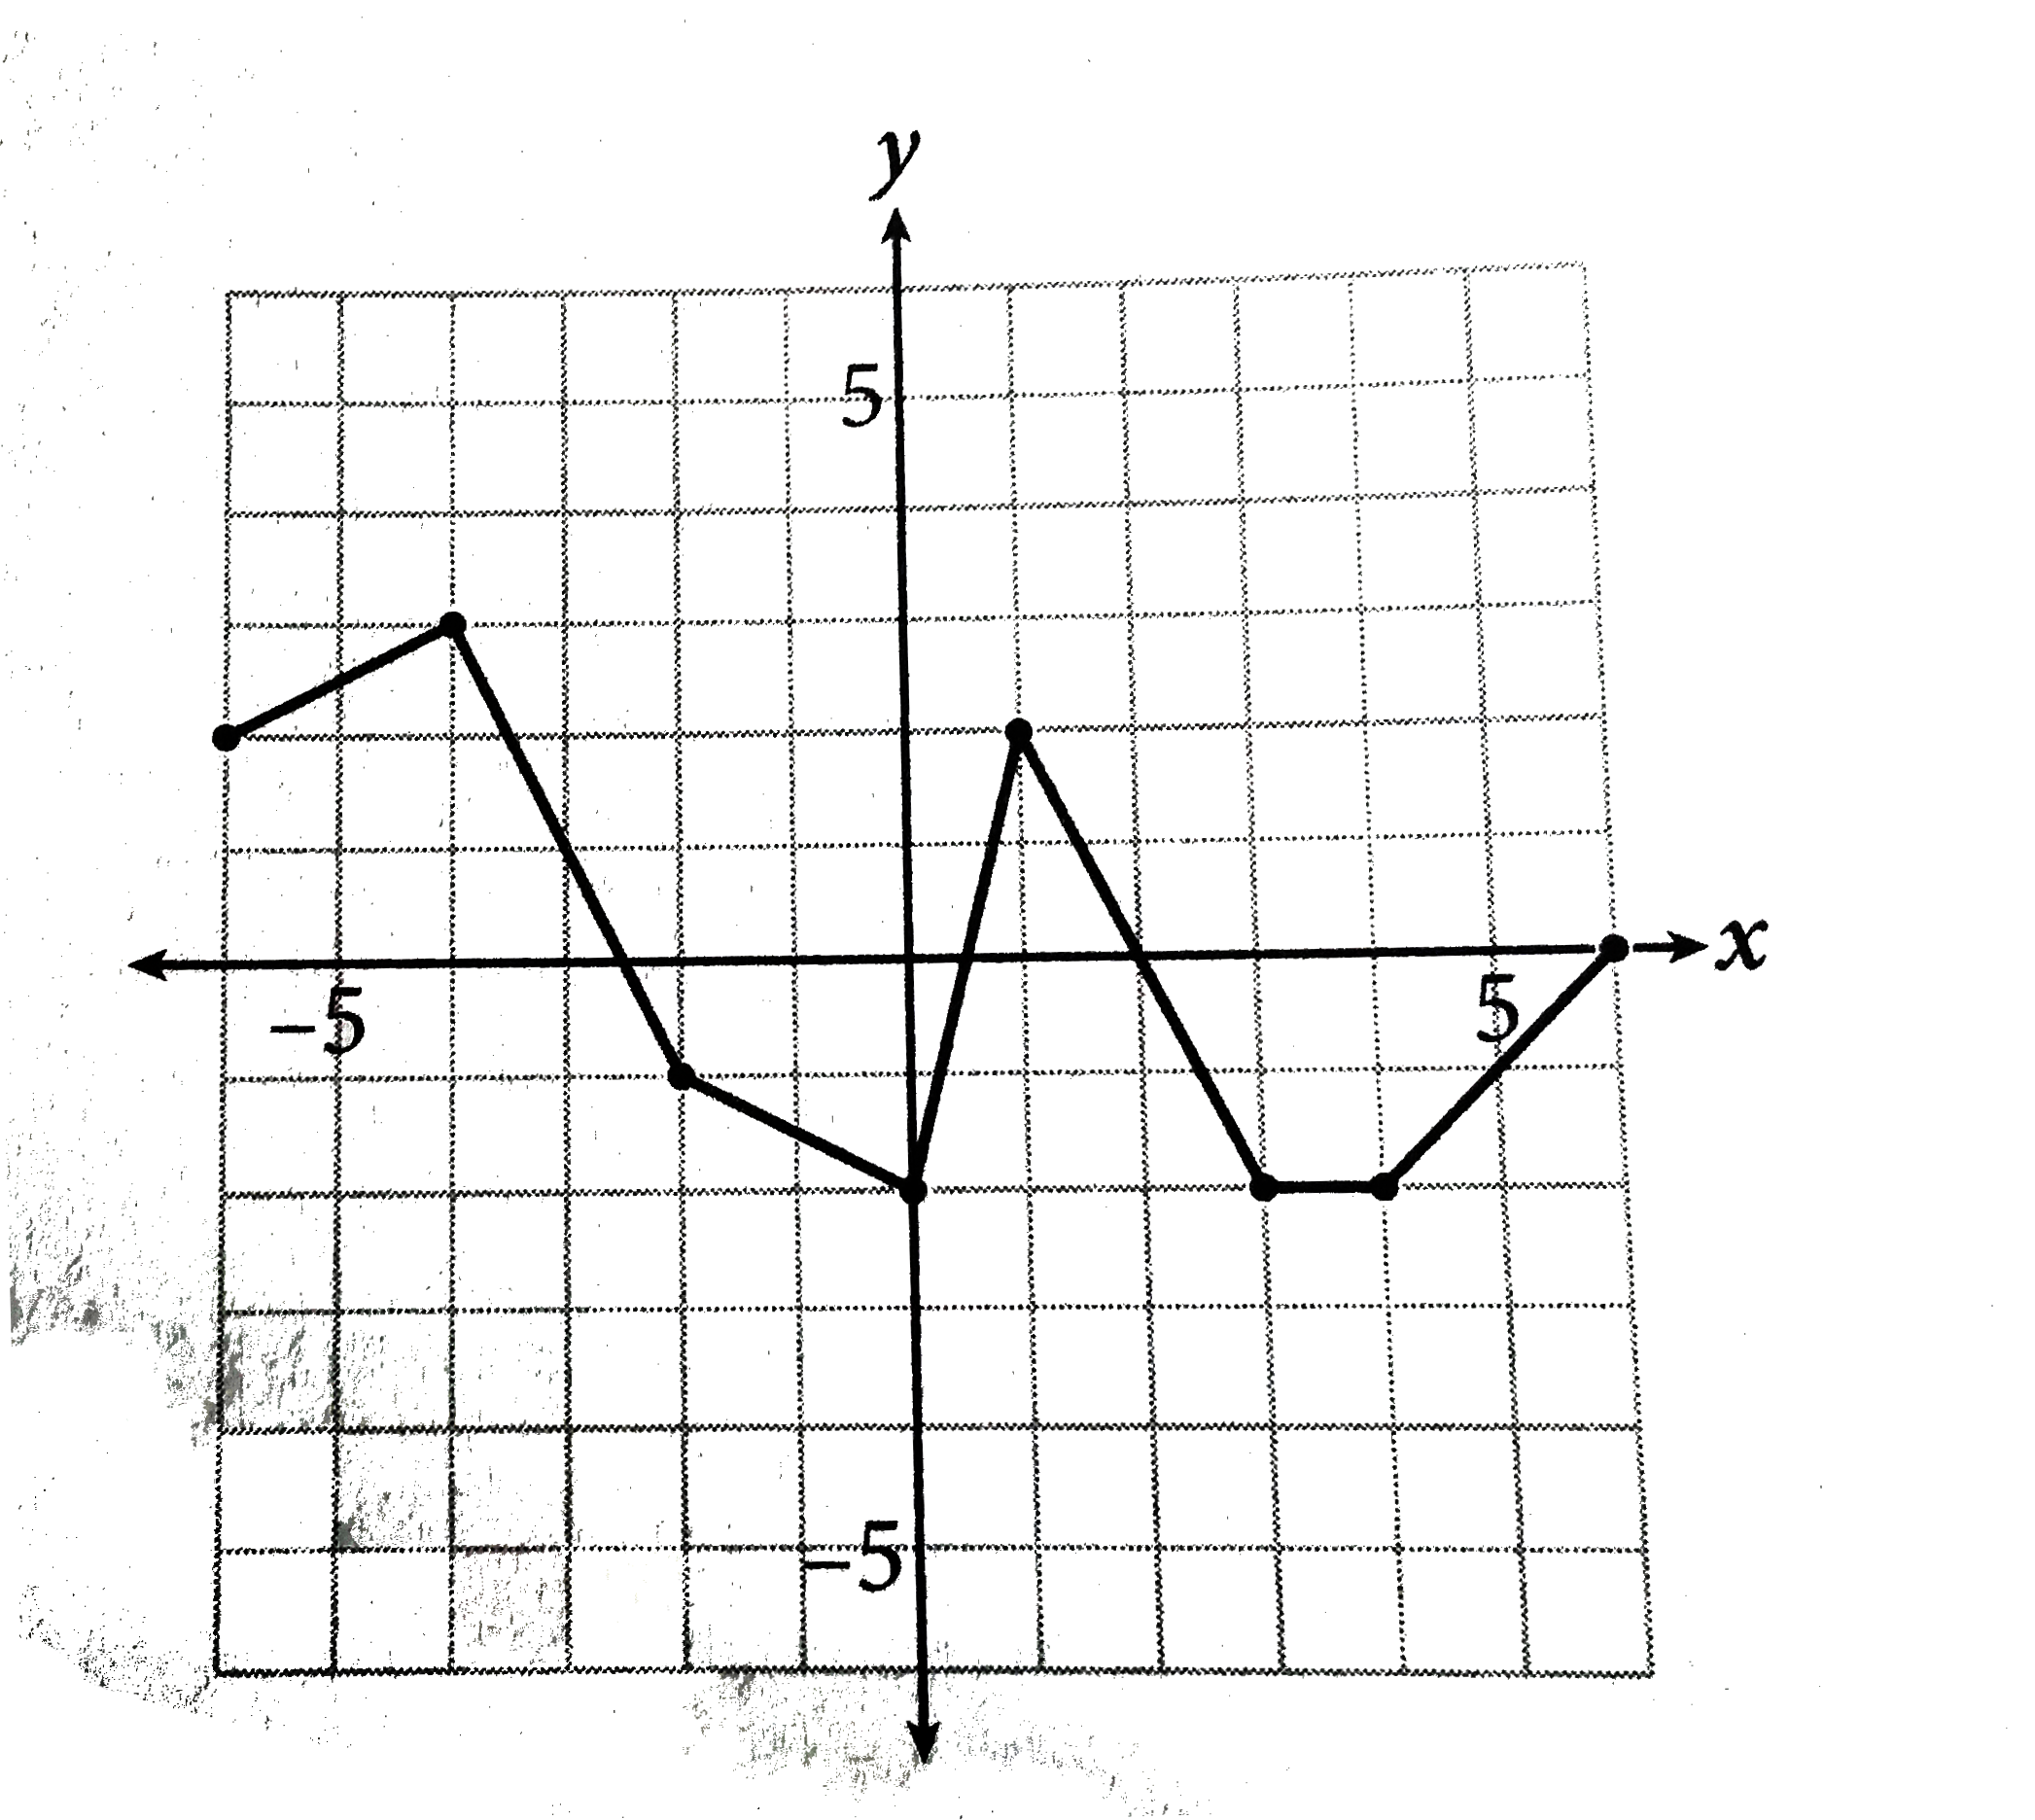
The complete graph of the function f is shown in the figure above. Which of the following is equal to −1 ?
I. f(−4)
II. f(0)
III. f(3)
A
I and II
B
II only
C
I, II and III
D
III only
Text Solution
The correct Answer is:D
Plug wach of the x-values into the function and see which produces a y-value of -1. Statement II is f (0). When x=0, the function's y-values is 2. Statement II is not equal to -1, so any answer choices that include statement II are incorrect. Eliminate (A), (B), and (C ). Only (D) is left and is correct. On test day, you would stop here and move on to the next question. For the record, statement I is f(−4)=0 and statement III is f(3)=−1. Also note that there are two other places where the function's output is −1:f(−3)andf(−1.5), neither of which is an answer choice.
|
Topper's Solved these Questions
- FUNCTIONS BOOK - KAPLANCHAPTER - FUNCTIONS EXERCISE - FUNCTION NOTATION
1 Videos
- FUNCTIONS BOOK - KAPLANCHAPTER - FUNCTIONS EXERCISE - GRAPHS OF FUNCTIONS
1 Videos
- FUNCTIONS BOOK - KAPLANCHAPTER - FUNCTIONS EXERCISE - DESCRIBING REAL-LIFE SITUATIONS WITH FUNCTIONS
1 Videos
- EXPONENTS, RADICALS, POLYNOMIALS, AND RATIONAL EXPRESSIONSBOOK - KAPLANCHAPTER - EXPONENTS, RADICALS, POLYNOMIALS, AND RATIONAL EXPRESSIONSEXERCISE - RATIONAL EXPRESSIONS AND EQUATIONS
1 Videos
- GEOMETRY BOOK - KAPLANCHAPTER - GEOMETRY EXERCISE - THREE-DIMENSIONAL FIGURES
1 Videos
Similar Questions
Knowledge Check
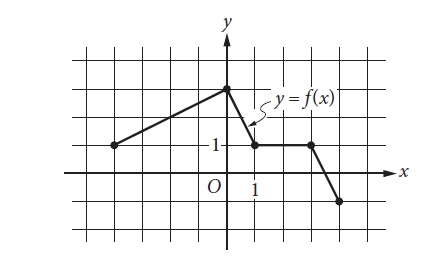
The complete graph of the function f is shown in the xy-plane above. Which of the following are equal to 1 ?
I. f(−4)
II. f(32)
III. f(3)AIII onlyBI and III onlyCII and III onlyDI, II, and III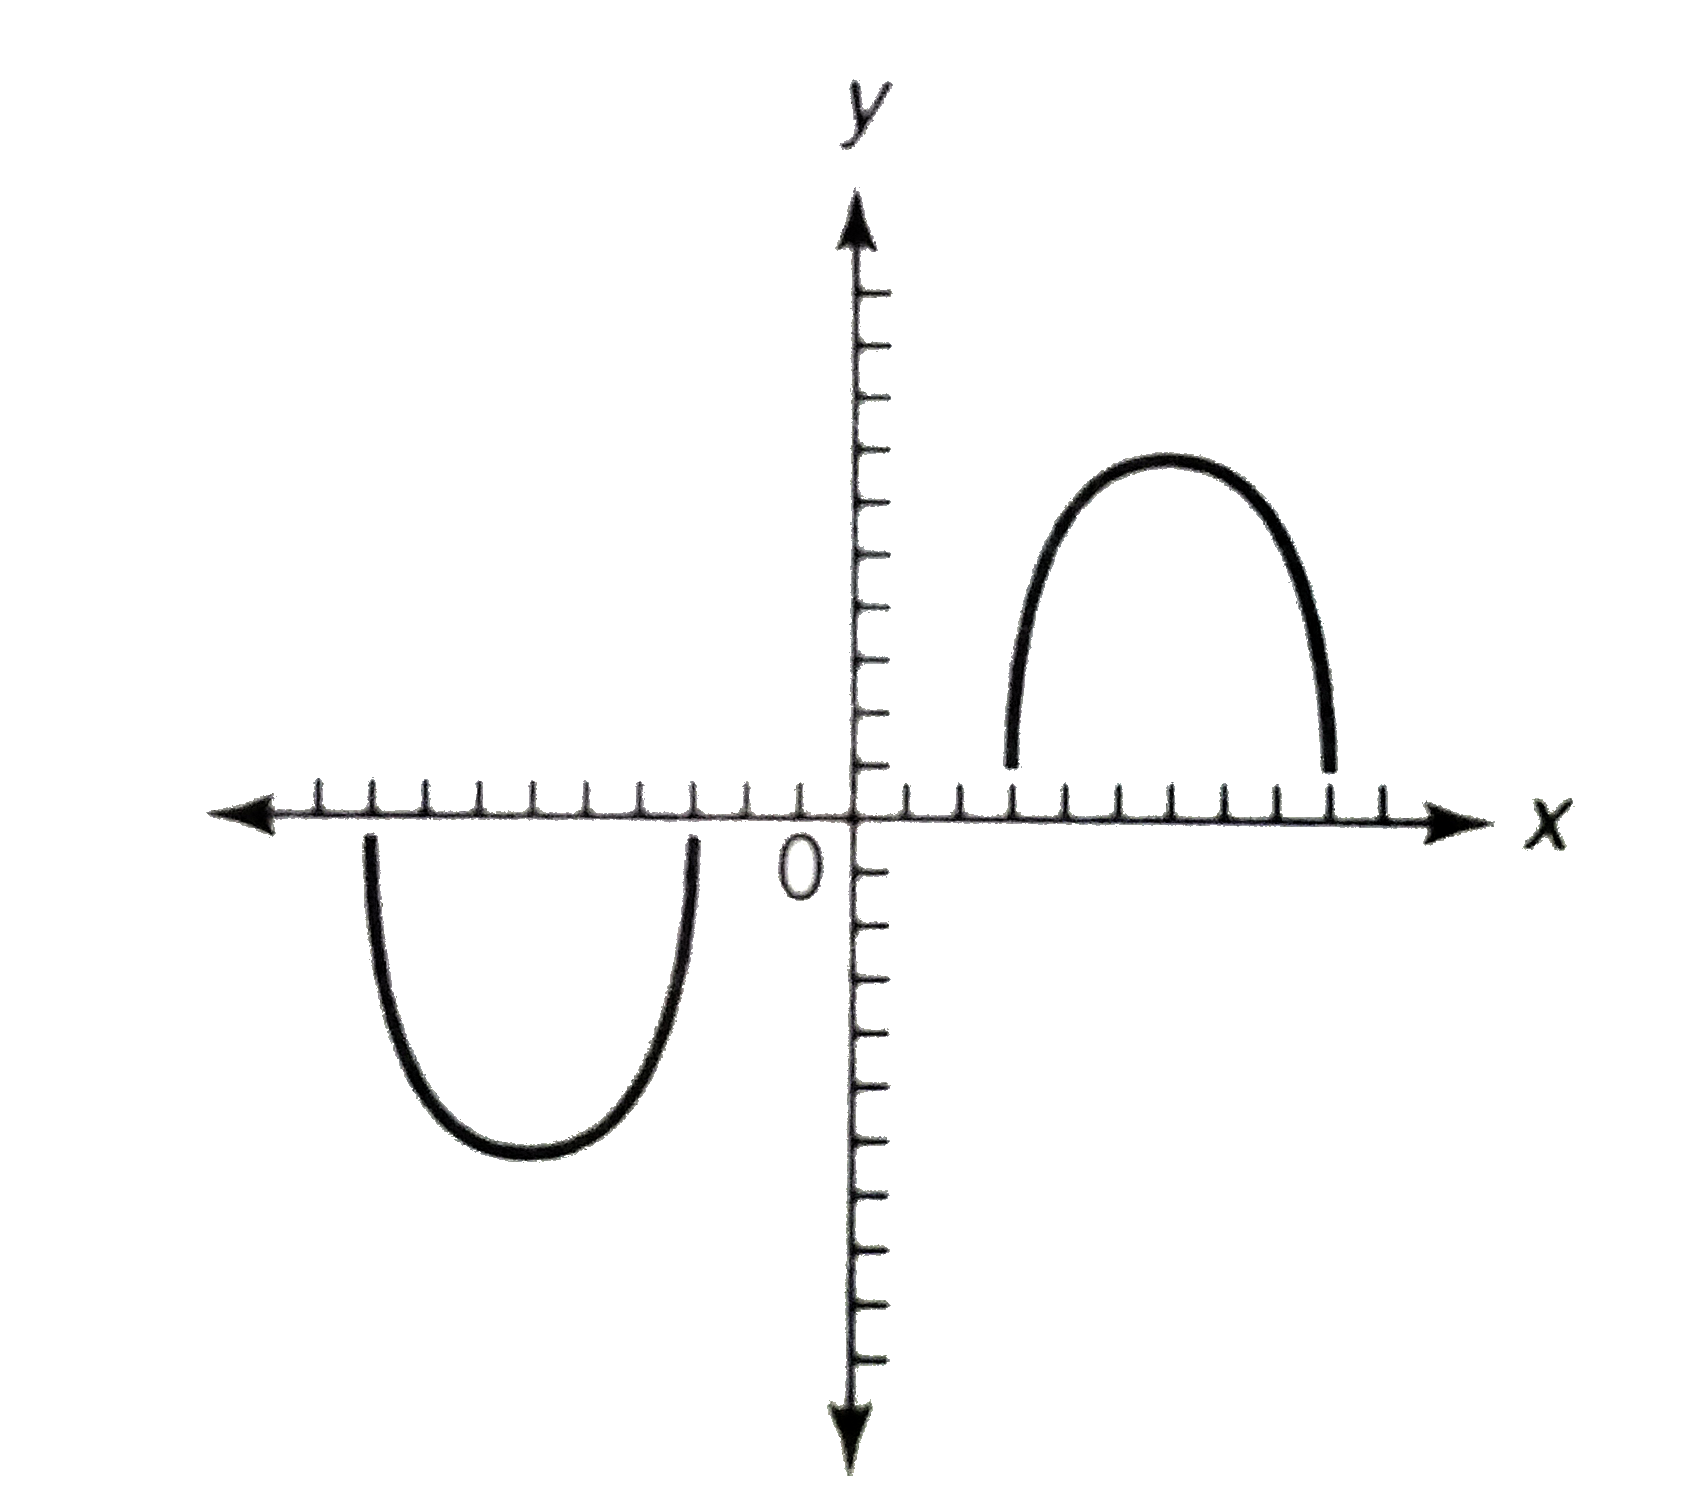
The graph of the function f is shown above. Which of the following could represent the graph of y=|f(x)|?A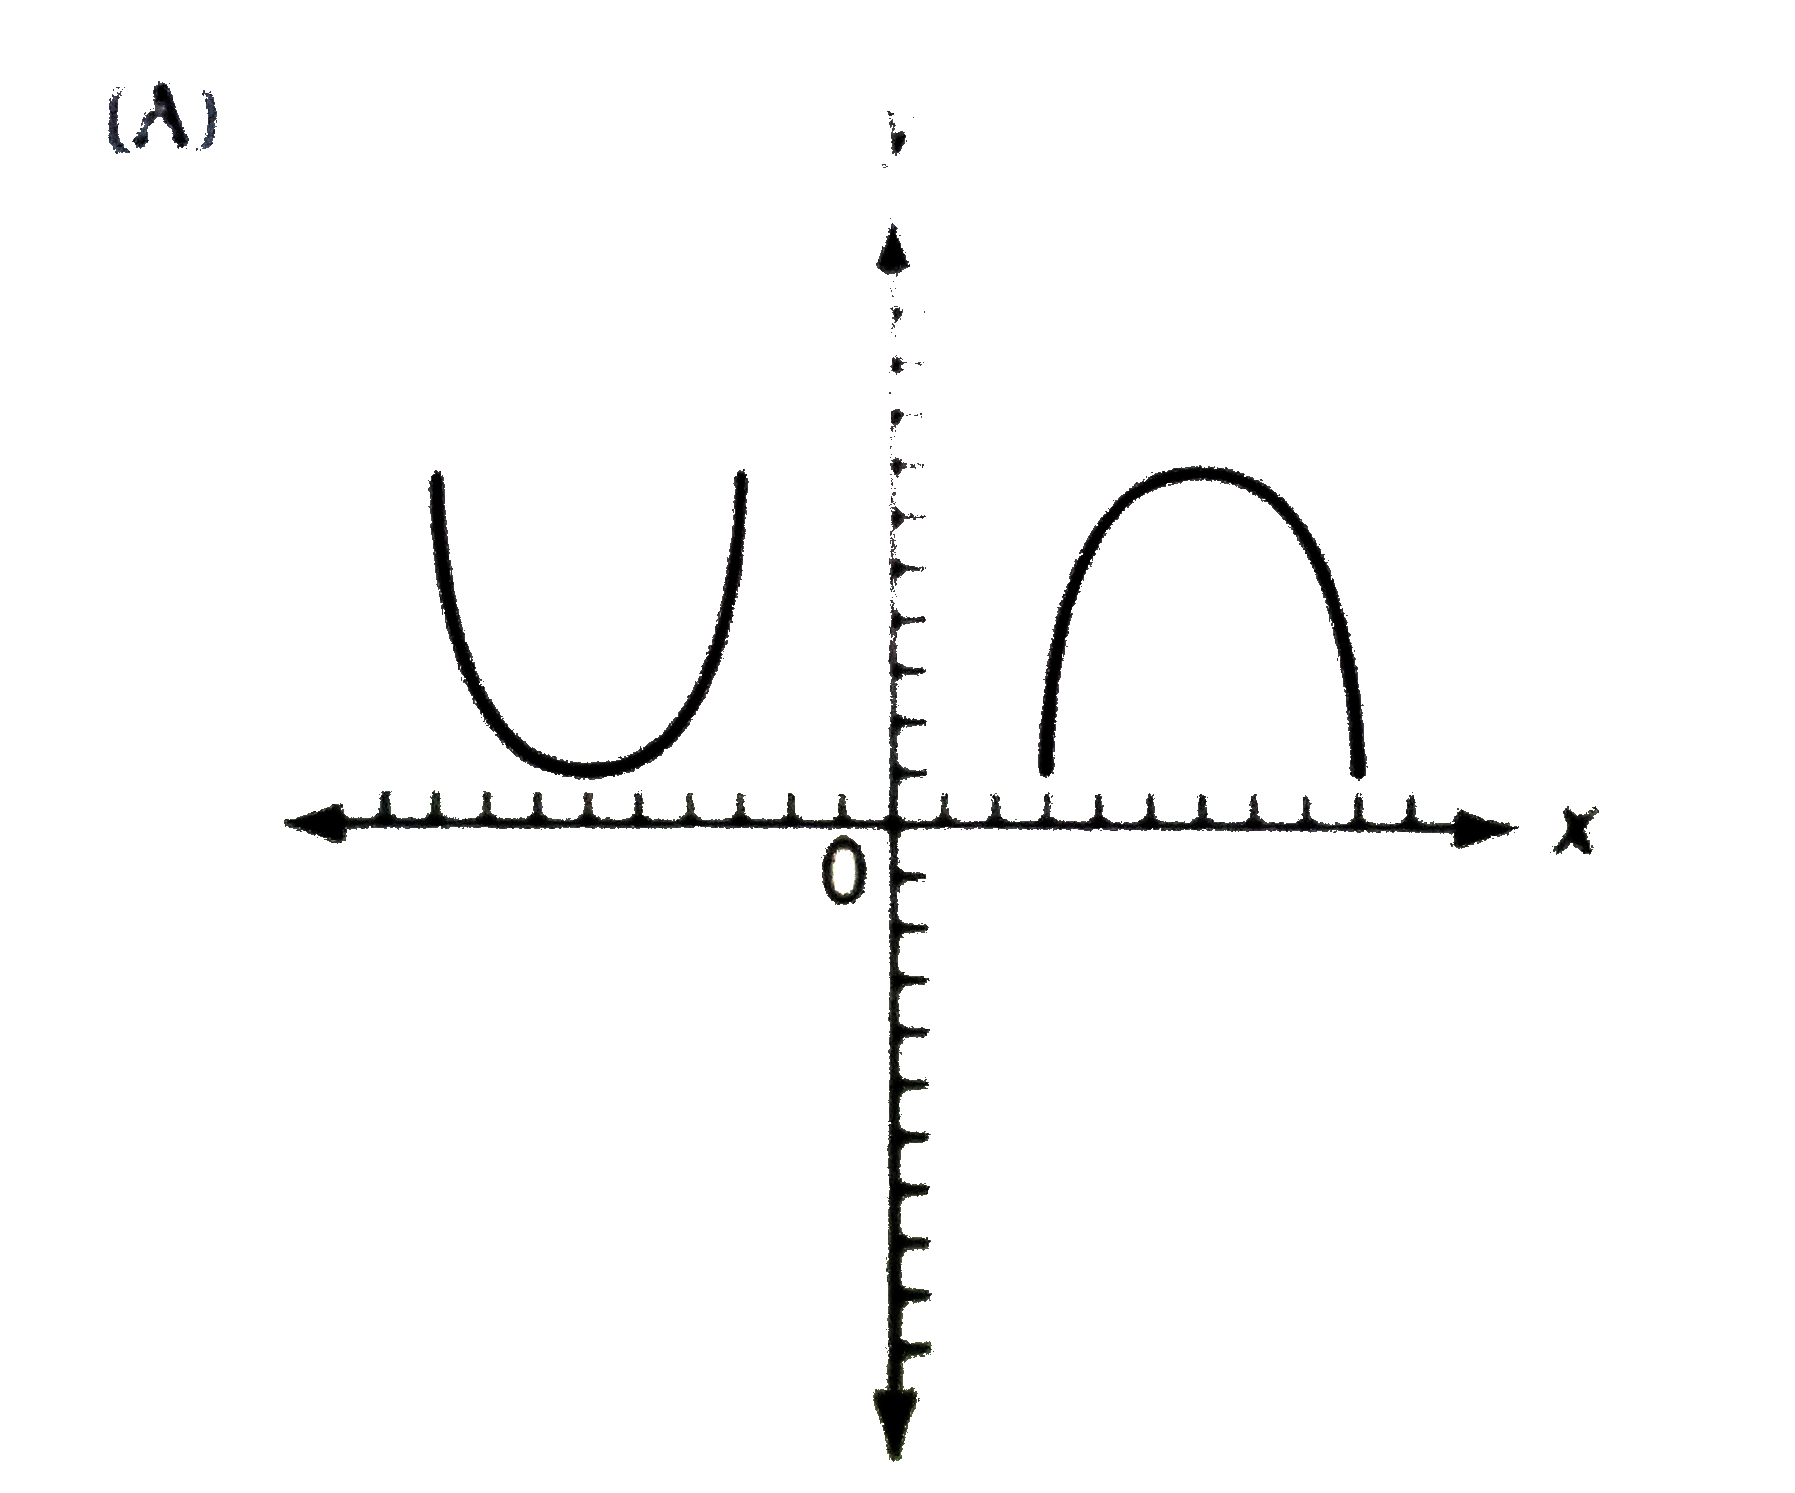 B
B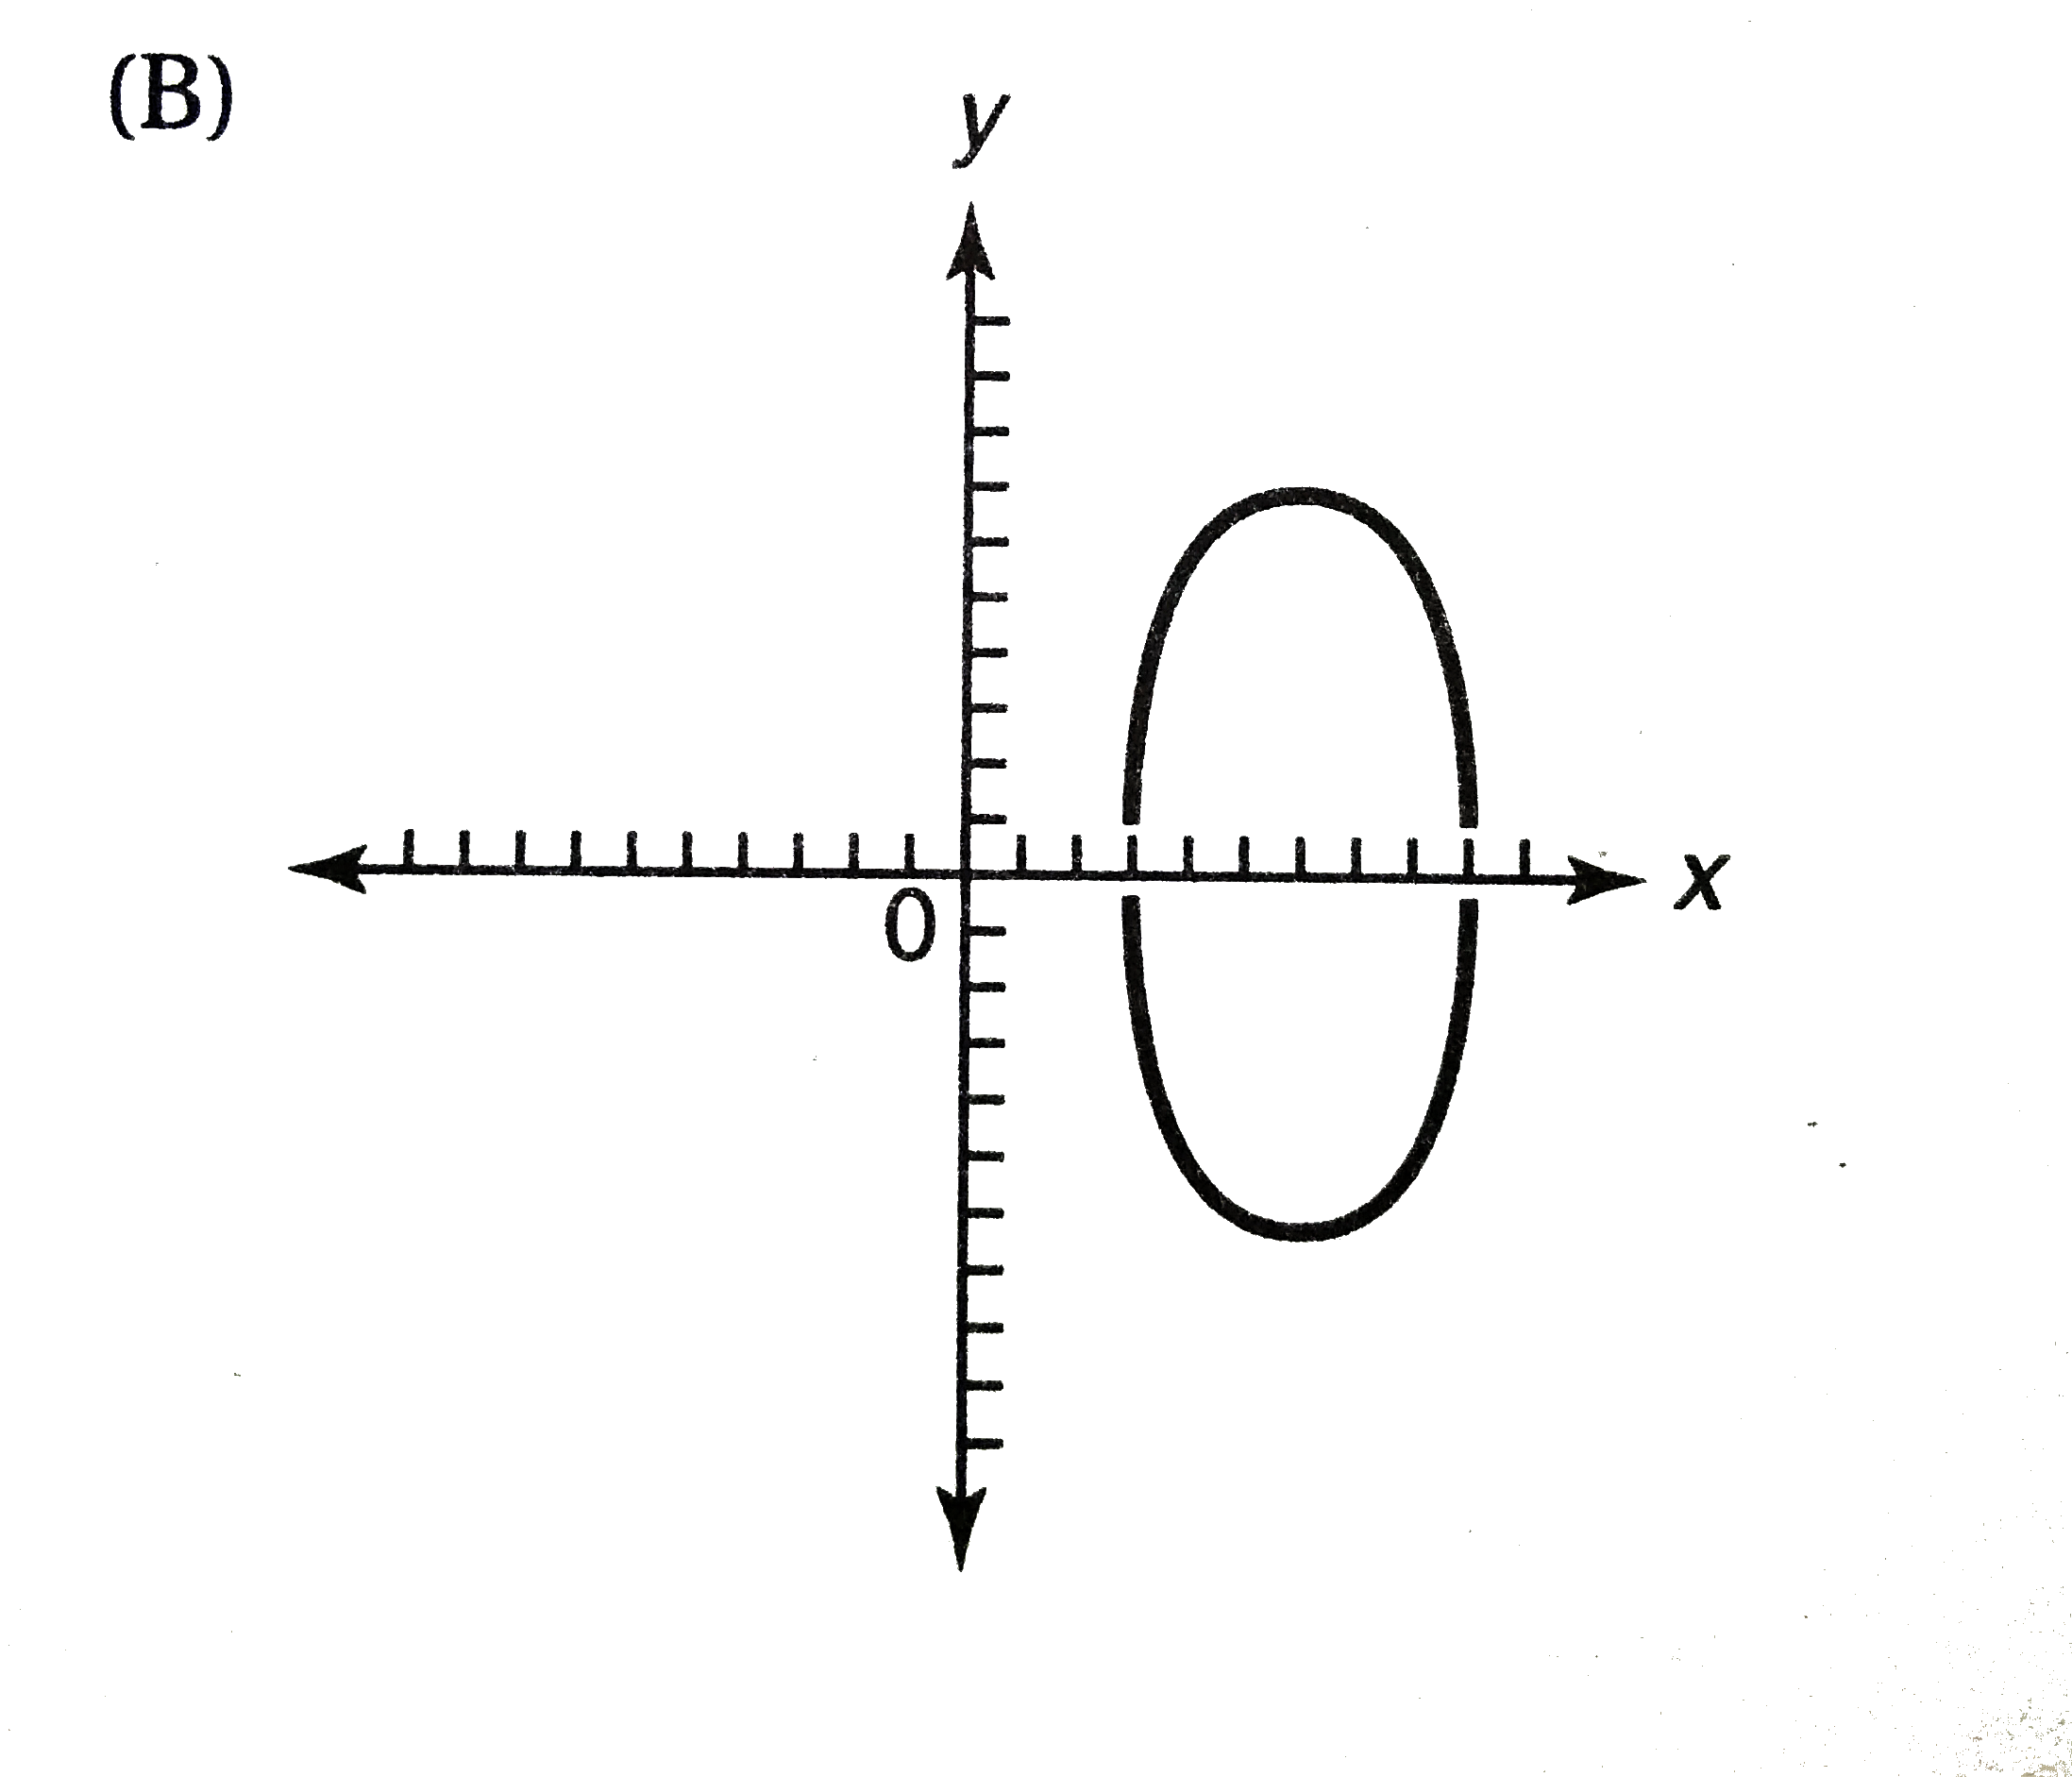 C
C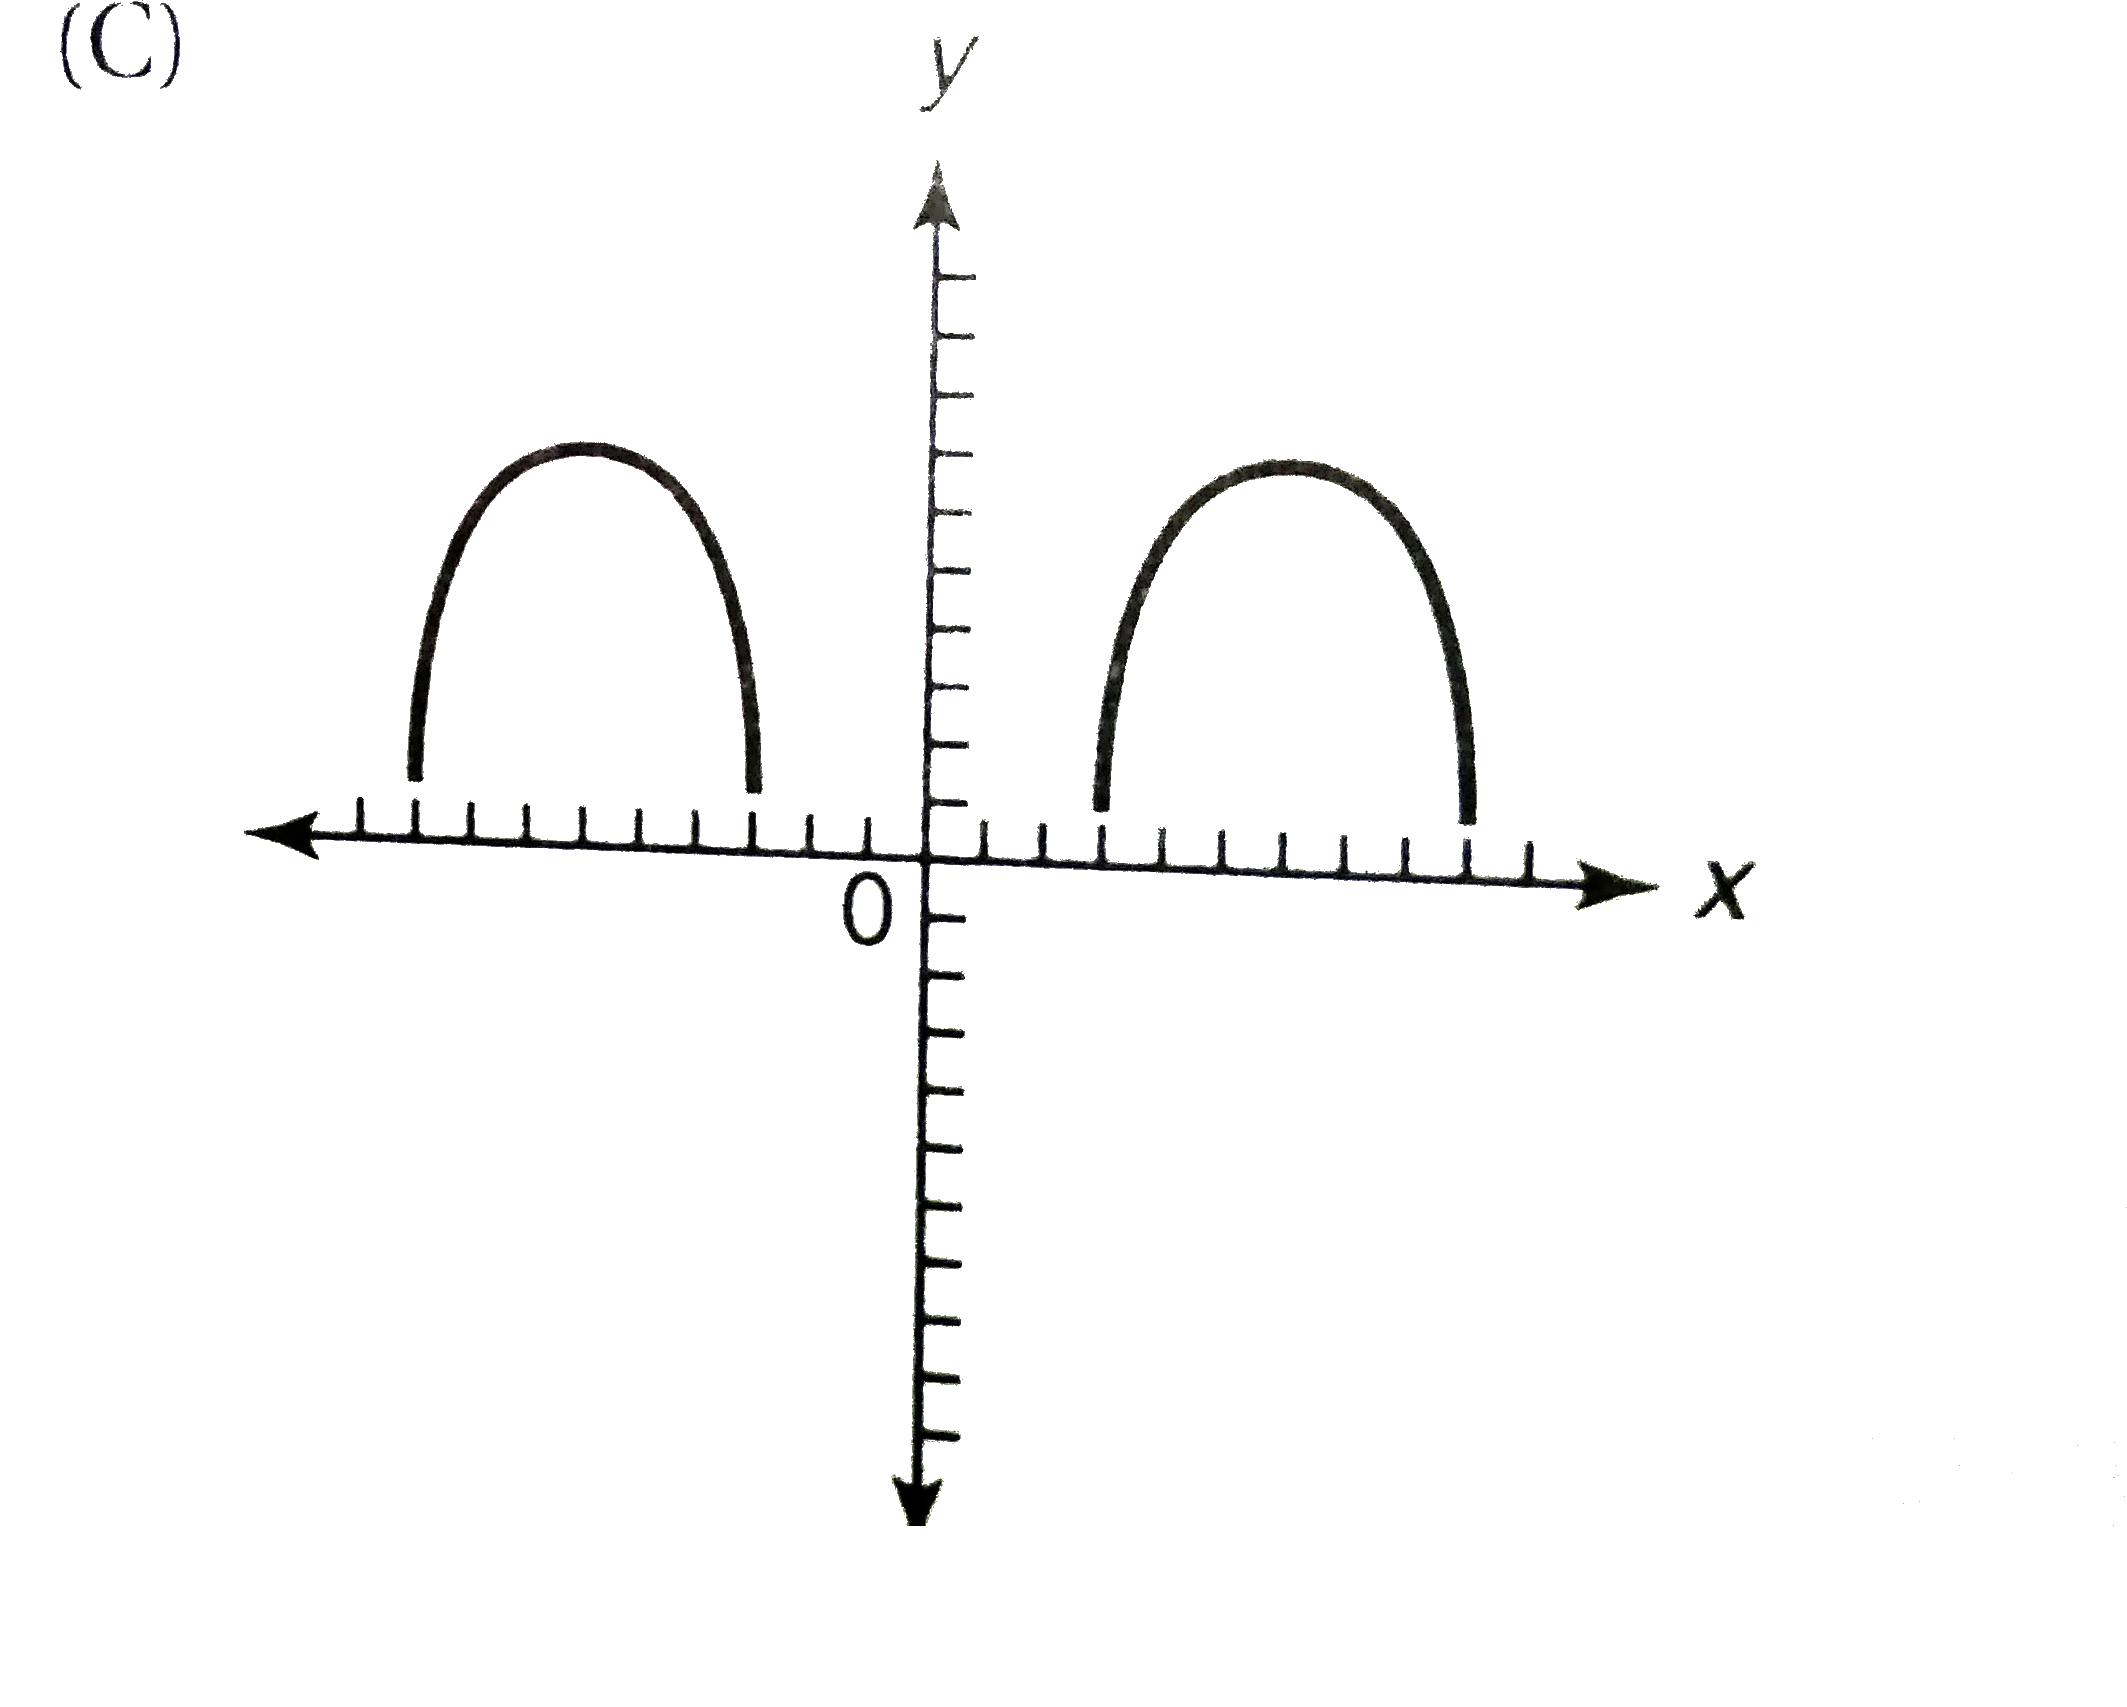 D
D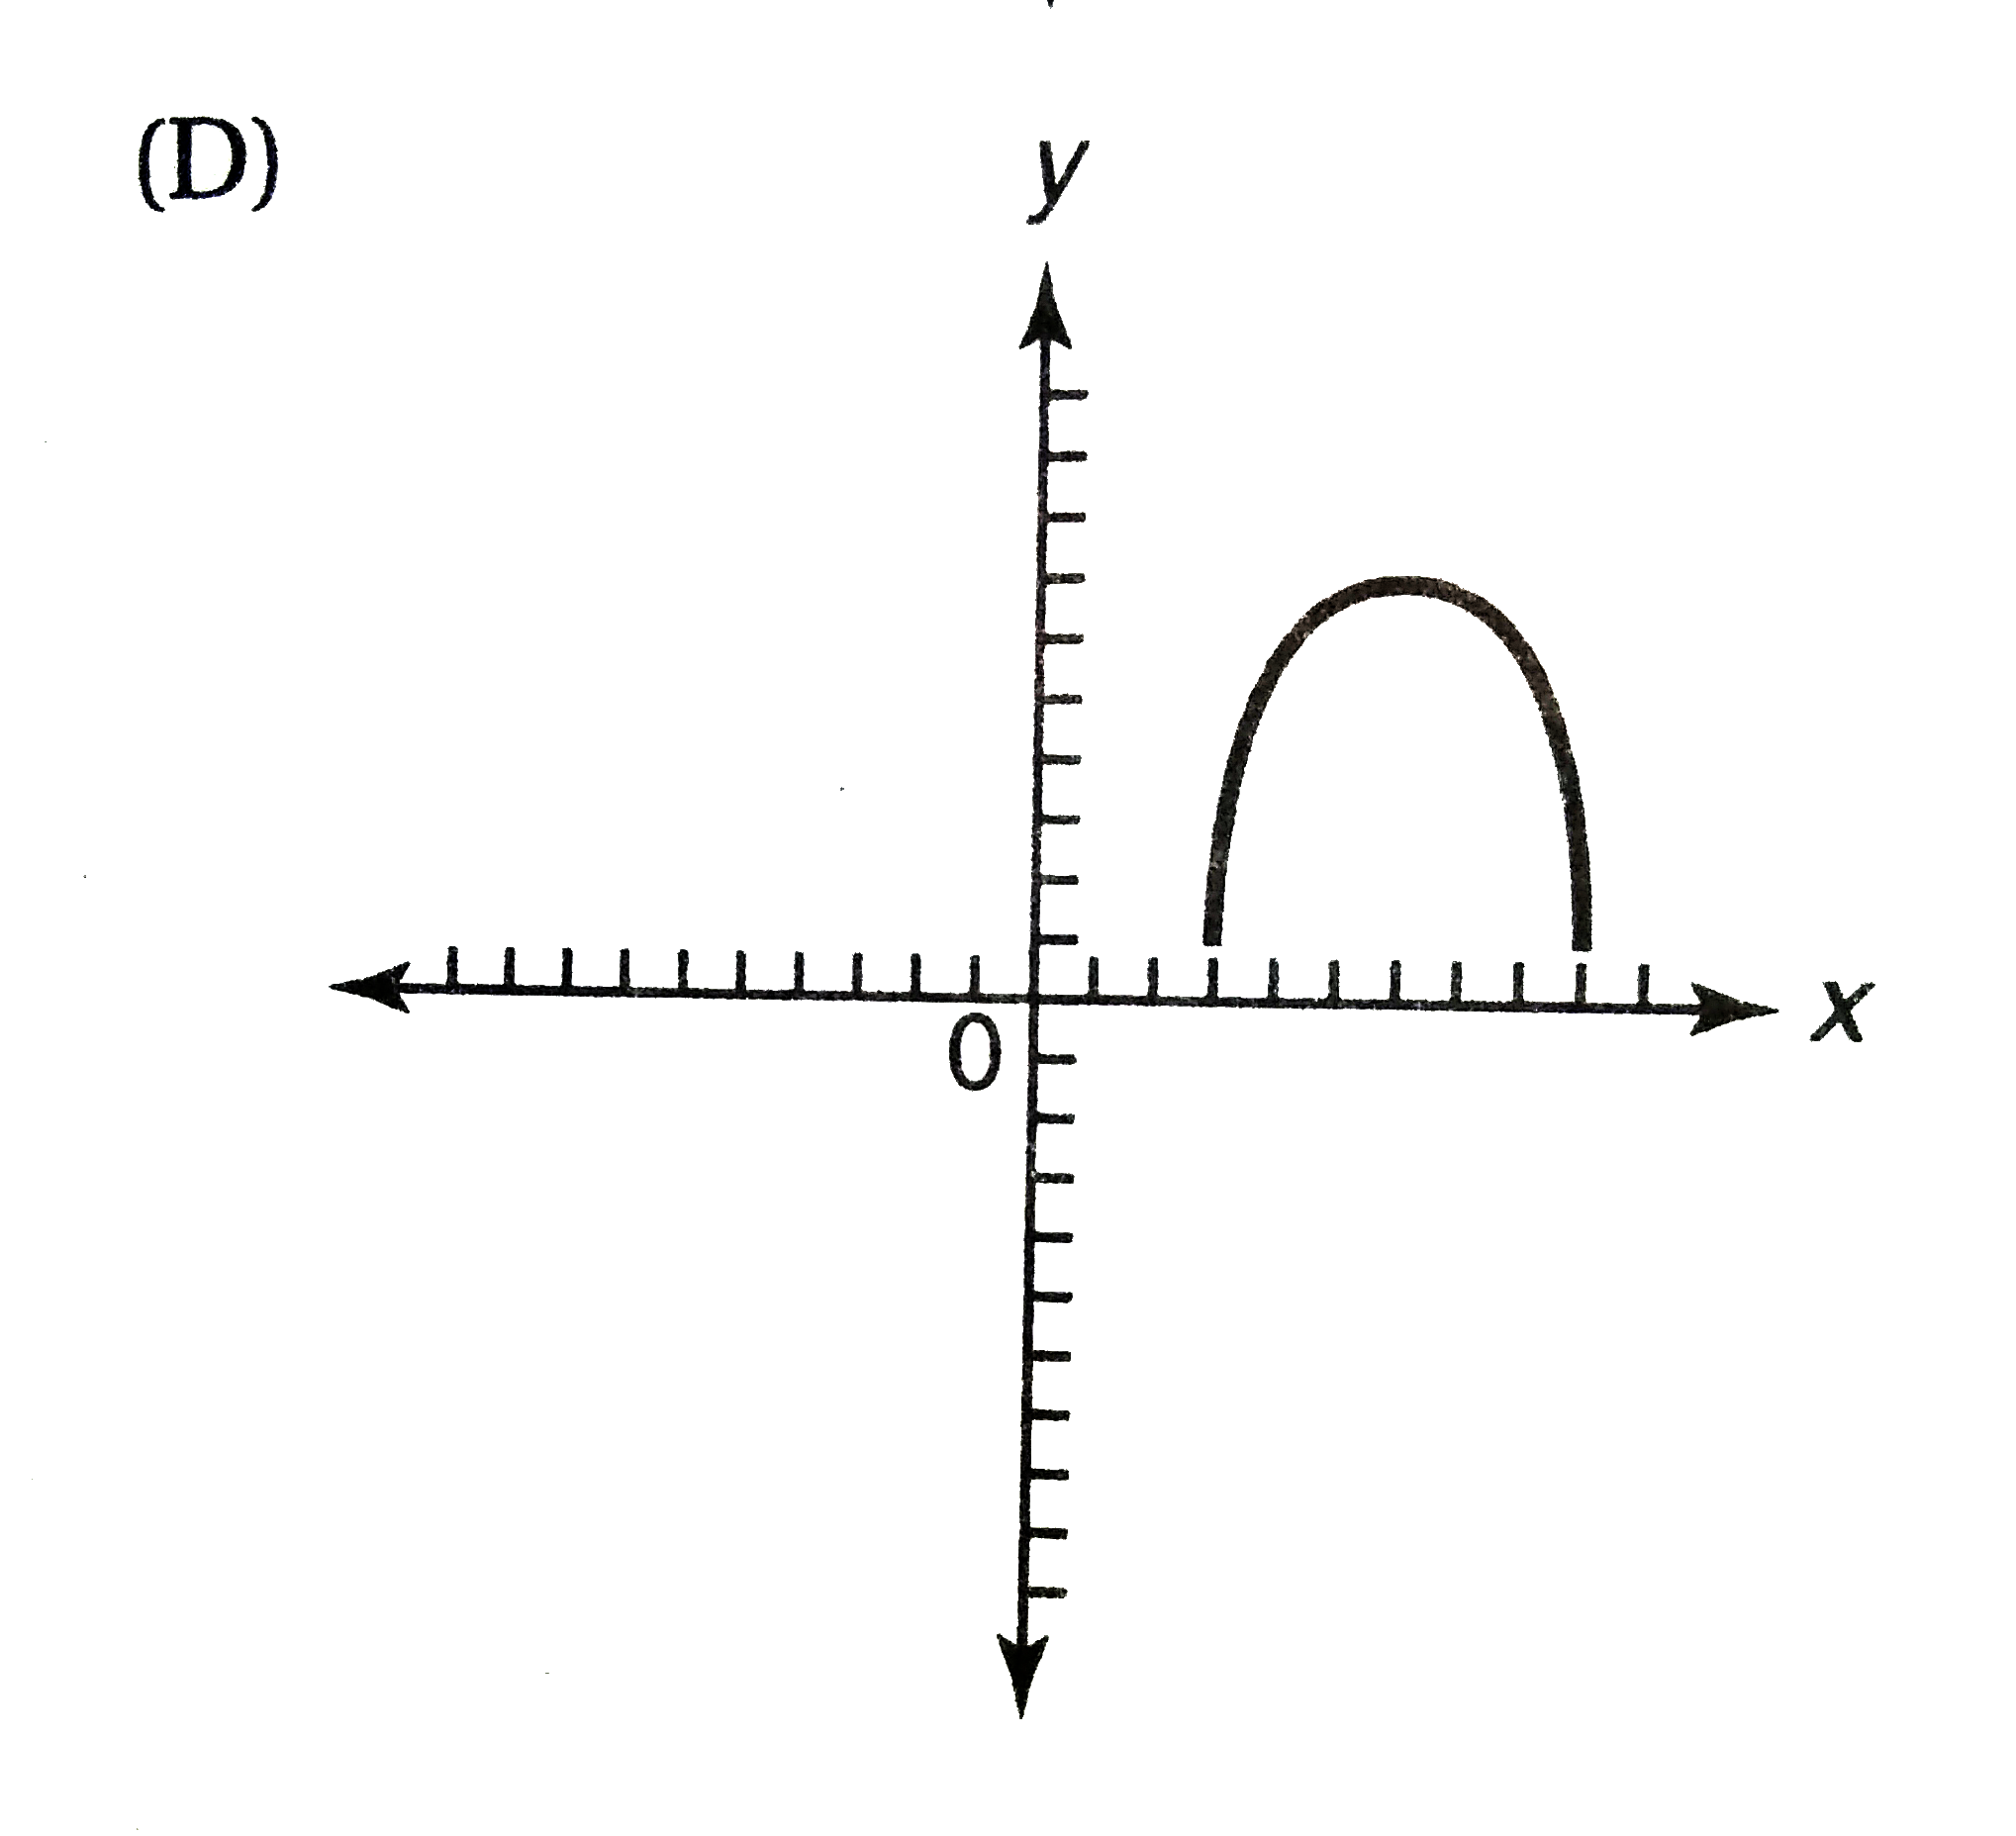
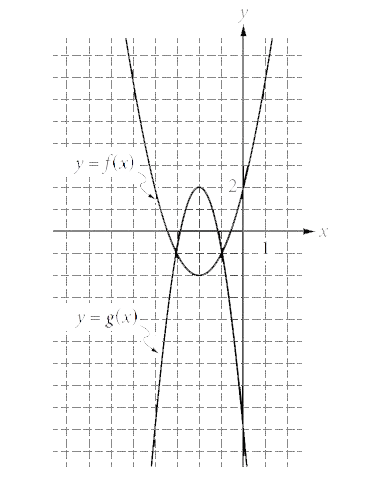
Graphs of the functions f and g are shown in the xy-plane above. For which of the following values of x does f(x)+g(x)=0 ?A−3B−2C−1D0
If the graph of the function y=f(x) is as shown : the graph of y=12(|f(x)|−f(x)) is
View Solution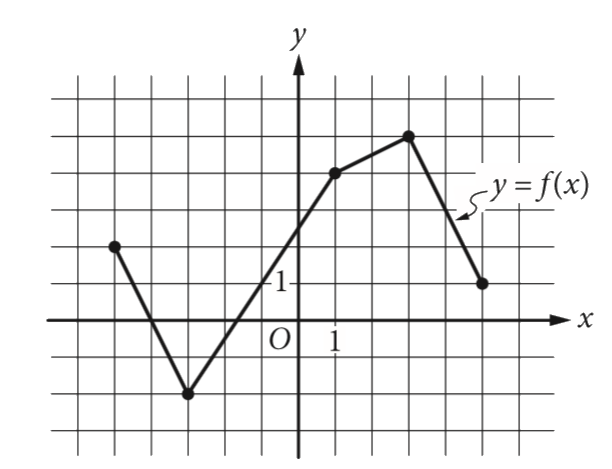
The complete graph of the function f is shown in the xy-plane above. For what value of x is the value of f(x) at its minimum?
View Solution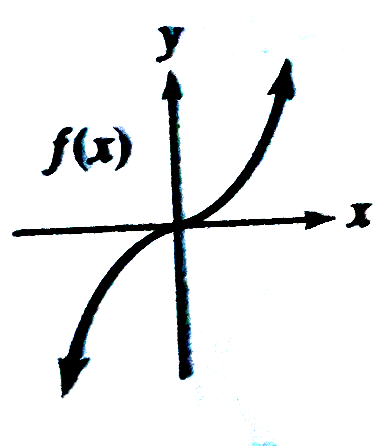
The graph of f(x) is shown above , Which of the following represents the graph of f(x-3) ?
View Solution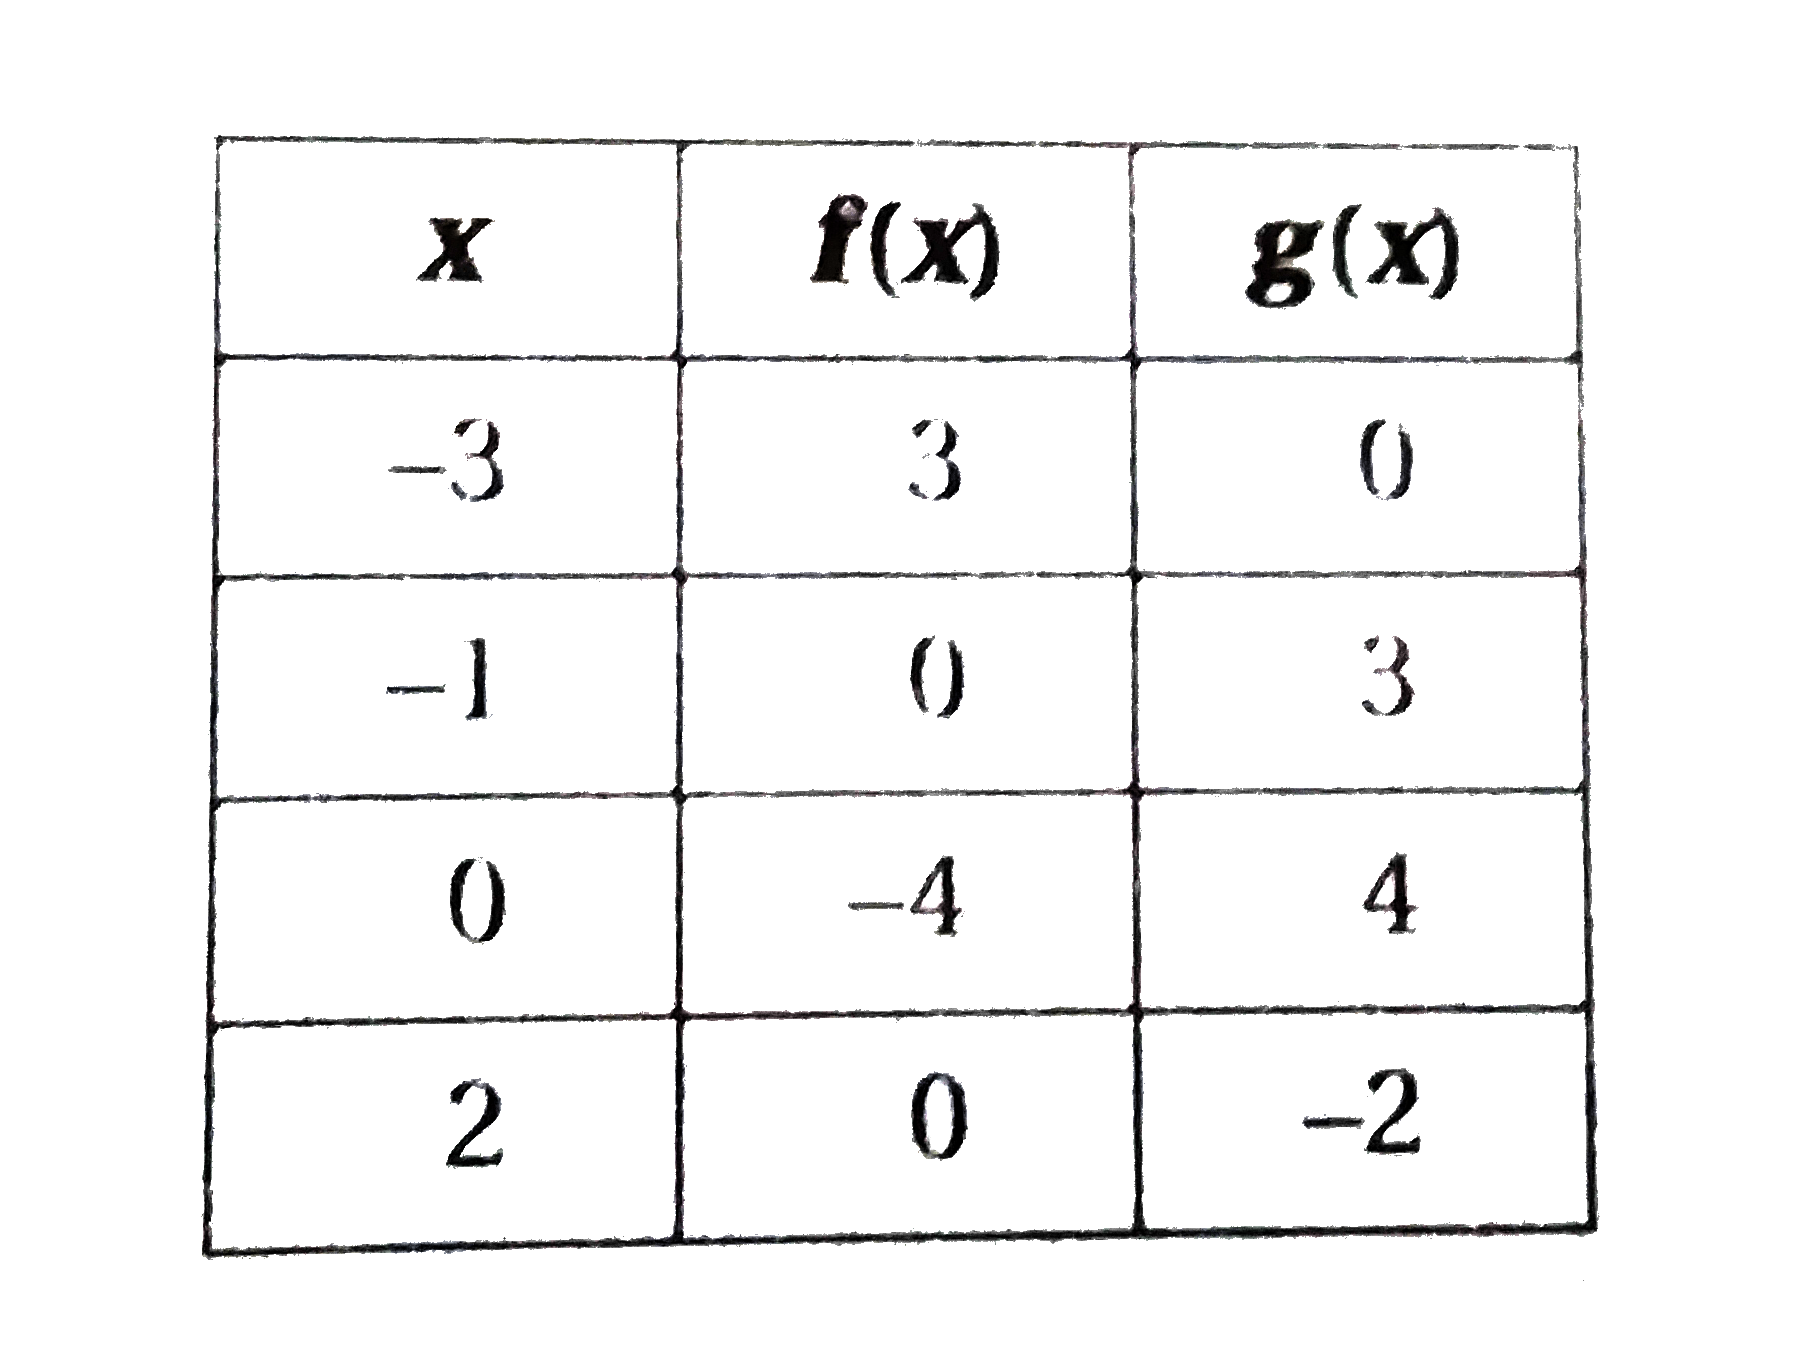
Several values of x, and the corresponding values for polynomial functions f and g are shown in the table above. Which of the following statements is true?
I. f(0)+g(0)=0
II. f(x) is divisible by x+2
III. g(x) is divisible by x+3.
View SolutionIf f is an odd function and f(a)=b, which of the following must also be true ?
I. f(a)=−b
II.f(−a)=b
III. f(−a)=−b
View Solution

