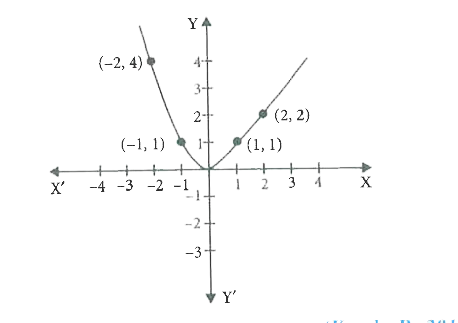
The maximum vlaue of function g, whose graph is shown above, is m. Values for the function h are shown in the table. What is the value of h (m) ?
A
−3
B
−2
C
2
D
4
Text Solution
The correct Answer is:B
Start by identifying m, which occurs at the epex of the function at (0,1). The "maximum value of function g" means the greatest y-value, so m=1. Next, use the table to find h(1), which is the y-value when x=1. According to the table, when x=1,h(x)=−2. (B) is correct.
|
Topper's Solved these Questions
- FUNCTIONS BOOK - KAPLANCHAPTER - FUNCTIONS EXERCISE - DESCRIBING REAL-LIFE SITUATIONS WITH FUNCTIONS
1 Videos
- FUNCTIONS BOOK - KAPLANCHAPTER - FUNCTIONS EXERCISE - FUNCTION NOTATION
1 Videos
- EXPONENTS, RADICALS, POLYNOMIALS, AND RATIONAL EXPRESSIONSBOOK - KAPLANCHAPTER - EXPONENTS, RADICALS, POLYNOMIALS, AND RATIONAL EXPRESSIONSEXERCISE - RATIONAL EXPRESSIONS AND EQUATIONS
1 Videos
- GEOMETRY BOOK - KAPLANCHAPTER - GEOMETRY EXERCISE - THREE-DIMENSIONAL FIGURES
1 Videos
Similar Questions
Knowledge Check
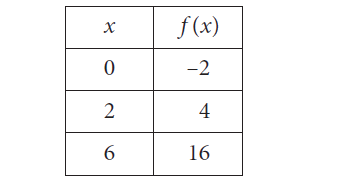
Some values of the linear function f are shown in the table above. What is the value of f (3) ?A6B7C8D9The function g is defined above. What is the value of g(−4x) ?
A7B−12x−5C12x−5D12x2−20x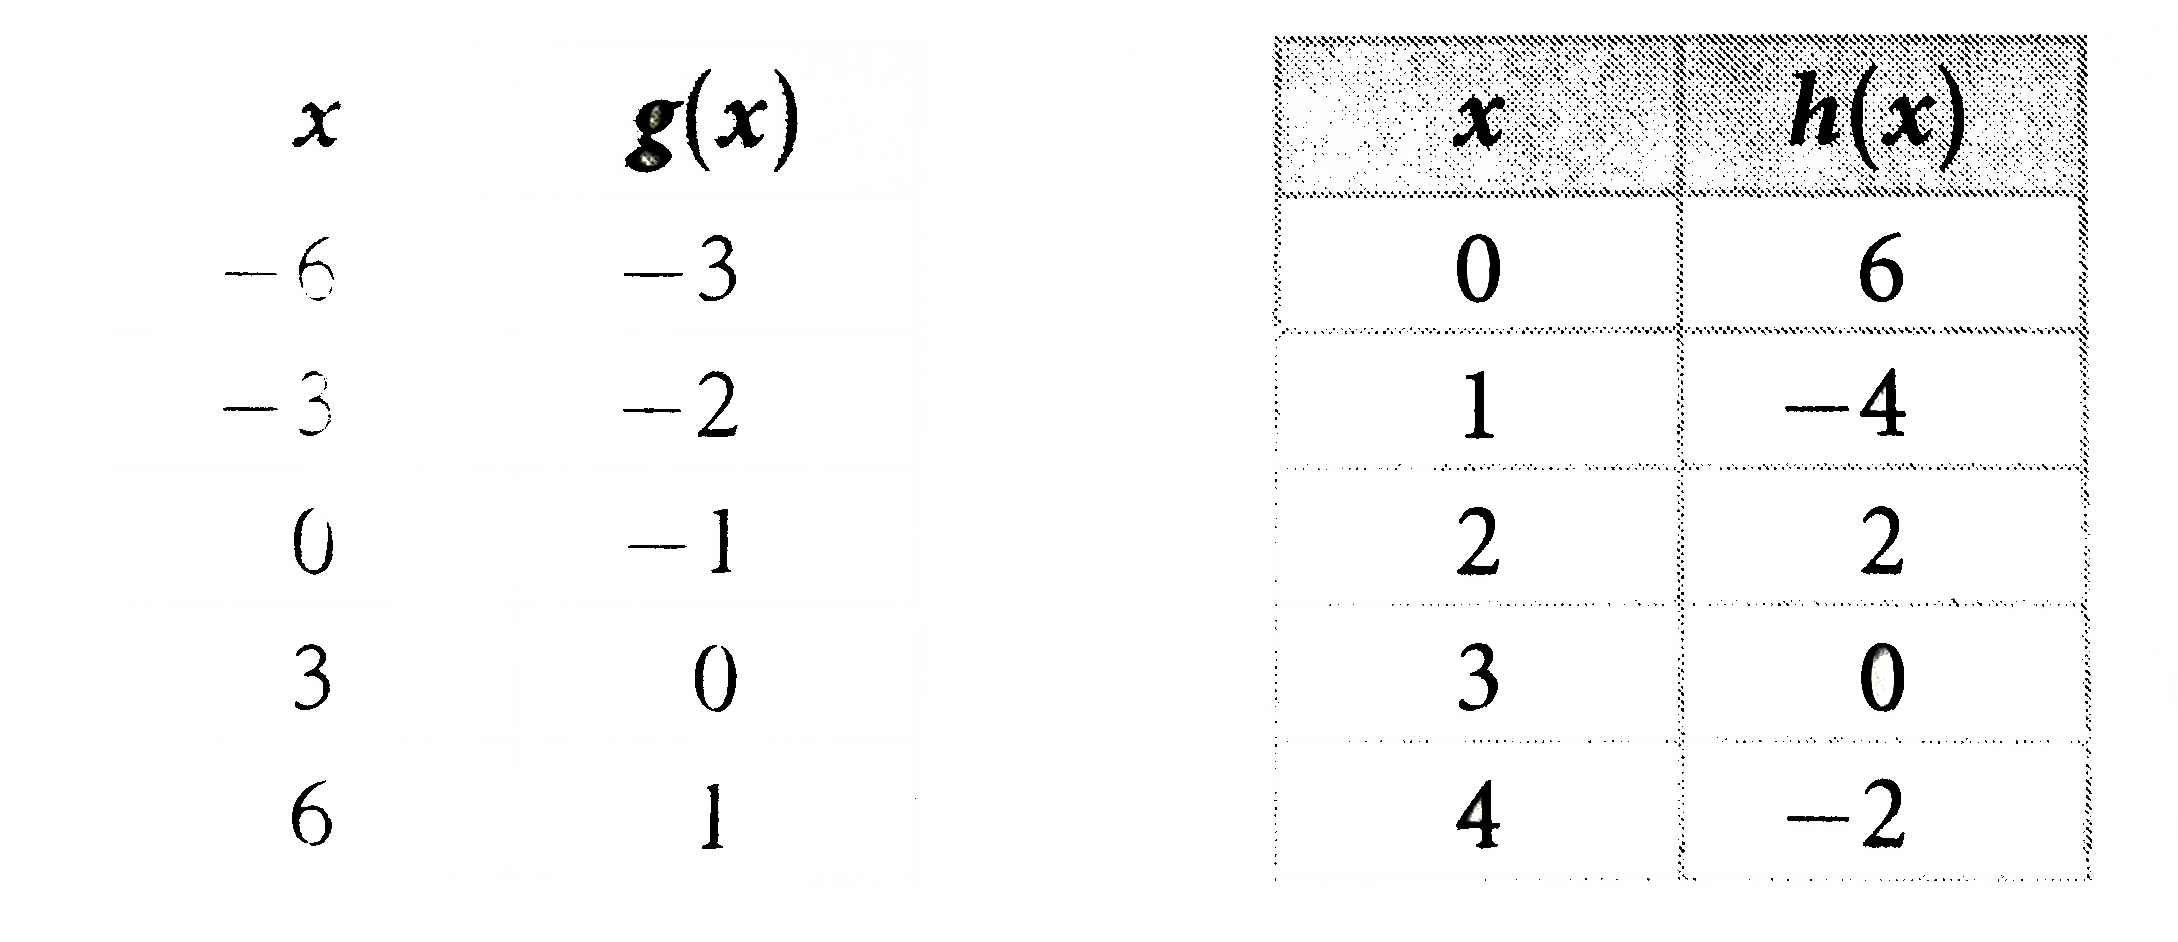
Several values for the functions g (x) and h (x) are shown in the table above. What is the value of g(h(3)) ?A−1B0C3D6
Let f and g are the functions whose graphs are shown
View Solution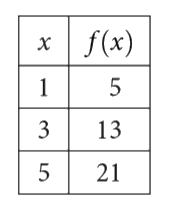
Some values of the linear functions f are shown in the table above. Which of the following defines of f?
View Solution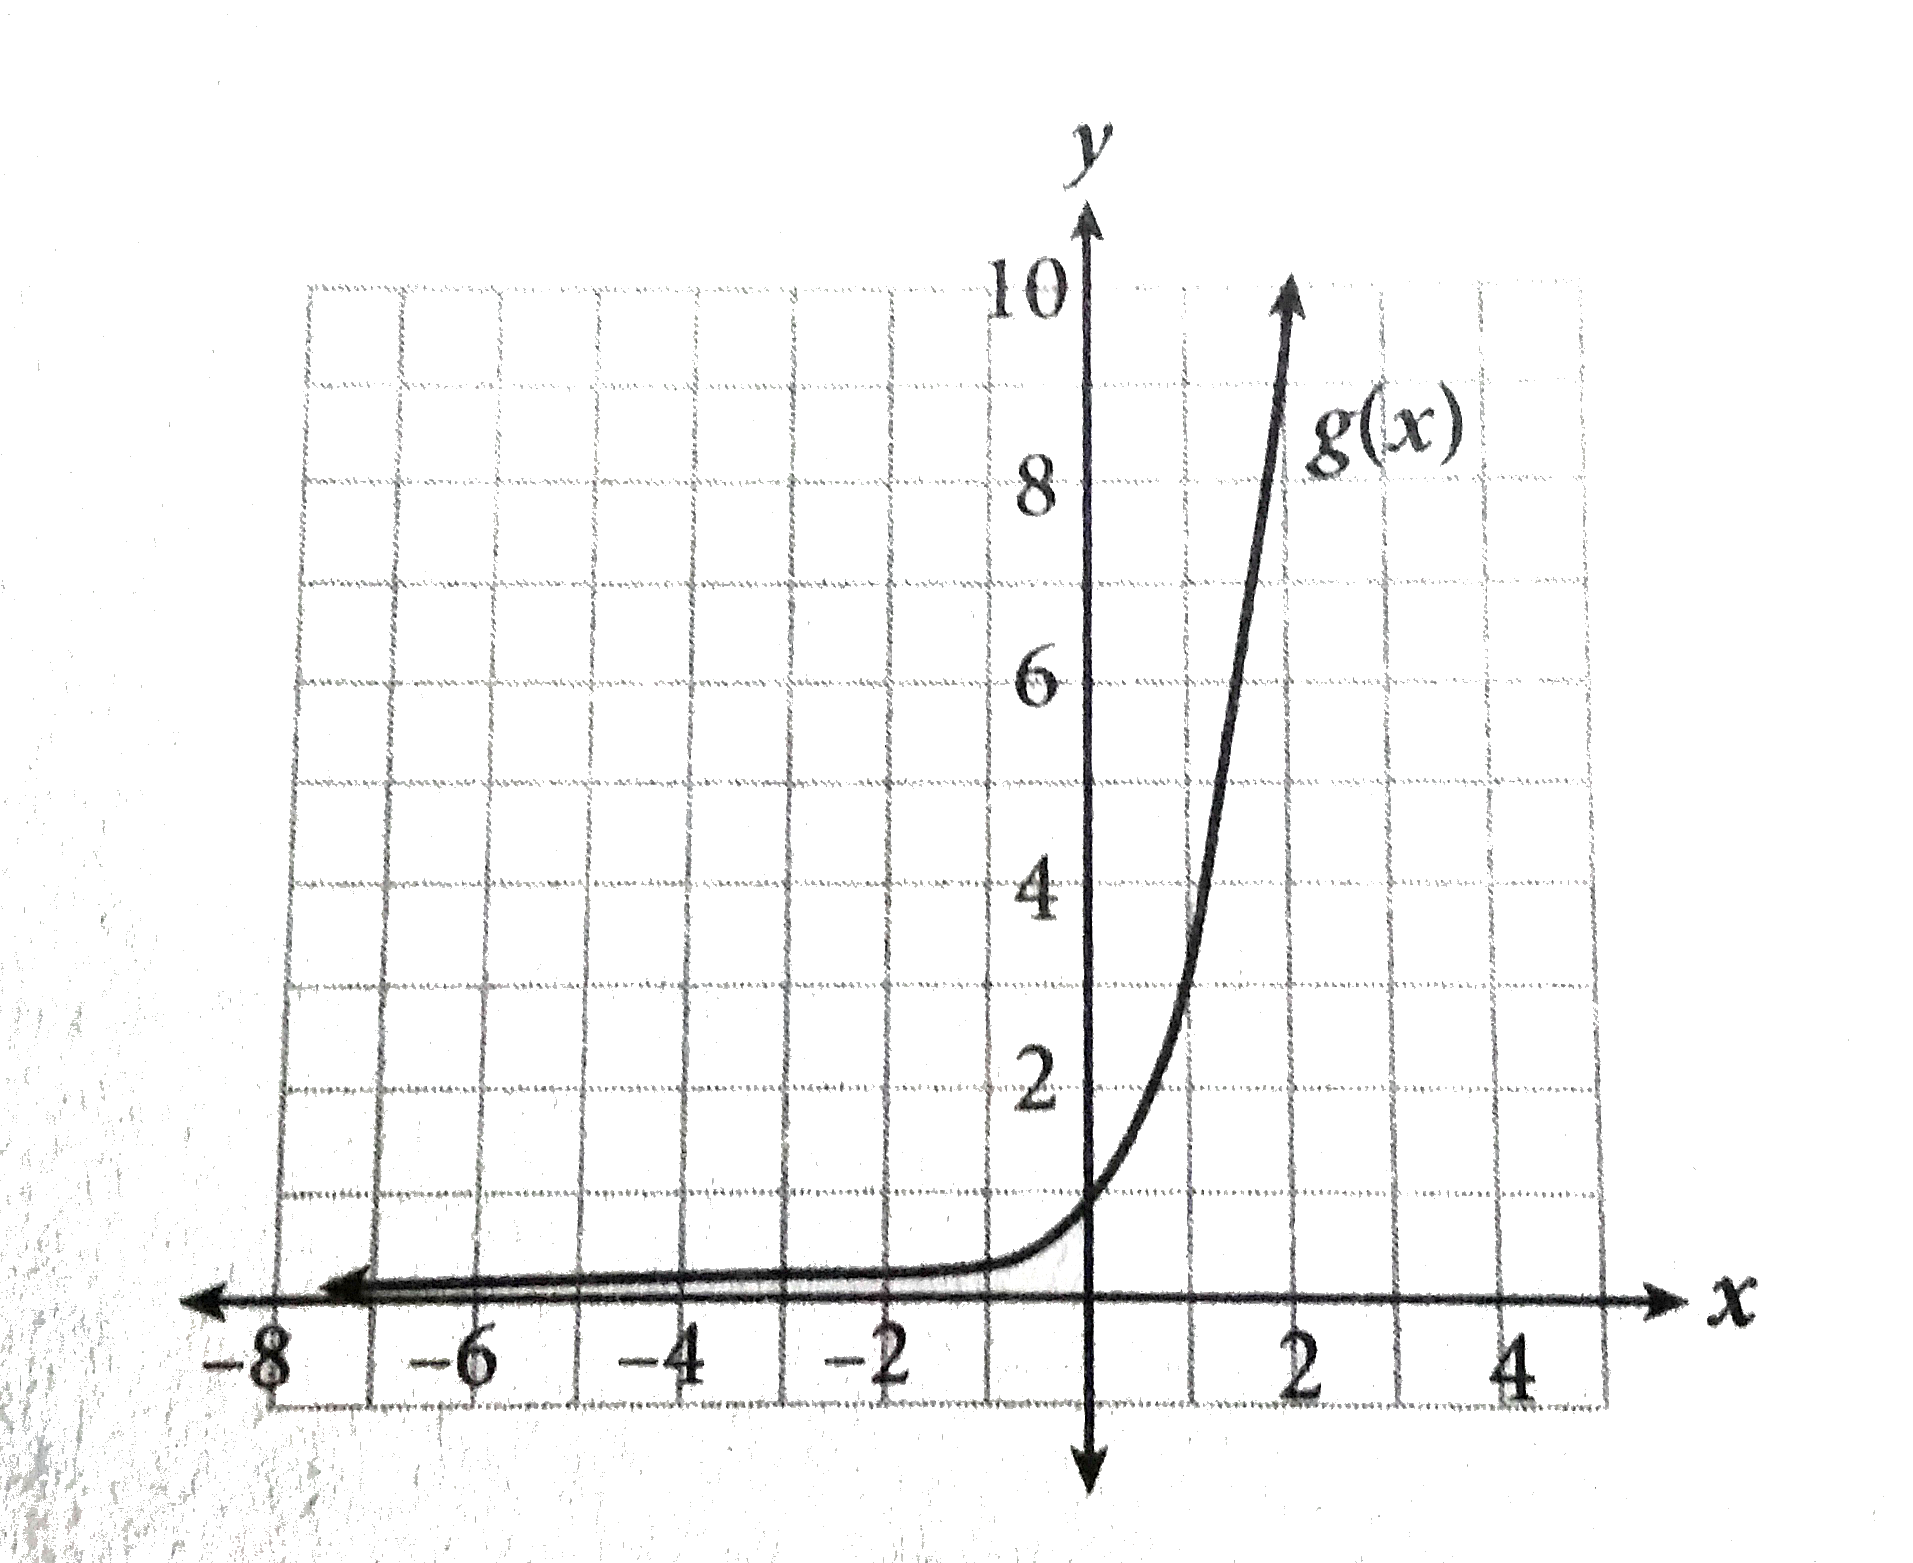
An exponential function g(x) is shown in the figure above. What is the exact value of g(-4)?
View Solution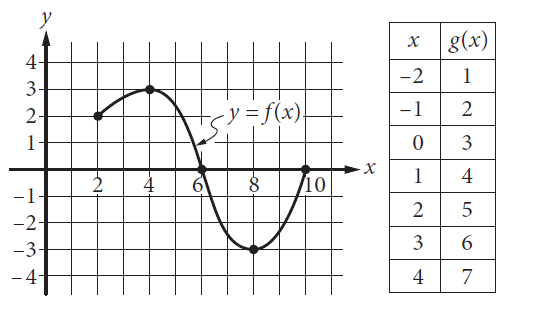
The complete graph of the function f and a table of values for the function g are shown above. The maximum value of f is k.What is the value of g(k) ?
View Solution
Some values of the function f are shown in the table above. Which of the following defines f ?
View Solution

