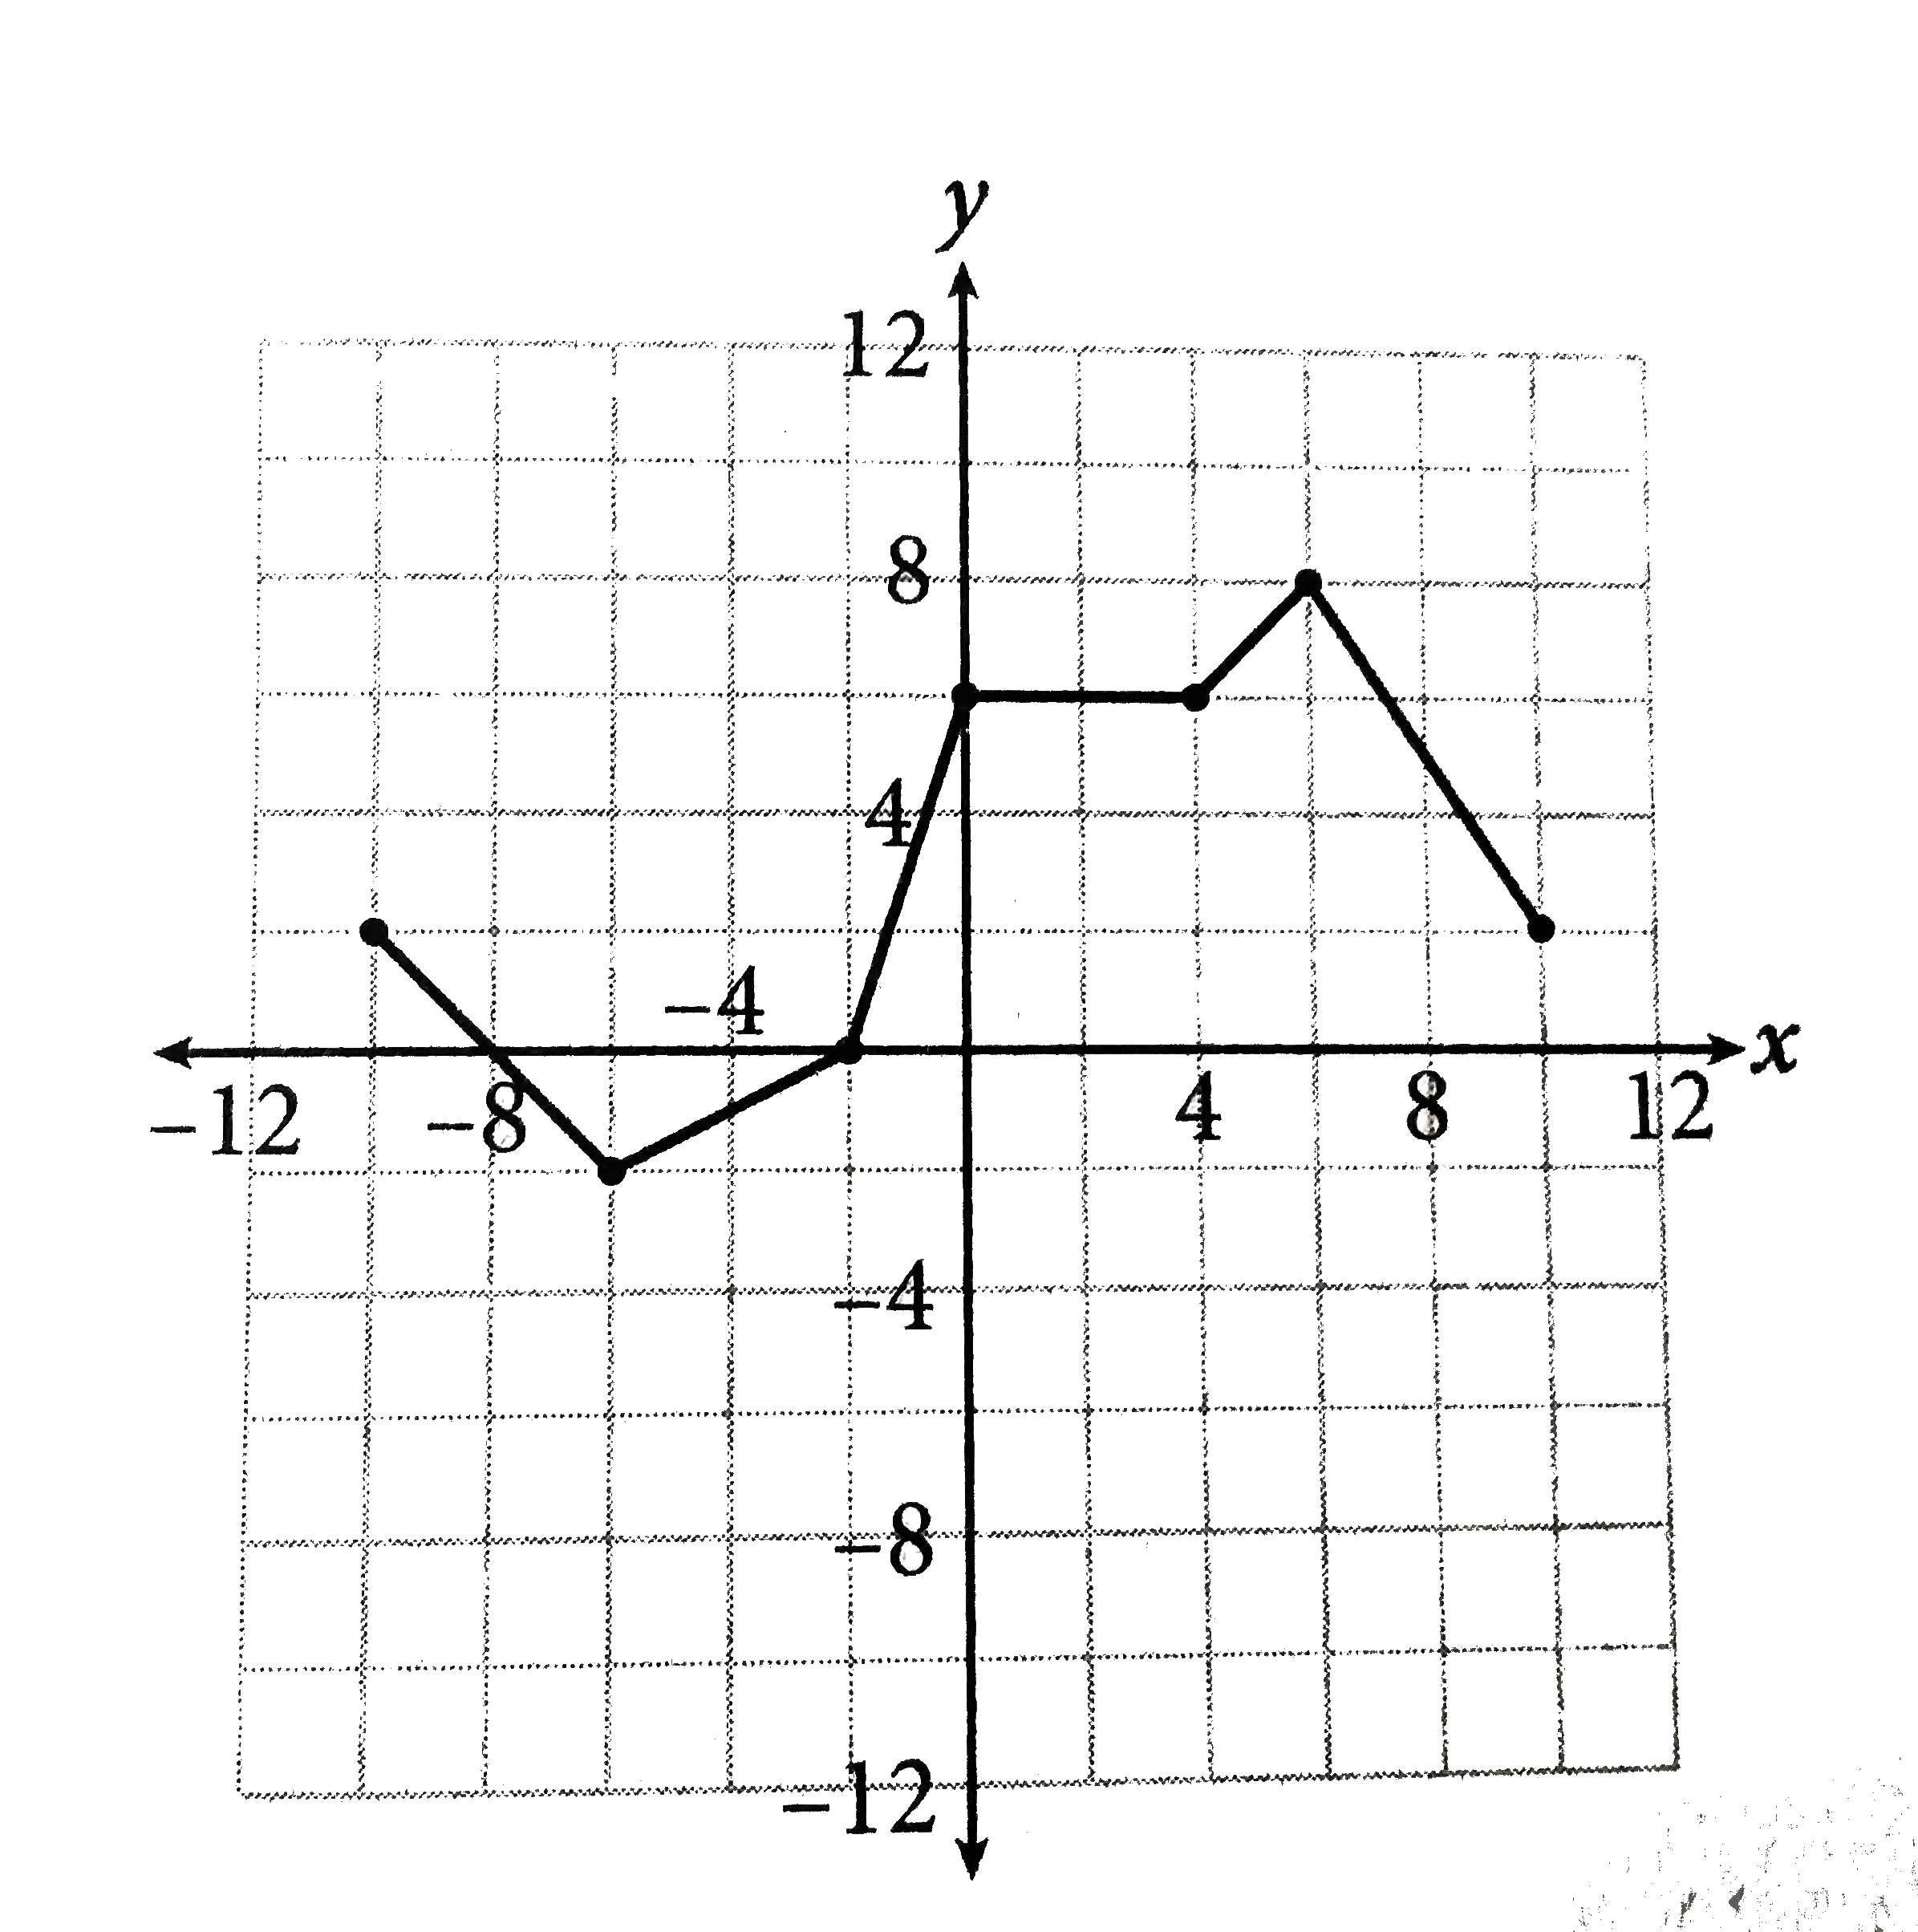
The complete graph of the functions h is shown in the xy plane above. For what value of x is the value of h(x) at its maximum?
A
5
B
6
C
8
D
10
Video Solution
Text Solution
The correct Answer is:B
Difficult:Medium
Category: Passport to Advanced Math/ Functions
Strategic Advice: The maximum of a function is the point at which the range (the y-values) of the fuction is at its highest. Identify that point on the graph, and then determine the corresponding x-value. Pay careful attention to the axis labels-they are not given in increments of 1 . ltbgt Getting to the Answer: The maximum value of h(x) (the highest point h reaches on the graph) is 8. Drop down from the maximum to the x-axis to find that the corresponding x-values is 6, which matches (B).
|
Topper's Solved these Questions
Similar Questions
Knowledge Check
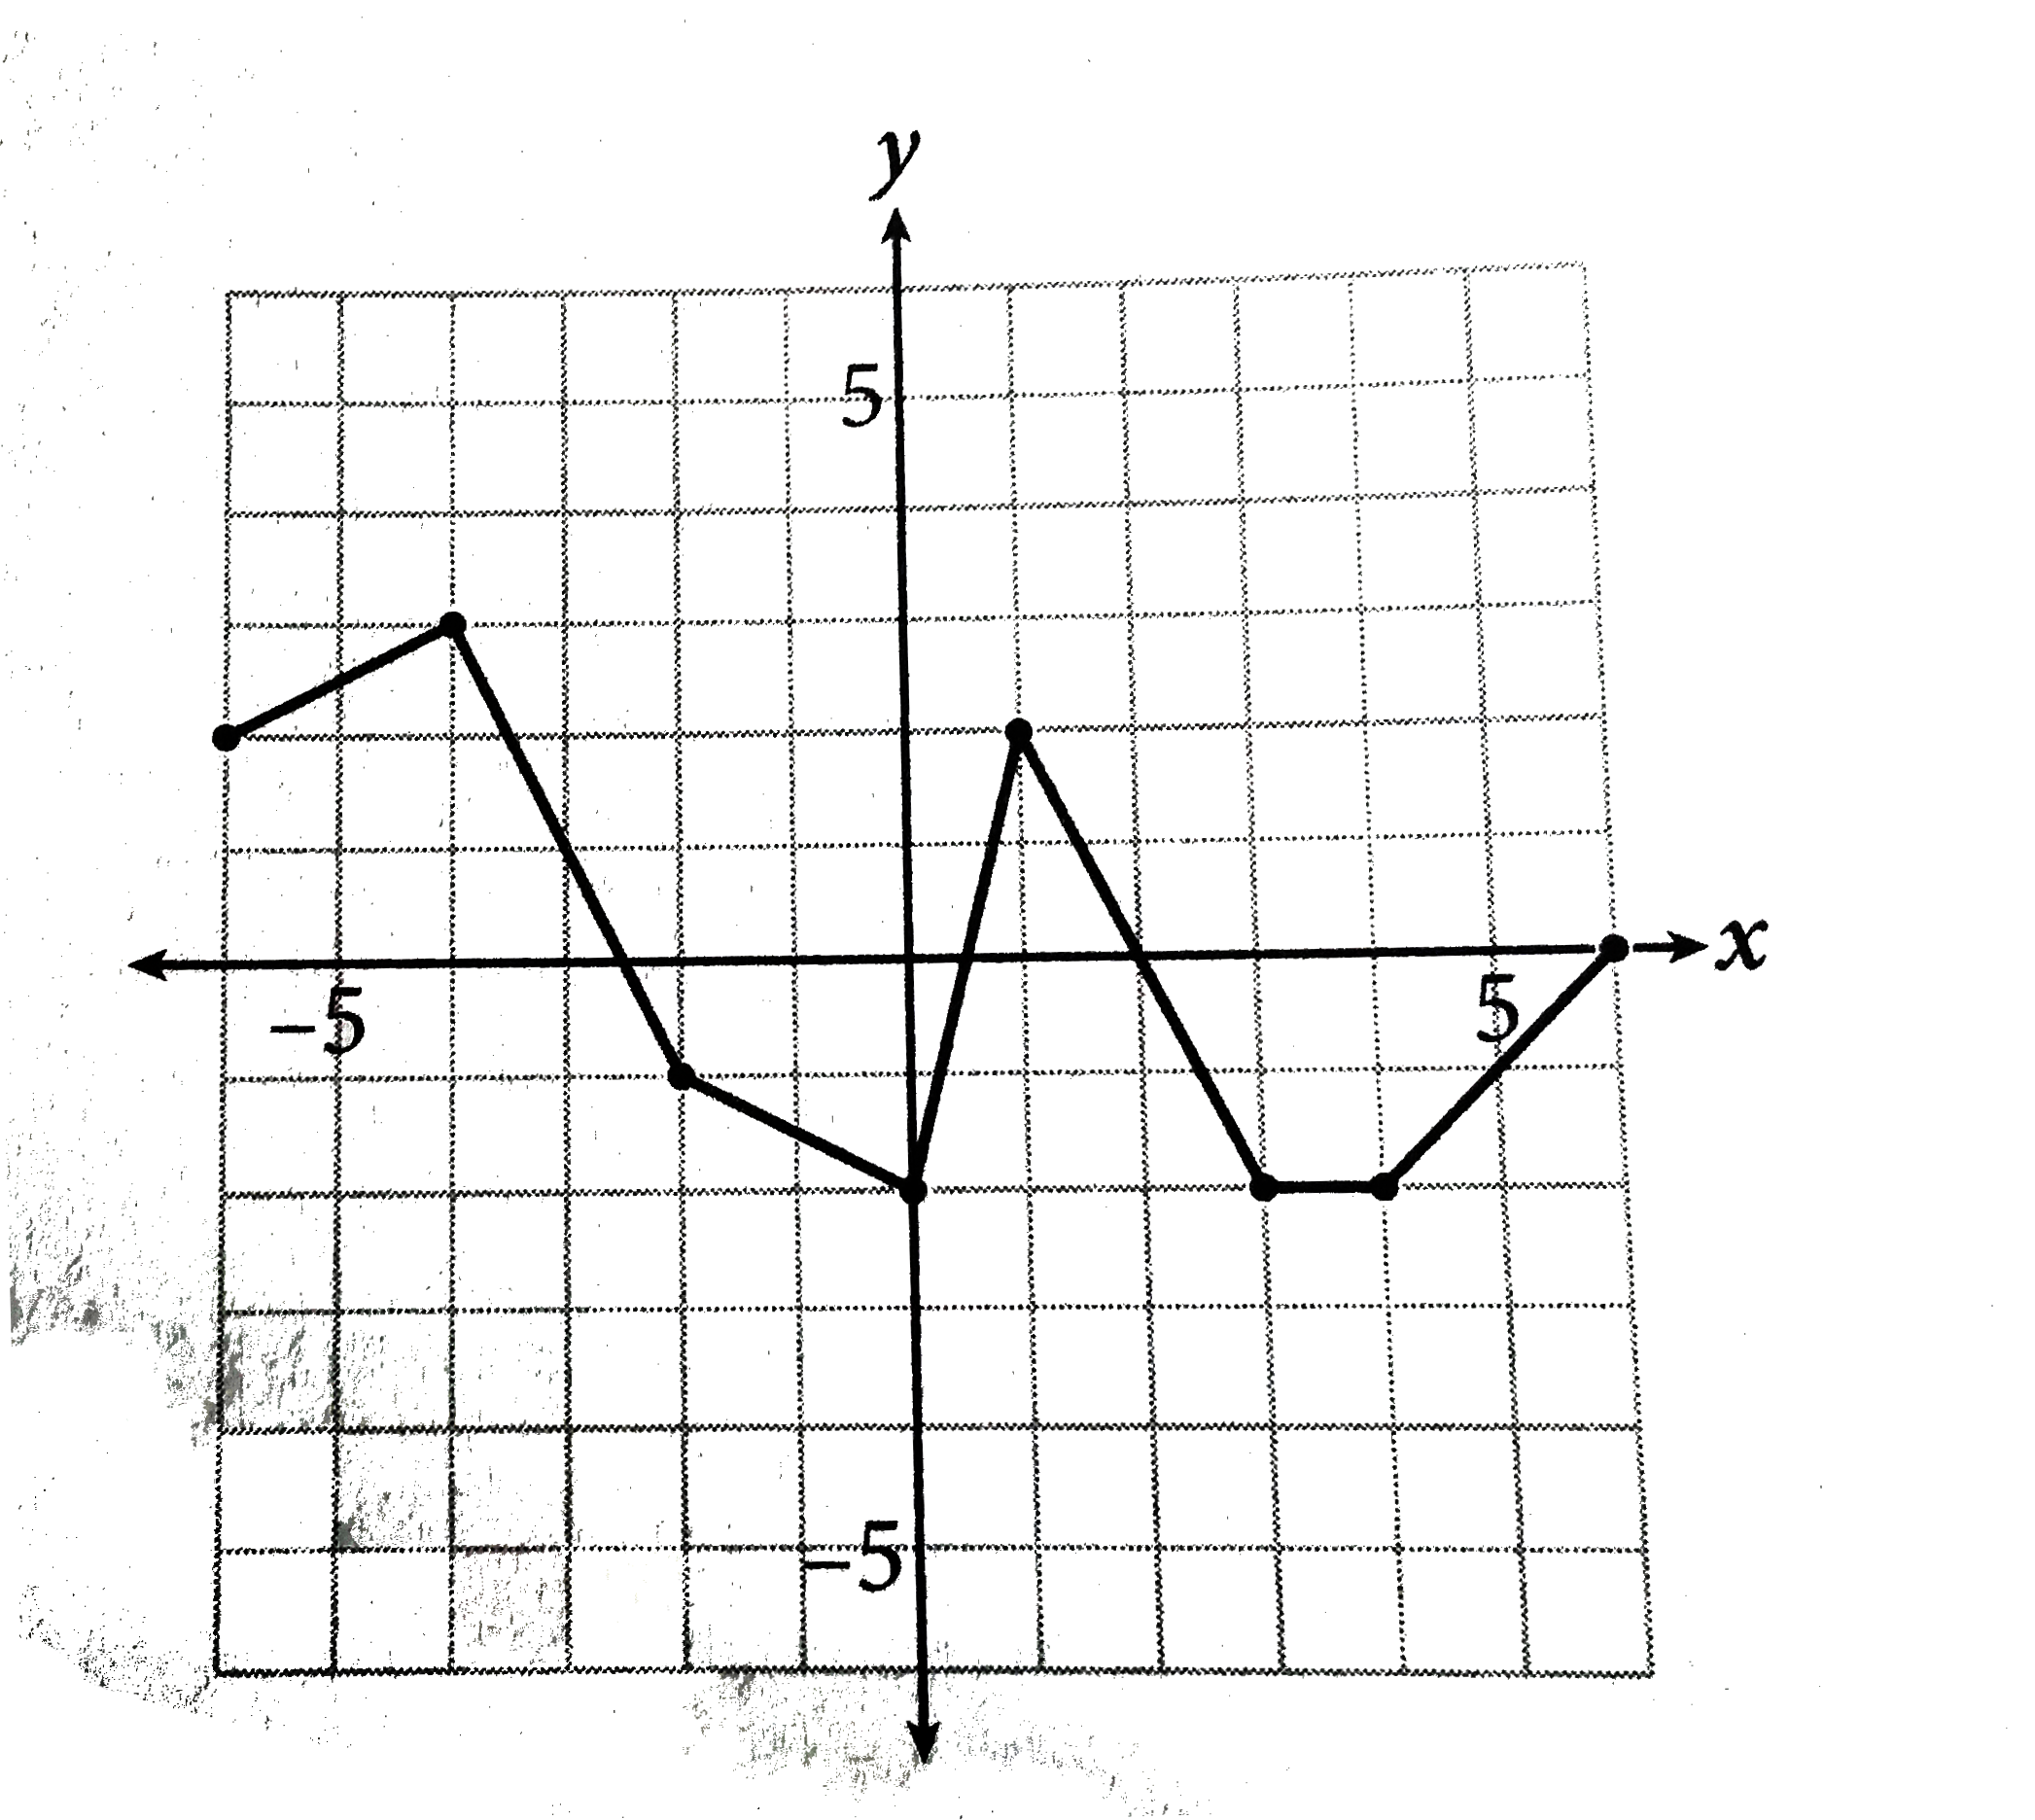
The complete graph of the function f is shown in the xy-plane above. For what value of x is the value of f(x) at its minimum?A−5B−3C−2D3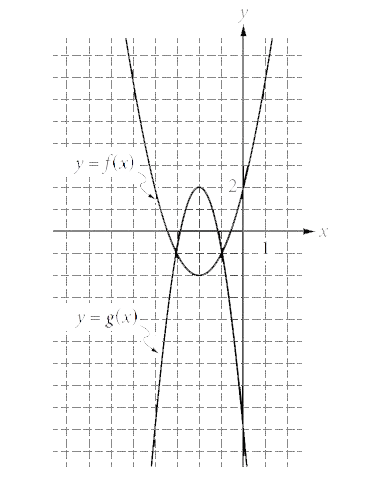
Graphs of the functions f and g are shown in the xy-plane above. For which of the following values of x does f(x)+g(x)=0 ?A−3B−2C−1D0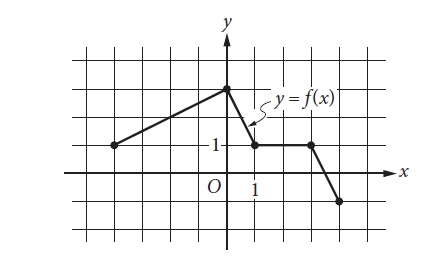
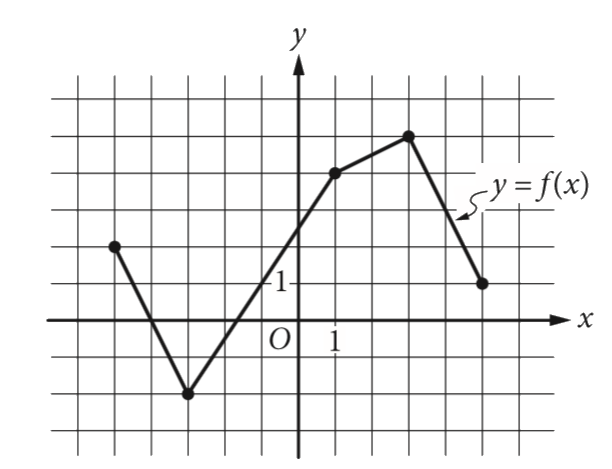
The complete graph of the function f is shown in the xy-plane above. Which of the following are equal to 1 ?
I. f(−4)
II. f(32)
III. f(3)AIII onlyBI and III onlyCII and III onlyDI, II, and III
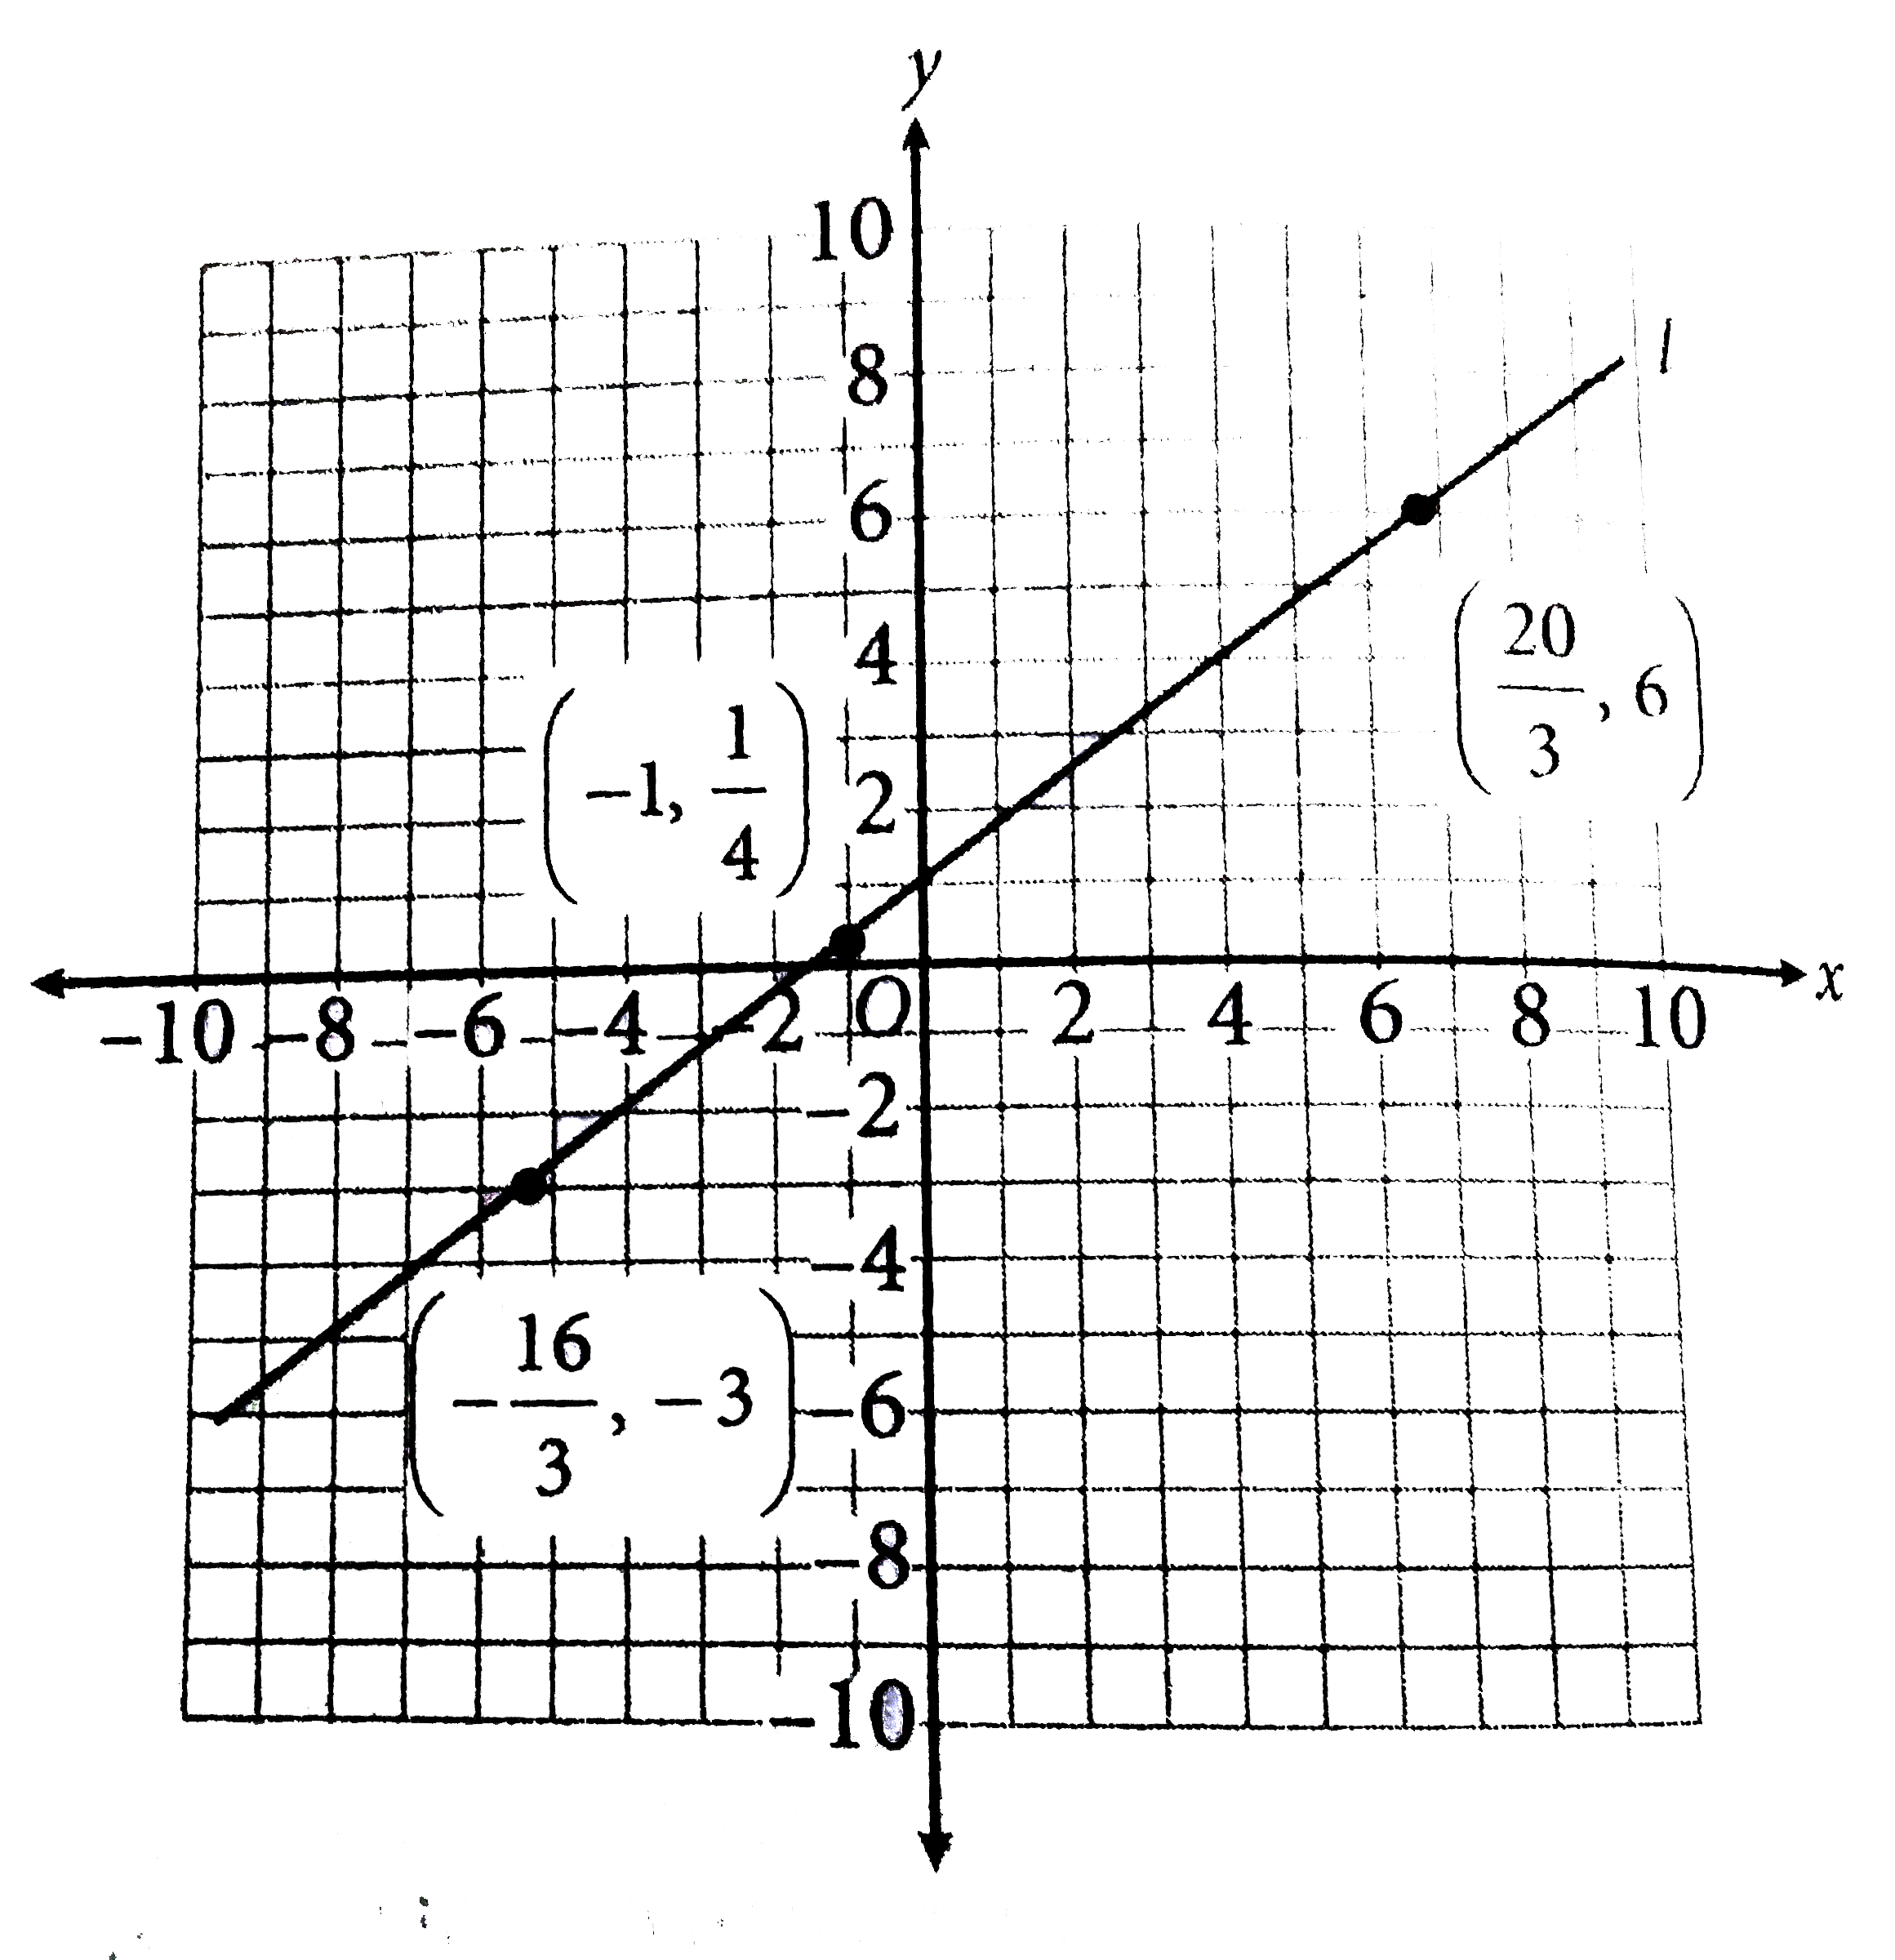
What is the slope of line l shown in the xy-plane above?
View Solution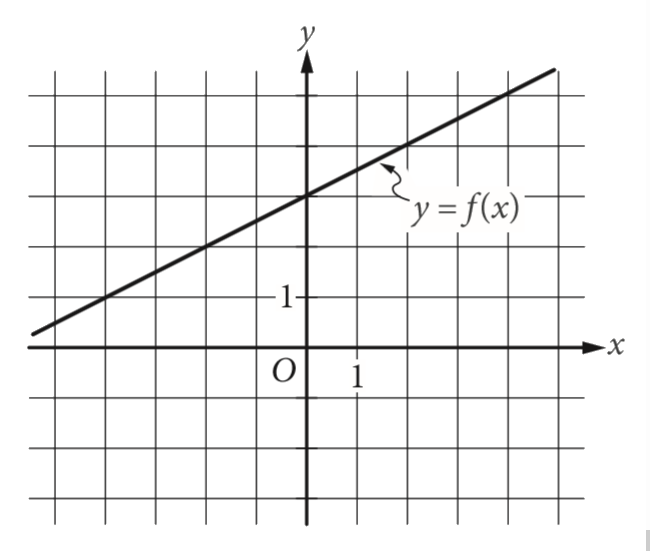
The graph of the linear functions f is shown in the xy-plane above. The slope of the graph of the linear function g is 4 times the slope of the graph of f. IF the graph of g passes through the point (0,-4) what is the value of g(9)?
View Solution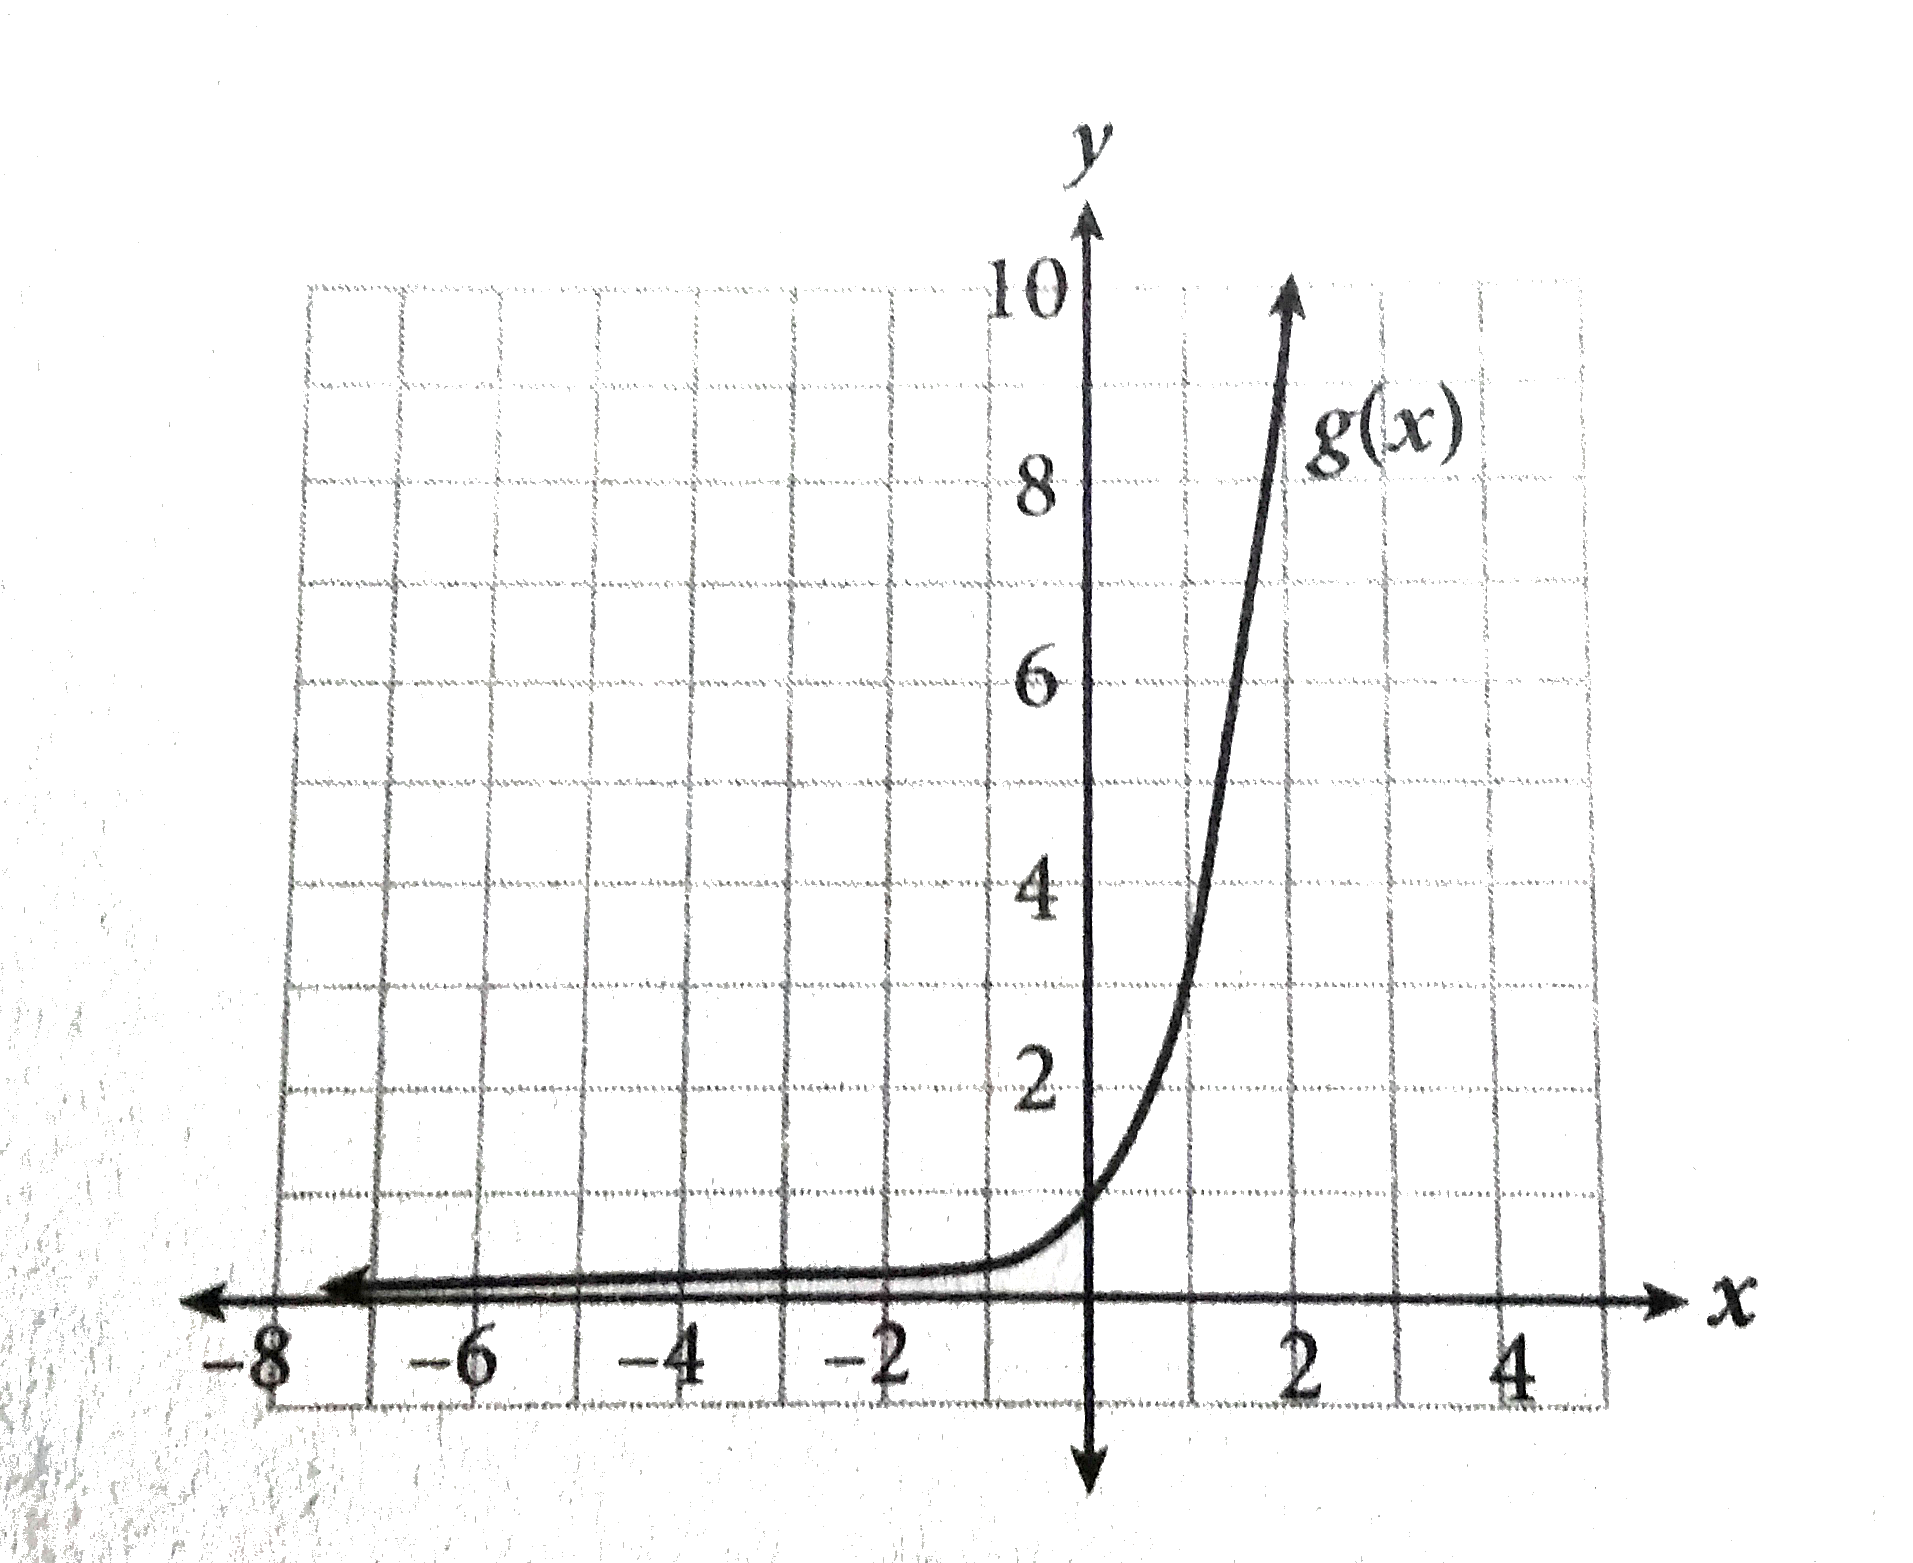
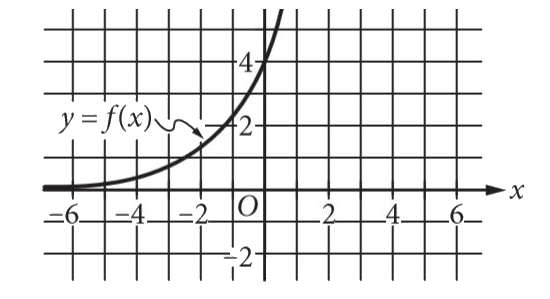
An exponential function g(x) is shown in the figure above. What is the exact value of g(-4)?
View Solution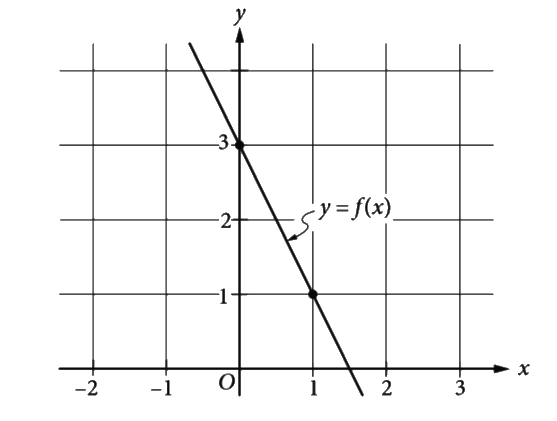
The graph of the linear function f is shown in the xy-plane above. The graph of the linear function g (not shown) is perpendicular to the graph of f and passes through the point (1,3). What is the value of g(0) ?
View Solution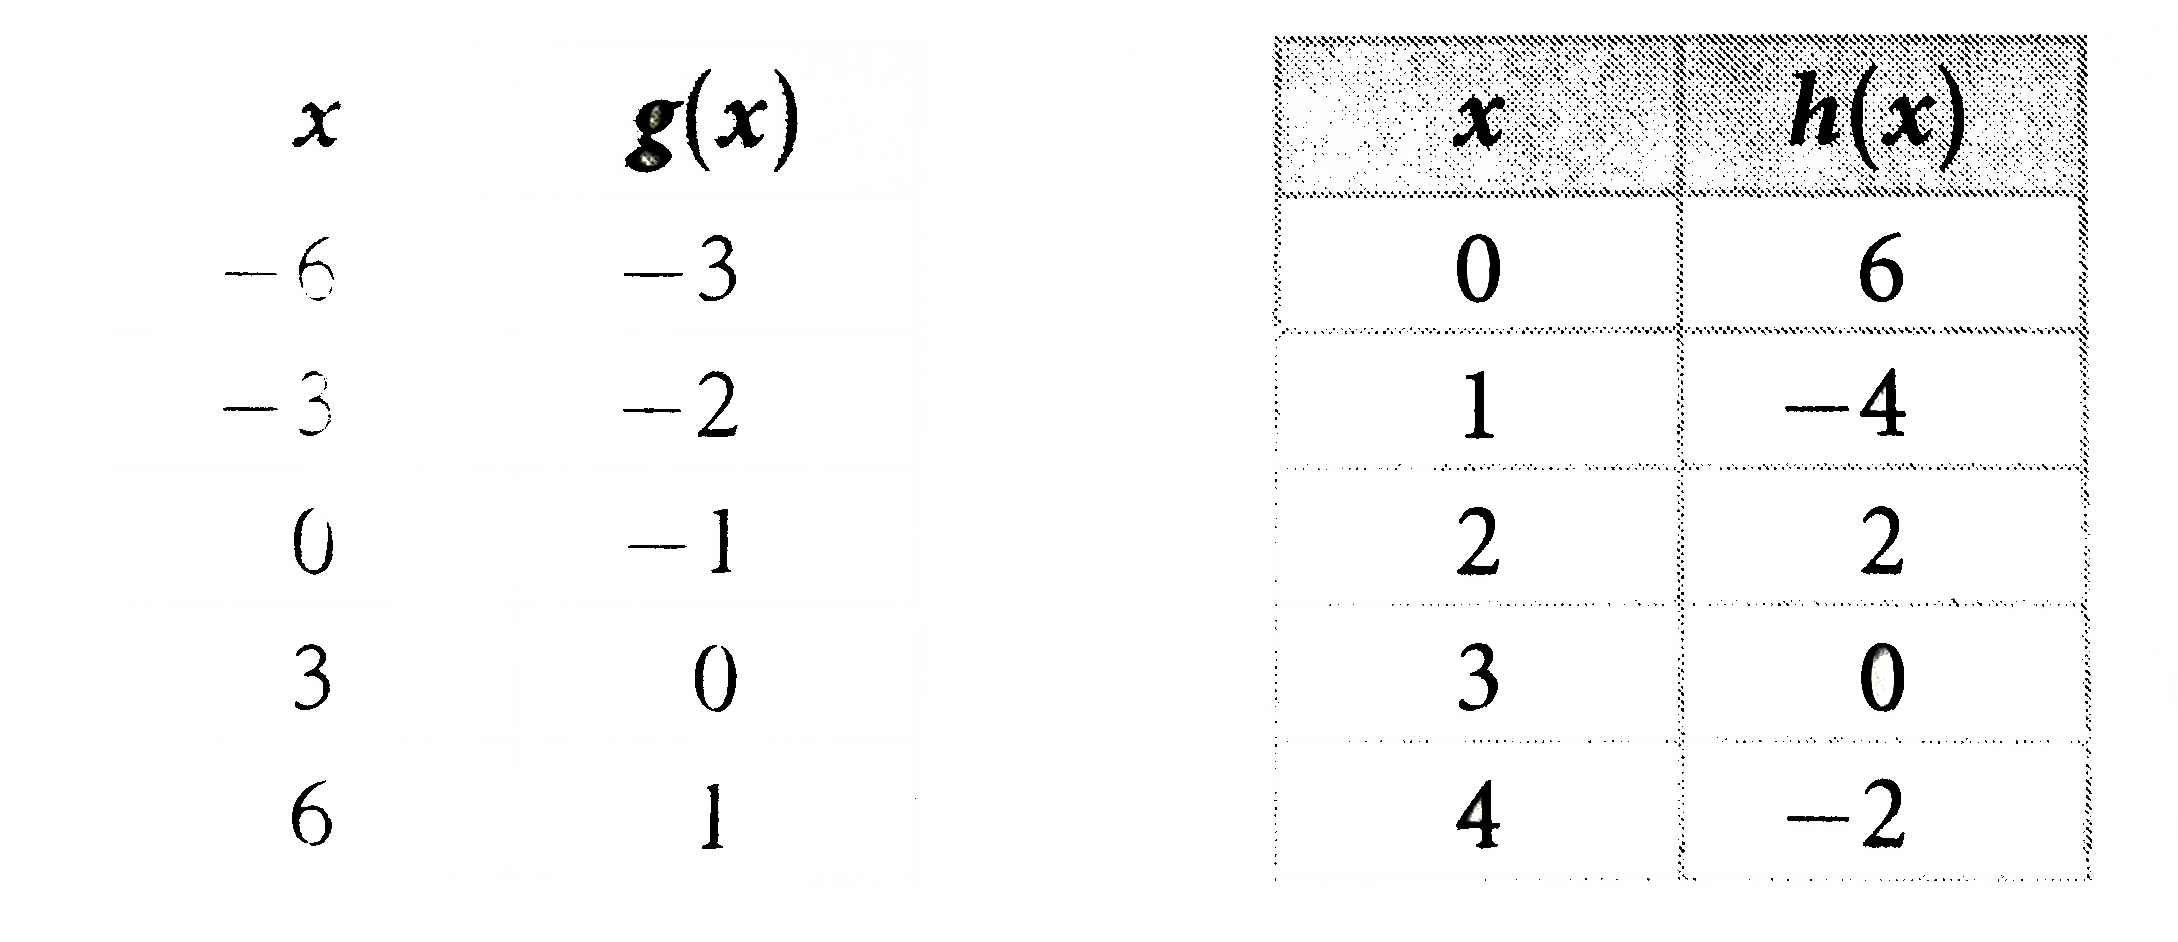
Several values for the functions g (x) and h (x) are shown in the table above. What is the value of g(h(3)) ?
View Solution

